Abstract
Due to rapid urbanization and population growth, identification and management of illegal dump sites has been a global challenge. In this study, satellite imagery and geographic information system were used to map potential illegal dump sites (PIDS). An original analytical approach was developed to identify PIDS using a set of remote sensing indices and vector files. The Network Analysis tool was used to prioritize PIDS considering driving distance between PIDS and neighboring populated points. A total of five variables (Landfills, LST, HCHO, Highways, and EVI) were considered. A study area in Saskatchewan, Canada, was selected, and the identified PIDS account for about 37.3% of the total area. Road network intensity and accessibility appear important to the occurrence of PIDS. Overall road densities in identified PIDS ranged from 0.098 to 0.251 km/km2. All five variables have observable effects on the occurrence of PIDS; however, LST and highways are recommended for future studies due to their higher membership grade and spatial sensitivity. The combination of multiple remote sensing indices and network analysis on PIDS prioritization is advantageous. The proposed PIDS mapping and prioritization method can be easily employed elsewhere.
1. Introduction
1.1. Literature Review
The growing number of illegal dump sites is widely recognized as a global challenge [1,2,3]. Rapid urbanization and population growth were identified as some of the contributing factors to the occurrence of illegal dump sites [4]. Safety and environmental issues related to illegal dump sites have arisen and been reported in different countries [5]. For example, a Malaysian study showed that around 1000 students living in proximity of an illegal dumpsite filled with chemical wastes developed symptoms of respiratory deficiencies [6]. In addition to adverse human health effects, environmental issues such as the leachate generation and greenhouse gas emissions are commonly observed [1,2]. Limoli et al. [7] reported that illegal dumpsites are also responsible for the aesthetic deterioration of the landcover, leading to property price drop in the surrounding areas.
A substantial financial resource is often required to identify illegal dump sites and to remediate the adverse health and environmental impacts of these sites [8,9]. According to Ichinose and Yamamoto [10], UK Environmental Agency estimated the total cost of identifying and remediating illegal dumpsites in UK exceeds 100 million pounds annually. Similarly, it is estimated that the management and treatment costs for 69 illegal dump sites in Japan cost around USD 40 million [11]. As a result, any new approach that minimizes the associated identification and surveillance costs of illegal dump sites would be highly beneficial to environmental governance [12].
A better understanding of the environmental footprints from illegal dumpsites is required to develop new identification, monitoring, prioritization, and management processes. Remote sensing (RS) and geographic information system (GIS) are increasingly common to indirectly evaluate and monitor environmental anomalies, particularly in different aspects of solid waste management [13,14,15]. The following factors are used by researchers to identify potential illegal dump sites (PIDS): elevated land surface temperature [4,16,17], disturbed vegetation cover [4,18], increased population density and anthropogenic activities [8,19,20], and developed road network accessibility [1,3,21]. Multi-criteria decision-making (MCDM) tools are frequently used to integrate multiple factors to identify PIDS [3,22,23]. Seror and Portnov [8] mapped probable illegal construction and demolition waste sites in Haifa district, Israel, using factors such as proximity to the main roads and forest lands, presence of urban areas, and attributes of neighboring ravines such as slope and depth. Similarly, Karimi et al. [3] integrated the length of highways and railways, location of landfills, modified soil adjusted vegetation index, and land surface temperature (LST) to map locations of probable illegal dump sites in Saskatchewan, Canada.
None of the previous studies have prioritized PIDS based on traveling time between the waste generation sites and the disposal sites using GIS Network Analysis. If not properly disposed of, municipal solid waste typically travels a relatively short driving distance before being illegally dumped [24,25]. For example, Mangizvo [26] reported that the majority of unauthorized dump sites in the Midlands Province, Zimbabwe, are located within populated areas where proper solid waste collection system is not provided. Similar spatial distribution characteristics of illegal dump sites are also observed in Poland [1], and Israel [8].Thus, prioritizing PIDS using traveling time from GIS Network Analysis is advantageous from a practical point of view, helping us to better identify and manage the PIDS.
1.2. Objectives and Novelty
The United States’ National Aeronautics and Space Administration (NASA) nighttime light (NTL) satellite imagery, formaldehyde Total Column (HCHO) retrieved from the Aura Ozone Monitoring Instrument (OMI), Enhanced Vegetation Index (EVI), and Land Surface Temperature (LST) collected from MODerate resolution Imaging Spectroradiometer (MODIS) are commonly adopted in environmental studies and are adopted in this study. Discussion on the use of these remote sensing indices is provided in Section 2. The objectives of the current study are to (i) develop an original analytical approach to map PIDS using a new set of remote sensing indices (e.g., NASA NTL, OMI HCHO, MODIS EVI, and MODIS LST) and vector files (e.g., location of active landfills and road network) and (ii) prioritize PIDS in the study area considering neighboring populated points and GIS Network Analysis.
Karimi et al. [3] performed some pioneering work on PIDS detection in Saskatchewan, Canada, using nighttime light imagery. Their study however did not prioritize the identified PIDS using travel time of the waste generator and the area coverage of the disposal sites. Most of the waste studies have applied GIS tools to solve the vehicle routing program and to optimize the waste collection process [27,28]. The use of traveling time of waste generator to prioritize PIDS is original, and the authors are not aware of any published work on this. It is hypothesized that the use of multiple remote sensing indices and GIS Network Analysis on PIDS prioritization are more appropriate form a practical standpoint. A study area in Canada was selected in this study; however, the proposed PIDS mapping and prioritization method can be easily employed elsewhere, as remote sensing satellite imagery is freely available globally.
2. Materials and Methods
Compared with other industrialized nations, Canadians generate more solid waste and recycle less [29,30,31]. Improper management of solid waste and illegal dumping activities were observed on prairie lands and remote areas of Canada. Keske et al. [32] reported unauthorized waste dumping and open burning as common practices in the northern territories of Canada. Illegal dump sites are also identified as a major pollution source in many indigenous communities in the prairies [33]. In this study, Division 11 in Saskatchewan, Canada, was selected as the study area. Division 11 is home to over one-fifth of Saskatchewan’s population and has an area over 17,400 km2.
An original analytical approach using a combination of satellite imagery and GIS Network Analysis was developed. The work plan of the study is shown in Figure 1. Details on the region of interest selection, data collection and analysis, map extraction and implications are separately discussed in Section 2.1, Section 2.2, and Section 2.3, respectively.
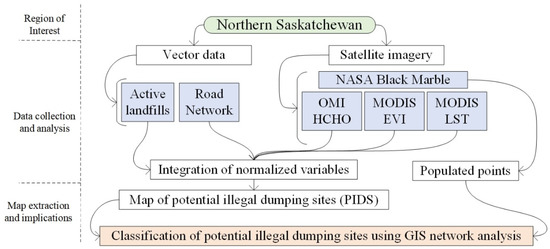
Figure 1.
Workflow of current study including regions of interest selection, data collection and analysis, and map extraction and implications.
2.1. Region of Interest
Unauthorized dumping activities were frequently reported in northern and central Saskatchewan and Alberta [32,33]. Therefore, Division 11 in central Saskatchewan is selected, as shown in Figure 2. Division 11 has a population over 326,000, and there are four active landfills. The City of Saskatoon, the most populated city in the province with over 266,000 people (or approximately 23% of the province’s population), is located near the northwestern corner of the division. Further details about the study area are shown in Table 1.
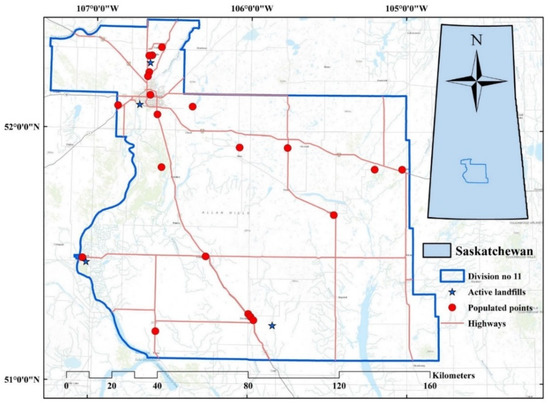
Figure 2.
Location of Division 11 in the province of Saskatchewan, Canada.

Table 1.
Details of the study area.
2.2. Data Collection and Analysis
2.2.1. Active Landfills and Road Network (Vector Files)
The presence of active landfills and accessibility to road networks are considered decisive factors in the occurrence and the scale of illegal dump sites [3,8,19]. As such, both of them are considered in the present study. The location of active landfills, both authorized and unauthorized, was collected from the governmental directory in Saskatchewan [34]. In this study, the road density is defined as the linear length of highways divided by the division area, with a unit of km/km2. The road network dataset, including both highways and grid roads (e.g., local streets), was retrieved from the Statistics Canada portal [35]. For simplicity, only highways were considered for PIDS detection purposes.
2.2.2. MODIS Products (Satellite Imagery)
The Moderate Resolution Imaging Spectroradiometer (MODIS) is an Earth’s surface observing instrument onboard the Terra satellite. The MOD11C3-V6 product, generated from MODIS images, includes LST data with a spatial resolution of 0.05°, equal to the size of the Climate Modeling Grid (CMG). Details of the adopted remote sensing products are shown in Table 2. The MOD11C3 product was retrieved from the NASA Goddard Earth Science Data and Information Services Center called Giovanni [36]. Giovanni classifies the product by disciplines (e.g., aerosols, atmospheric chemistry, cryosphere, hydrology, water, and energy cycle), measurements (e.g., aerosol index, air temperature, CH4, cloud fraction, surface temperature, vegetation), instruments (e.g., MODIS Terra, MODIS Aqua), and others (spatial and temporal resolution, and wavelength). The LST of waste disposal sites is generally higher than their surrounding area due to the biodegradation of the organic fraction of the waste, particularly during summer [37]. As such, time-averaged products were collected during the summer of 2022, as is shown in Table 2. Similarly, the MOD13C2-V6 product was retrieved from MODIS images. MOD13C2 includes an enhanced vegetation index (EVI) with a similar spatial resolution of 0.05°. In this study, EVI was used as an alternative to the Normalized Difference Vegetation Index, as EVI minimizes errors rooted in atmospheric conditions and canopy background noise [38].
Table 2.
Details of satellite imagery and products used in current study.
It is hypothesized that the incorporation of both LST and EVI can be useful in identifying PIDS. For example, higher LST (i.e., biodegradation of organics) and lower vegetation indices (i.e., disturbed land cover with poor vegetation growth) are frequently reported in the vicinity of disposal sites [3,39,40,41,42].
2.2.3. OMI Products (Satellite Imagery)
The Ozone Monitoring Instrument (OMI) onboard the Aura satellite maps pollutants including O3, NO2, SO2, and other aerosols [43]. A daily concentration of formaldehyde (HCHO), a carcinogen in outdoor air, can be obtained by OMI/Aura [44]. Major populated spots are difficult to define precisely in suburb regions in Saskatchewan. Identifying the signs of anthropogenic activity is an indirect way to pinpoint areas with a high probability of illegal dumping activities [45,46,47]. Therefore, formaldehyde, a human source pollution [48], is adopted in the current study as an indirect factor on the occurrence of PIDS. Data were collected for three summer months in 2022, as shown in Table 2.
2.2.4. NASA Black Marble Nighttime (Satellite Imagery)
Due to the presence of smaller unidentified populated areas in remote and suburb communities in Saskatchewan, NASA Black Marble nighttime light satellite imagery is adopted to estimate areas with high anthropogenic activities. The satellite imagery originated from the Visible Infrared Imaging Radiometer Suite (VIIRS) onboard the National Polar-Orbiting Platform (NPP) [49]. NASA’s Black Marble product is primarily designed to provide cloud free imagery nighttime light (NTL) imagery, including but not limited to stray light, terrain, vegetation, and lunar effects [50]. The last available NASA Black Marble NTL imagery in 2016 was adopted in the present work. It is assumed that the spatial distribution of the man-fabricated infrastructures at the study area, derived from the 2016 NTL imagery, remained mostly unchanged from 2016 to 2022. This assumption is reasonable in the study area, given the current local economic activities. For example, the total number of waste facilities in Division 11, including landfills and transfer stations, remained almost constant between 2017 and 2020. Final NTL imagery is classified into binary classes (bright and dark) using equal intervals, and a bright class is made up of an aggregation of neighboring bright pixels.
A bright area was then created using the raster to polygon conversion tool in ArcGIS [51] to encompass the bright pixels and to delineate populated areas (i.e., polygons). The centroids of the polygons were then used to pinpoint the major populated points using polygon to point conversion tool in ArcGIS [52]. A similar approach was successfully applied in the province of Saskatchewan to identify the populated centers at a regional level [25]. Illegal dumping activities are originated from anthropogenic activities, and identification of populated points using NTL helps to better capture the presence of human settlements outside the predefined urban areas. A total of 21 major populated points were identified using NTL in the study area, and are shown as the red circles in Figure 1. The majority of the NTL populated points are located along the major road network. More major populated points are observed near the vicinity of the city of Saskatoon at the northwestern quadrant of the Division 11.
2.2.5. Integration of Normalized Variables
Fuzzification sets the values of variables between 0 and 1 based on the probability of membership, and allows the aggregation of the variables [53]. In solid waste management studies, fuzzification is commonly partnered with multicriteria decision making analysis where different parameters were evaluated simultaneously [13,22,54], particularly in the landfill siting studies [55,56,57] and PIDS mapping [2,24]. Depending on the variables, two types of fuzzification were considered in this study: linear and inverse linear. Proximity to the road network increases the probability of illegal dumping activities, and an inverse linear relationship is assigned (i.e., the shorter the distance, the higher chance of PIDS occurrence). On the other hand, proximity to landfills discourages illegal dumping activities and a linear relationship is assumed (i.e., the shorter the distance, the lower probability of PIDS occurrence). Types of different fuzzification, their implications, and references are tabulated in Table 3.
Table 3.
Types of different fuzzification methods applied to each of the five variables.
2.3. Map Extraction and Implications
2.3.1. Map of Potential Illegal Dump Sites (PIDS)
Once all layers were fuzzified, the simple additive weighting (SAW) method was used to overlay all layers. Since the total number of layers is equal to five, the final overlaid fuzzified layer values ranged from 0 to 5. The SAW method is frequently used to integrate fuzzified variables and to produce the overall ranking [62,63]. Similar to Glanville and Chang [19] and Jakiel et al. [1], the final map was then classified into five distinct classes using the quantile method from “very low” to “very high”. In addition, the “Majority”, “Boundary Clean”, and “Smooth” filters and editing tools were applied to reduce the number of island pixels and smooth the edges of all classes [64,65,66]. Since the focus of this study is to examine the highest PIDS, only the “very high” class is considered further. The final results are converted to polygons using the “Feature to Polygon” conversion tool in ArcGIS [67].
2.3.2. Classification of PIDS Using GIS Network Analysis
Once the PIDS were mapped, the sites were prioritized using GIS Network Analysis. The road network dataset discussed in Section 2.2.1 was used to build the GIS network dataset. Average driving speeds of 80 km/h and 60 km/h were assigned to highways and urban roads, respectively [68]. Attributes such as road condition, gradation, and traffic and turn restrictions are not provided in the network dataset and are not considered in the current study. The maximum allowable traveling time from the major populated points to PIDS, was set at 77.4 min [3,24]. ArcMap 10.5 network analysis extension was used. Both “Closest Facility” and “Service Area” analyses were adopted to calculate the travel time and area coverage (AC), respectively. The “Closest Facility” solver computes the traveling distance between an incident (i.e., major populated point), and a nearby facility (i.e., active landfills) [69]. The “Service Area” solver finds the service area in the neighborhood of a given point (i.e., the centroid of PIDS) [70]. AC area, derived from “Service Area” solver, is used as an indirect way to show how the neighboring area can contribute to a given PIDS within a specified travel time. Thus, the denser the nearby road network and the greater the AC, the higher the likelihood of illegal dumping activities.
2.3.3. Zonal Statistics and the Relative Contribution of the Selected Variables
Zonal average statistics have been used to evaluate different geospatial aspects of a solid waste management system, including disposal sites ranking [62] and suitability siting of future landfills [13]. Zonal statistics describe the relative importance of the variables in each class. In this study, zonal statistics are used to examine the respective contribution of the five variables in the final mapping of the PIDS.
3. Results and Discussion
3.1. Mapping of PIDS
PIDS are identified using the proposed analytical method, and the final PIDS map is shown in Figure 3a. Four PIDSs are scattered within Division 11. Cumulatively, the total area of PIDS accounts for about 6495 km2, or about 37.3% of Division 11 (Table 4). Almost all of the PIDS are surrounded by a number of highways (Figure 3a), and accessibility appears important at the study area. Overall road densities in PIDS ranged from 0.098 to 0.251 km/km2, with an average road density of 0.115 km/km2 (Table 4). The accessibility of the PIDS is slightly higher than the road density in the entire study area of 0.10 (Table 1). PIDS 1 is located at the north of Saskatoon, the most populated city of the province. PIDS 1 is the smallest with an area of 234.8 km2, or about 1.3% of the study area (Table 4). Given the smaller area and the close proximity of a major city (Saskatoon), a patrol car can be easily employed to inspect the PIDS regularly. On the other hand, PIDS 2 is the largest one with an estimated area over 3575 km2 (about 20.5% of the study area). In this case, a drone or an unmanned aerial vehicle is recommended to inspect the area on a monthly basis. The characteristics and contributing factors of each identified PIDSs are separately discussed below.
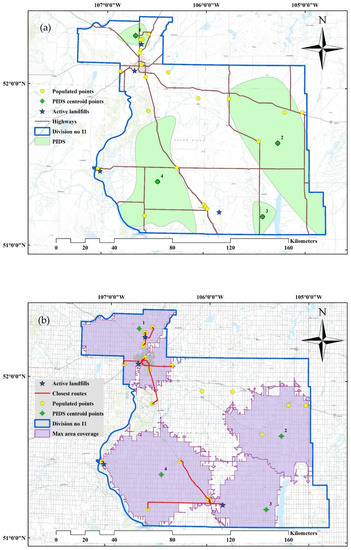
Figure 3.
(a) A PIDS map of the study area; (b) AC map in Saskatchewan, Canada.
Table 4.
Attributes of the identified PIDS in Division 11.
PIDS 1, located near the northwestern corner of Division 11 (Figure 3a), is the closest to the City of Saskatoon. PIDS 1 has the highest road density in the study area (0.25 km/km2, Table 4). As such, the area coverage of the major populated points is also the largest (AC = 9, Table 4). The majority of these major populated points are distributed along a southern–northern highway (Figure 3a and Figure 4a), probably due to urban sprawl. Sizo et al. [71] showed that the lack of detailed zoning plan for urban development near Saskatoon has stressed the conservation efforts of wetlands. Likewise, Habibi and Asadi [72] indicated that the urban sprawl might be due to absence of long-term land use management, extensive use of strip development of small industrial and residential communities, and leap-frog development along the roads and major highways. However, the presence of two active landfills in AC 1 (Figure 3b) along with a shorter average travel time from the major populated points to adjacent landfills (26.1 min, Table 4) might mitigate potential illegal dumping activities.
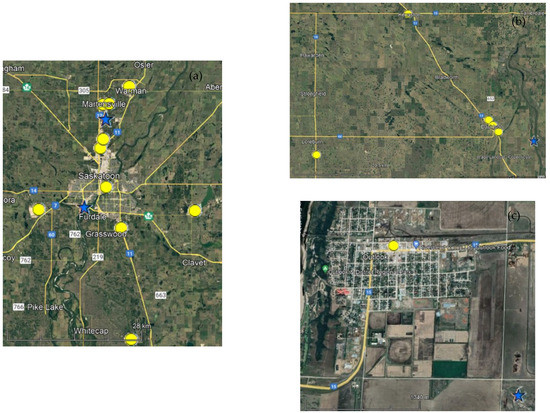
Figure 4.
Populated points and active landfills in (a) PIDS 1 (b) PIDS 3 and (c) PIDS 4. The blue stars represent the active landfills, and the yellow circles represent the major populated points. Map source: [77].
PIDS 2, with a size of over one fifth of the study area (3575.0 km2), is located along the eastern edge of the study area, as shown in Figure 3a. A larger AC 2 of 2482.6 km2 and the absence of an active landfill (Figure 3b) might encourage illegal dumping activities. Unlike other divisions in Saskatchewan, significantly more transfer stations are used in this division. Ghosh and Ng [73] examined the waste management system in Saskatchewan and reported that Division 11 had the smallest landfill to transfer station ratio of 0.4 in 2017. However, the road density of PIDS 2 (0.098 km/km2, Table 4) is also the lowest. Therefore, accessibility of the major populated points is only moderate. It appears that the distribution of major populated points in Division 11 is not properly reflected in the design of the road network. Richter et al. [74] also reported that the distribution of waste management facilities and populated points are not well-aligned with the divisional boundaries in Saskatchewan and recommended a new tessellation-based regional waste management system.
PIDS 3, with an area size of 270.0 km2, or 1.5% of the study area, is located in the southern central part of the study area (Figure 3a). AC 3 has the smallest area coverage in the study (1671.1 km2, Table 4), and there are no major populated points. The presence of an active landfill in the west (Figure 3b) might mitigate illegal dumping activities.
PIDS 4, with an area of 2415.5 km2, or 13.9% of the study area, is located at the southwestern corner (Figure 3a). PIDS 4 has the largest AC (AC 4 = 3360.0 km2, Table 4), probably due to the unique spatial distribution of major populated points and an interconnected road network. Half of the major populated points, three out of six, were located in close proximity with each other near the southeast corner. An active landfill in AC3 is located nearby (Figure 3b and Figure 4b), and supports the three major populated points at the southeast of AC 4. The three major populated points are located near the intersection of Highways 11 and 44 and the town of Davidson (Figure 4b). As shown in Figure 4b, considerably longer travel time is required for the residents at Kenaston and Loreburn to access the nearby landfill (Figure 4b), with an average travel time of 69.8 min. The village of Kenaston implemented a year-round biweekly schedule for garbage pickup for its residents [75] which helps to reduce illegal dumping activities. The populated point at the south of Loreburn is a pipeline station facility that belongs to Enbridge Piplines Inc., which is committed to sustainable waste management practices [76]. The residents of the Town of Outlook are served by its own municipal landfill located southeast of the town, with an average travel time of only 6.43 min (Figure 3b and Figure 4c). The average travel time from all populated points in AC 4 to their nearest landfill is about 35.3 min (Table 4).
Table 4 shows the attributes of the identified PIDS in Division 11. PIDS 1 has the most intensified road network (highest road density = 0.251 km/km2) and the highest coverage of 9 populated points. On the other hand, PIDS 2 has the largest PIDS area of 3575.0 km2 and the longest cumulative highway of 350.2 km. However, PIDS 4 has the largest AC of 3360.0 km2 and the longest average travel time from neighboring populated points to adjacent landfills of 35.3 min. The results suggest that all these factors have observable effects on the occurrence of PIDS in the study area. The magnitude of these effects are however not identical.
3.2. Variables’ Zonal Statistics in PIDS
Zonal statistics of each variable are shown in Figure 5. A higher average membership grade (closer to unity) shows a greater contribution of a variable in identification of PIDS in Division 11, while a lower average grade shows less contribution. Standard deviation (STD) is helpful in evaluating the spatial sensitivity of a given variable, and a higher STD shows a higher sensitivity to spatial changes. An effective variable in PIDS identification should have both high membership grade and high STD.
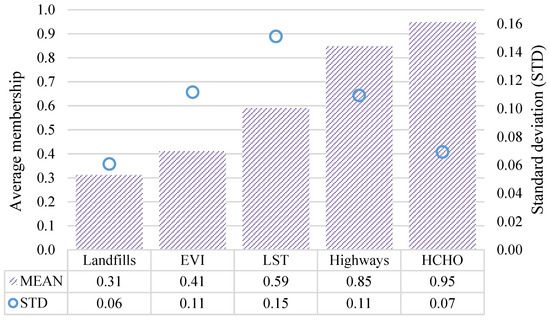
Figure 5.
Zonal statistics of five variables and their contributions to PIDS occurrence.
The Euclidean distance between active landfills and major populated points (Landfills) and vegetation greenness of the landcover (EVI) have moderate impacts on PIDS occurrence, with average membership grades of 0.31 and 0.41, respectively. The distance to landfills in Division 11 appears to be less important than other factors. It is believed the operation hours of landfills and the geospatial location of transfer stations may have impacted the PIDS occurrence in Division 11; however, they are not explicitly considered in the current study. Predominating uniform land cover of grassland and shrub land in northern prairies might undermine the importance of EVI in PIDS identification.
Higher average membership grades (>0.5) are observed for LST and highways. The factors are also spatially sensitive, with STDs of 0.15 and 0.11 for LST and highways, respectively. The results suggest that both parameters are good indicators in mapping PIDS in Division 11. It has been widely reported that LST can be used as a proxy to identify landfills and illegal disposal sites [3,78,79]. In addition, the majority of illegal dumping activities were reported either in the vicinity of the road network or in places with greater accessibility [1,80,81]. Both factors are recommended for studies on the identification of PIDS.
The membership grade for HCHO is the highest, 0.95. However, the STD is quite low (STD = 0.07). The concentration of formaldehyde in the atmosphere is directly related to the level of anthropogenic activity in a given location, and therefore related to the PIDS occurrence. In other words, the higher the degree of anthropogenic activity in a region, the higher probability of PIDS. Given the lower STD (<0.1), the parameter may not be an effective factor on the identification of PID. The lower STD can be originated from the dispersion of the HCHO in the atmosphere, resulting in a homogeneous distribution of atmospheric HCHO concentrations.
3.3. Limitations
This study proposes an original analytical framework to map potential illegal dump sites in Saskatchewan, Canada. High-resolution satellite imagery and/or site visits are required to pinpoint and to verify the exact locations of PIDS in a given region. As such, a long-term field study is recommended to verify the development of actual illegal dump sites. The proposed method is intended to serve as an efficient screening tool for regulators and policy makers, especially suitable in Canada [82,83]. Please note that the proposed method is unable to pinpoint the exact locations of these illegal dump sites.
For simplicity, only the highway network is considered in the current study, and unpaved surfaces are ignored in the GIS Network Analysis. The use of a more comprehensive road network may improve the accuracy of model. We also assumed equal weight for each variable on the PIDS occurrence. A sensitivity analysis on the variables is also recommended.
4. Conclusions
Identifying PIDS is a worldwide challenge for both developing and developed countries due to the higher waste tipping fees and increasingly stringent environmental guidelines and regulations. Detection, monitoring, and remediation of illegal disposal sites are time consuming and often require substantial financial resources. In the current study, a systematic framework is proposed to identify PIDS using a combination of satellite imagery and GIS Network Analysis. A 17,400 km2 study area in Saskatchewan, Canada, is considered. Given the availability of free satellite imagery across the globe, the proposed analytical framework is applicable in other areas.
A total of five variables (Landfills, LST, HCHO, Highways, and EVI) were used to identify and prioritize PIDS. In this study, identified PIDS account for about 37.3% of the study area. Road network intensity and accessibility appear important to the occurrence of PIDS. Overall road densities in identified PIDS ranged from 0.098 to 0.251 km/km2, with an average road density of 0.115 km/km2.
Results suggested that different factors influenced the occurrence of PIDS in different ways. PIDS 1 has the most intensified road and the most populated points. PIDS 2 has the largest PIDS area of 3575.0 km2 and the longest cumulative highway. PIDS 4 has the largest AC and the longest average travel time. All considered factors have observable effects on the occurrence of PIDS within the study area. Among the five variables, LST and highways are recommended for identification of PIDS. Both factors showed higher membership grades over 0.5 and higher spatial sensitivity (STD > 0.1) within the study area. The membership grade for HCHO is the highest; however, the parameter is less spatially sensitive, limiting its potential as a PIDS indicator. Results from the case study suggest that the combination of multiple remote sensing indices and network analysis on PIDS prioritization is more advantageous from a practical standpoint. The analytical framework presented here can be easily adopted in other solid waste management systems.
Author Contributions
Conceptualization, N.K. and K.T.W.N.; software, N.K.; validation, N.K.; formal analysis, K.T.W.N.; investigation, N.K.; data curation, N.K.; writing—original draft preparation, N.K.; writing—review and editing, K.T.W.N.; supervision, K.T.W.N. All authors have read and agreed to the published version of the manuscript.
Funding
This research received no external funding.
Institutional Review Board Statement
Not applicable.
Informed Consent Statement
Not applicable.
Data Availability Statement
Not applicable.
Conflicts of Interest
The authors declare no conflict of interest.
References
- Jakiel, M.; Bernatek-Jakiel, A.; Gajda, A.; Filiks, M.; Pufelska, M. Spatial and temporal distribution of illegal dumping sites in the nature protected area: The Ojców National Park, Poland. J. Environ. Plan. Manag. 2019, 62, 286–305. [Google Scholar] [CrossRef]
- Quesada-Ruiz, L.C.; Rodriguez-Galiano, V.; Jordá-Borrell, R. Characterization and mapping of illegal landfill potential occurrence in the Canary Islands. Waste Manag. 2019, 85, 506–518. [Google Scholar] [CrossRef] [PubMed]
- Karimi, N.; Ng, K.T.W.; Richter, A. Development and application of an analytical framework for mapping probable illegal dumping sites using nighttime light imagery and various remote sensing indices. Waste Manag. 2022, 143, 195–205. [Google Scholar] [CrossRef] [PubMed]
- Mahmood, K.; Batool, S.A.; Chaudhry, M.N. Studying bio-thermal effects at and around MSW dumps using Satellite Remote Sensing and GIS. Waste Manag. 2016, 55, 118–128. [Google Scholar] [CrossRef] [PubMed]
- Jiang, P.; Fan, Y.V.; Zhou, J.; Zheng, M.; Liu, X.; Klemeš, J.J. Data-driven analytical framework for waste-dumping behaviour analysis to facilitate policy regulations. Waste Manag. 2020, 103, 285–295. [Google Scholar] [CrossRef]
- Ibrahim, M.F.; Hod, R.; Toha, H.R.; Mohammed Nawi, A.; Idris, I.B.; Mohd Yusoff, H.; Sahani, M. The impacts of illegal toxic waste dumping on children’s health: A review and case study from Pasir Gudang, Malaysia. Int. J. Environ. Res. Public Health 2021, 18, 2221. [Google Scholar] [CrossRef]
- Limoli, A.; Garzia, E.; De Pretto, A.; De Muri, C. Illegal landfill in Italy (EU)—A multidisciplinary approach. Environ. Forensics 2019, 20, 26–38. [Google Scholar] [CrossRef]
- Seror, N.; Portnov, B.A. Identifying areas under potential risk of illegal construction and demolition waste dumping using GIS tools. Waste Manag. 2018, 75, 22–29. [Google Scholar] [CrossRef]
- Otwong, A.; Jongmeewasin, S.; Phenrat, T. Legal obstacles for the circular economy in Thailand: Illegal dumping of recyclable hazardous industrial waste. J. Clean. Prod. 2021, 302, 126969. [Google Scholar] [CrossRef]
- Ichinose, D.; Yamamoto, M. On the relationship between the provision of waste management service and illegal dumping. Resour. Energy Econ. 2011, 33, 79–93. [Google Scholar] [CrossRef]
- Sasao, T. Econometric analysis of cleanup of illegal dumping sites in Japan: Removal or remedial actions? Environ. Econ. Policy Stud. 2016, 18, 485–497. [Google Scholar] [CrossRef]
- Di Fiore, V.; Cavuoto, G.; Punzo, M.; Tarallo, D.; Casazza, M.; Guarriello, S.M.; Lega, M. Integrated hierarchical geo-environmental survey strategy applied to the detection and investigation of an illegal landfill: A case study in the Campania Region (Southern Italy). Forensic Sci. Int. 2017, 279, 96–105. [Google Scholar] [CrossRef] [PubMed]
- Karimi, N.; Richter, A.; Ng, K.T.W. Siting and ranking municipal landfill sites in regional scale using nighttime satellite imagery. J. Environ. Manag. 2020, 256, 109942. [Google Scholar] [CrossRef] [PubMed]
- Richter, A.; Ng, K.T.W.; Karimi, N.; Chang, W. Developing a novel proximity analysis approach for assessment of waste management cost efficiency in low population density regions. Sustain. Cities Soc. 2021, 65, 102583. [Google Scholar] [CrossRef]
- Ghosh, A.; Richter, A.; Ng, K.T.W. Applications of Geographic Information Systems to site waste facilities in Saskatchewan—Phase 1. In Proceedings of the Canadian Society of Civil Engineering Annual Conference 2021, Lecture Notes in Civil Engineering, Ottawa, ON, Canada, 14–17 June 2011; Volume 249, pp. 173–182. [Google Scholar] [CrossRef]
- Abu Qdais, H.; Shatnawi, N. Assessing and predicting landfill surface temperature using remote sensing and an artificial neural network. Int. J. Remote Sens. 2019, 40, 9556–9571. [Google Scholar] [CrossRef]
- Karimi, N.; Ng, K.T.W.; Richter, A. Prediction of fugitive landfill gas hotspots using a random forest algorithm and Sentinel-2 data. Sustain. Cities Soc. 2021, 73, 103097. [Google Scholar] [CrossRef]
- Mahmood, K.; Batool, S.A.; Chaudhary, M.N.; Ul-Haq, Z. Ranking criteria for assessment of municipal solid waste dumping sites. Arch. Environ. Prot. 2017, 43, 95–105. [Google Scholar] [CrossRef]
- Glanville, K.; Chang, H.C. Mapping illegal domestic waste disposal potential to support waste management efforts in Queensland, Australia. Int. J. Geogr. Inf. Sci. 2015, 29, 1042–1058. [Google Scholar] [CrossRef]
- Matsumoto, S.; Takeuchi, K. The effect of community characteristics on the frequency of illegal dumping. Environ. Econ. Policy Stud. 2011, 13, 177–193. [Google Scholar] [CrossRef]
- Viazanko, A. Predictive Model of Illegal Dumpsites in Westmoreland and York Counties, Pennsylvania. Master’s Thesis, Indiana University of Pennsylvania, Indiana, PA, USA, 2017. Available online: https://login.libproxy.uregina.ca:8443/login?url=https://www.proquest.com/dissertations-theses/predictive-model-illegal-dumpsites-westmoreland/docview/2007197377/se-2?accountid=13480 (accessed on 30 October 2022).
- Chabok, M.; Asakereh, A.; Bahrami, H.; Jaafarzadeh, N.O. Selection of MSW landfill site by fuzzy-AHP approach combined with GIS: Case study in Ahvaz, Iran. Environ. Monit. Assess. 2020, 192, 433. [Google Scholar] [CrossRef]
- Zhao, W.; Yang, D.; Duan, Y. Measuring Zero-Waste City Performance of a Coal Resource-Based Area in China with MCDM Approach. Math. Probl. Eng. 2022, 2022, 8479760. [Google Scholar] [CrossRef]
- Karimi, N.; Ng, K.T.W.; Richter, A. Development of a regional solid waste management framework and its application to a prairie province in central Canada. Sustain. Cities Soc. 2022, 82, 103904. [Google Scholar] [CrossRef]
- Karimi, N.; Ng, K.T.W.; Richter, A. Integrating Geographic Information System network analysis and nighttime light satellite imagery to optimize landfill regionalization on a regional level. Environ. Sci. Pollut. Res. 2022, 29, 81492–81504. [Google Scholar] [CrossRef] [PubMed]
- Mangizvo, R.V. Illegal dumping of solid waste in the alleys in the central business district of Gweru, Zimbabwe. J. Sustain. Dev. Afr. 2010, 12, 110–123. Available online: https://jsd-africa.com/Jsda/V12No2_Spring2010_B/PDF/Illegal%20Dumping%20of%20Sold%20Wastes.pdf (accessed on 30 October 2022).
- Vu, H.L.; Bolingbroke, D.; Ng, K.T.W.; Fallah, B. Assessment of waste characteristics and their impact on GIS vehicle collection route optimization using ANN waste forecasts. Waste Manag. 2019, 88, 118–130. [Google Scholar] [CrossRef]
- Vu, H.L.; Ng, K.T.W.; Fallah, B.; Richter, A.; Kabir, G. Interactions of residential waste composition and collection truck compartment design on GIS route optimization. Waste Manag. 2020, 102, 613–623. [Google Scholar] [CrossRef]
- Bolingbroke, D.; Ng, K.T.W.; Vu, H.L.; Richter, A. Quantification of solid waste management system efficiency using input-output indices. J. Mater. Cycles Waste Manag. 2021, 23, 1015–1025. [Google Scholar] [CrossRef]
- Pan, C.; Bolingbroke, D.; Ng, K.T.W.; Richter, A.; Vu, H.L. The Use of Waste Diversion Indices on the Analysis of Canadian Waste Management Models. J. Mater. Cycles Waste Manag. 2019, 21, 478–487. [Google Scholar] [CrossRef]
- Wang, Y.; Ng, K.T.W.; Asha, A. Non-hazardous Waste Generation Characteristics and Recycling Practices in Saskatchewan and Manitoba, Canada. J. Mater. Cycles Waste Manag. 2016, 18, 715–724. [Google Scholar] [CrossRef]
- Keske, C.M.; Mills, M.; Godfrey, T.; Tanguay, L.; Dicker, J. Waste management in remote rural communities across the Canadian North: Challenges and opportunities. Detritus 2018, 2, 63. [Google Scholar] [CrossRef]
- Patrick, R.J. Adapting to climate change through source water protection: Case studies from Alberta and Saskatchewan, Canada. Int. Indig. Policy J. 2018, 9. [Google Scholar] [CrossRef]
- Government of Saskatchewan. Locations of the Collection, Treatment, and Disposal of Solid Wastes Generated by the Saskatchewan Populations, Saskatchewan Solid Waste Management. 2022. Available online: https://geohub.saskatchewan.ca/datasets/saskatchewan::saskatchewan-solid-waste-management/explore?location=53.874885%2C-106.217299%2C6.31 (accessed on 1 September 2022).
- Statistics Canada. Road Network Geographic Files and Documentation. 2022. Available online: https://www150.statcan.gc.ca/n1/en/catalogue/92-500-X (accessed on 2 September 2022).
- NASA GIOVANNI. The Bridge between Data and Science. 2022. Available online: https://giovanni.gsfc.nasa.gov/giovanni/ (accessed on 25 September 2022).
- Yan, W.Y.; Mahendrarajah, P.; Shaker, A.; Faisal, K.; Luong, R.; Al-Ahmad, M. Analysis of multi-temporal landsat satellite images for monitoring land surface temperature of municipal solid waste disposal sites. Environ. Monit. Assess. 2014, 186, 8161–8173. [Google Scholar] [CrossRef] [PubMed]
- NASA. MODIS Vegetation Index Products (NDVI and EVI). 2022. Available online: https://modis.gsfc.nasa.gov/data/dataprod/mod13.php (accessed on 6 September 2022).
- Notarnicola, C.; Angiulli, M.; Giasi, C.I. Southern Italy illegal dumps detection based on spectral analysis of remotely sensed data and land-cover maps. In Remote Sensing for Environmental Monitoring, GIS Applications, and Geology III; SPIE: Bellingham, WA, USA, 2004; Volume 5239, pp. 483–493. [Google Scholar] [CrossRef]
- Mahmood, K.; Ul-Haq, Z.; Faizi, F.; Batol, S.A. A comparison of satellite-based indices for hazard assessment of MSW open dumps using spatial analysis. Waste Manag. Res. 2019, 37, 219–236. [Google Scholar] [CrossRef]
- Mahmood, K.; Ul-Haq, Z.; Faizi, F.; Tariq, S.; Naeem, M.A.; Rana, A.D. Monitoring open dumping of municipal waste in Gujranwala, Pakistan using a combination of satellite based bio-thermal indicators and GIS analysis. Ecol. Indic. 2019, 107, 105613. [Google Scholar] [CrossRef]
- Karimi, N.; Ng KT, W.; Richter, A.; Williams, J.; Ibrahim, H. Thermal heterogeneity in the proximity of municipal solid waste landfills on forest and agricultural lands. J. Environ. Manag. 2021, 287, 112320. [Google Scholar] [CrossRef]
- NASA. Ozone Monitoring Instrument (OMI) Aboard NASA’s Aura Satellite Measures Ozone from Earth’s Surface to Top of Atmosphere. 2022. Available online: https://www.earthdata.nasa.gov/learn/find-data/near-real-time/omi (accessed on 9 September 2022).
- NASA. Atmospheric Composition, Water & Energy Cycles and Climate Variability, OMI/Aura Formaldehyde (HCHO) Total Coloumn Daily L3 Wighted Mean Global 0.1-degree Grid V003. 2022. Available online: https://disc.gsfc.nasa.gov/datasets/OMHCHOd_003/summary (accessed on 6 September 2022).
- Baby, S.; Nathawat, M.S.; Al-Sarawi, M.A. Major Impacts from Anthropogenic Activities on Landscape Carrying Capacity of Kuwaiti Coast. Pol. J. Environ. Stud. 2014, 23, 7–17. [Google Scholar]
- Bartkowiak, A.; Breza-Boruta, B.; Lemanowicz, J. Assessment of the content of heavy metals and potential pathogenic microorganisms in soil under illegal dumping sites. Environ. Earth Sci. 2016, 75, 1401. [Google Scholar] [CrossRef]
- Rafique, A.; Irfan, M.; Mumtaz, M.; Qadir, A. Spatial distribution of microplastics in soil with context to human activities: A case study from the urban center. Environ. Monit. Assess. 2020, 192, 671. [Google Scholar] [CrossRef] [PubMed]
- NASA. Atmospheric Composition, Water & Energy Cycles and Climate Variability, Formaldehyde Definition and Applications. 2022. Available online: https://disc.gsfc.nasa.gov/information/glossary?keywords=formaldehyde&title=Formaldehyde (accessed on 6 September 2022).
- Román, M.O.; Wang, Z.; Sun, Q.; Kalb, V.; Miller, S.D.; Molthan, A.; Schultz, L.; Bell, J.; Stokes, E.C.; Pandey, B.; et al. NASA’s Black Marble nighttime lights product suite. Remote Sens. Environ. 2018, 210, 113–143. [Google Scholar] [CrossRef]
- NASA. NASA’s Black Marble. 2022. Available online: https://blackmarble.gsfc.nasa.gov/ (accessed on 6 September 2022).
- ESRI. Raster to Polygon, Conversion Toolbox, Geoprocessing Tools. 2022. Available online: https://pro.arcgis.com/en/pro-app/2.8/tool-reference/conversion/raster-to-polygon.htm (accessed on 6 September 2022).
- ESRI. How to Convert Polygon Features to Point Features with an ArcGIS Desktop Basic or Standard License. 2022. Available online: https://support.esri.com/en/technical-article/000018657 (accessed on 6 September 2022).
- ESRI. How Fuzzy Membership Works, Overlay Toolset Concepts, Spatial Analyst Toolbox. 2022. Available online: https://desktop.arcgis.com/en/arcmap/10.3/tools/spatial-analyst-toolbox/how-fuzzy-membership-works.htm (accessed on 7 September 2022).
- Deswal, M.; Laura, J.S. GIS based modeling using Analytic Hierarchy Process (AHP) for optimization of landfill site selection of Rohtak city, Haryana (India). J. Appl. Nat. Sci. 2018, 10, 633–642. [Google Scholar] [CrossRef]
- Isalou, A.A.; Zamani, V.; Shahmoradi, B.; Alizadeh, H. Landfill site selection using integrated fuzzy logic and analytic network process (F-ANP). Environ. Earth Sci. 2013, 68, 1745–1755. [Google Scholar] [CrossRef]
- Moeinaddini, M.; Khorasani, N.; Danehkar, A.; Darvishsefat, A.A.; Zienalyan, M. Siting MSW landfill using weighted linear combination and analytical hierarchy process (AHP) methodology in GIS environment (case study: Karaj). Waste Manag. 2010, 30, 912–920. [Google Scholar] [CrossRef] [PubMed]
- Rezaeisabzevar, Y.; Bazargan, A.; Zohourian, B. Landfill site selection using multi criteria decision making: Influential factors for comparing locations. J. Environ. Sci. 2020, 93, 170–184. [Google Scholar] [CrossRef] [PubMed]
- Matos, J.; Oštir, K.; Kranjc, J. Attractiveness of roads for illegal dumping with regard to regional differences in Slovenia. Acta Geogr. Slov. 2012, 52, 431–451. [Google Scholar] [CrossRef]
- Nazari, R.; Alfergani, H.; Haas, F.; Karimi, M.E.; Fahad, M.G.R.; Sabrin, S.; Everett, J.; Bouaynaya, N.; Peters, R.W. Application of satellite remote sensing in monitoring elevated internal temperatures of landfills. Appl. Sci. 2020, 10, 6801. [Google Scholar] [CrossRef]
- Zyrichidou, I.; Balis, D.; Koukouli, M.E.; Drosoglou, T.; Bais, A.; Gratsea, M.; Gerasopoulos, E.; Liora, N.; Poupkou, A.; Giannaros, C. Adverse results of the economic crisis: A study on the emergence of enhanced formaldehyde (HCHO) levels seen from satellites over Greek urban sites. Atmos. Res. 2019, 224, 42–51. [Google Scholar] [CrossRef]
- Manzo, C.; Mei, A.; Zampetti, E.; Bassani, C.; Paciucci, L.; Manetti, P. Top-down approach from satellite to terrestrial rover application for environmental monitoring of landfills. Sci. Total Environ. 2017, 584–585, 1333–1348. [Google Scholar] [CrossRef]
- Richter, A.; Ng, K.T.W.; Karimi, N. A data driven technique applying GIS, and remote sensing to rank locations for waste disposal site expansion. Resour. Conserv. Recycl. 2019, 149, 352–362. [Google Scholar] [CrossRef]
- Balezentis, T.; Chen, X.; Galnaityte, A.; Namiotko, V. Optimizing crop mix with respect to economic and environmental constraints: An integrated MCDM approach. Sci. Total Environ. 2020, 705, 135896. [Google Scholar] [CrossRef]
- ESRI. Majority Filter”, Spatial Analysis Toolbox. 2022. Available online: https://desktop.arcgis.com/en/arcmap/10.3/tools/spatial-analyst-toolbox/majority-filter.htm (accessed on 26 September 2022).
- ESRI. “Boundary Clean”, Spatial Analysis Toolbox. 2022. Available online: https://desktop.arcgis.com/en/arcmap/10.3/tools/spatial-analyst-toolbox/boundary-clean.htm (accessed on 26 September 2022).
- ESRI. “Smoothing a Feature (Smooth)”, Editing Existing Features. 2022. Available online: https://desktop.arcgis.com/en/arcmap/10.3/manage-data/editing-existing-features/smoothing-a-feature-smooth-.htm (accessed on 26 September 2022).
- ESRI. “Feature to Polygon”, Data Management Toolbox. 2022. Available online: https://desktop.arcgis.com/en/arcmap/latest/tools/data-management-toolbox/feature-to-polygon.htm (accessed on 26 September 2022).
- SGI. Saskatchewan Driver’s Handbook, Speed. 2022. Available online: https://www.sgi.sk.ca/handbook/-/knowledge_base/drivers/speed#:~:text=On%20most%20provincial%20highways%2C%20and,community%20boundaries%2C%20unless%20otherwise%20posted (accessed on 8 September 2022).
- ESRI. Closest Facility Analysis, Network Analysis Layers. 2022. Available online: https://desktop.arcgis.com/en/arcmap/latest/extensions/network-analyst/closest-facility.htm (accessed on 8 September 2022).
- ESRI. Service Area Analysis, Network Analysis Layers. 2022. Available online: https://desktop.arcgis.com/en/arcmap/latest/extensions/network-analyst/service-area.htm (accessed on 8 September 2022).
- Sizo, A.; Noble, B.; Bell, S. Futures analysis of urban land use and wetland change in Saskatoon, Canada: An application in strategic environmental assessment. Sustainability 2015, 7, 811–830. [Google Scholar] [CrossRef]
- Habibi, S.; Asadi, N. Causes, results and methods of controlling urban sprawl. Procedia Eng. 2011, 21, 133–141. [Google Scholar] [CrossRef]
- Ghosh, A.; Ng, K.T.W. Temporal and spatial distributions of waste facilities and solid waste management strategies in rural and urban Saskatchewan, Canada. Sustainability 2021, 13, 6887. [Google Scholar] [CrossRef]
- Richter, A.; Ng, K.T.W.; Karimi, N.; Li, R.Y.M. An iterative tessellation-based analytical approach to the design and planning of waste management regions. Comput. Environ. Urban Syst. 2021, 88, 101652. [Google Scholar] [CrossRef]
- Village of Kenaston, Residential Services Including the Both the Services’ Rates and Kenaston Dump. Available online: https://kenaston.ca/administration/residential-services/ (accessed on 7 October 2022).
- Enbridge Pipelines Inc. Waste Management Plan Provided by Dillon Consulting Group. 2020. Available online: https://registry.mvlwb.ca/Documents/S20P-003/S20P-003%20-%20Waste%20Management%20Plan%20Version%201.1%20-%20Sep%2010_20.pdf (accessed on 7 October 2022).
- Google Earth. 2022. Available online: https://earth.google.com/web/@54.49883141,-105.68389986,490.32373873a,2767214.94471392d,35y,0h,0t,0r/data=ChAaDgoIL20vMDZucnQYAiAB (accessed on 4 October 2022).
- Yang, W.; Fan, B.; Desouza, K.C. Spatial-temporal effect of household solid waste on illegal dumping. J. Clean. Prod. 2019, 227, 313–324. [Google Scholar] [CrossRef]
- Rowland, E.D.; Omonefe, F. Environmental monitory and impact assessment of solid waste dumpsite using multispectral imagery in Yenagoa, Bayelsa state, Nigeria. Int. J. Environ. Sci. Technol. 2022, 19, 1007–1024. [Google Scholar] [CrossRef]
- Nagpure, A.S. Assessment of quantity and composition of illegal dumped municipal solid waste (MSW) in Delhi. Resour. Conserv. Recycl. 2019, 141, 54–60. [Google Scholar] [CrossRef]
- Du, L.; Xu, H.; Zuo, J. Status quo of illegal dumping research: Way forward. J. Environ. Manag. 2021, 290, 112601. [Google Scholar] [CrossRef]
- Chowdhury, A.; Vu, H.L.; Ng KT, W.; Richter, A.; Bruce, N. An investigation on Ontario’s non-hazardous municipal solid waste diversion using trend analysis. Can. J. Civ. Eng. 2017, 44, 861–870. [Google Scholar] [CrossRef]
- Richter, A.; Ng, K.T.W.; Karimi, N. The role of compactness distribution on the development of regionalized waste management systems. J. Clean. Prod. 2021, 296, 126594. [Google Scholar] [CrossRef]
Publisher’s Note: MDPI stays neutral with regard to jurisdictional claims in published maps and institutional affiliations. |
© 2022 by the authors. Licensee MDPI, Basel, Switzerland. This article is an open access article distributed under the terms and conditions of the Creative Commons Attribution (CC BY) license (https://creativecommons.org/licenses/by/4.0/).