Abstract
This paper investigates the impacts of small-scale distributed energy resources (DERs) on fault currents and overcurrent protection (OCP) coordination in distribution feeders, considering the Brazilian regulatory framework. Changes in fault current levels and OCP coordination are analyzed by focusing on the relationships between DER location, output power, and OCP positioning. Simulations were conducted in Simulink/MATLAB using the IEEE 13-Node Distribution Test Feeder as a case study, considering various DER integration scenarios. The DER model adheres to the Brazilian standard NBR 16149:2013, which governs fault current injection and voltage ride-through behavior. The results indicate that DER integration can disrupt OCP coordination and significantly affect fault current levels, despite their relatively small current contributions during faults. In one scenario, OCP coordination was lost, while in others, coordination time intervals decreased. The findings show that DER location has a minimal influence on fault current changes, whereas output power plays a more critical role. Faults occurring farther from the substation cause greater current variation in installed relays, with deviations nearing ±10%. Additionally, reverse fault currents through relays are identified as a key concern for protection engineers.
1. Introduction
Inverter-based distributed energy resources (DERs) are becoming increasingly prominent in power systems [1]. In distribution feeders, most inverter-based DERs are connected on the consumer side of the meter and are typically classified as small-scale resources with rated power below 10 kW. Among renewable energy sources, solar photovoltaic (PV) systems are the most prevalent, surpassing alternatives like wind power.
A key concern regarding the integration of inverter-based DERs is their distinct behavior during abnormal events, such as faults [2]. Unlike rotating machines, the short-circuit current contribution from these DERs is relatively small and decays quickly. This output current depends on the voltage at the point of common coupling (PCC) and the internal control loops [3]. The current is limited by the thermal capability of the semiconductors and other components, with typical short-circuit contributions ranging between 1.06 and 2.0 p.u. of the DER’s rated capacity, based on empirical data and experimental tests [4,5,6,7].
Due to their ability to withstand voltage and frequency excursions—known as voltage and frequency ride-through (VRT and FRT, respectively) [8]—inverter-based DERs continue to inject current during faults, contributing to the total fault current. In a real distribution feeder, the aggregation of these small fault current contributions may alter the short-circuit levels, which can, in turn, affect the protection of the power system, particularly the coordination of overcurrent protection (OCP) devices [9,10,11]. Variations in fault and load current levels [12,13,14,15] influence OCP settings, as these parameters are used to determine coordination time intervals (CTIs) and protection sensitivity.
In Brazil, the interconnection of small-scale DERs with ratings up to 5 MW, including inverter-based types, is regulated by the National Electricity Regulatory Agency (ANEEL). These resources are classified as micro- and mini-distributed generation (MMDG) [16,17]. Most MMDG installations in Brazil are PV-based, accounting for 99% of the total installations and capacity [18]. The operational requirements for PV-based MMDG during low- and high-voltage ride-through events are governed by the Brazilian Standard (NBR) 16149:2013 [19]. This standard differs from IEEE Std 1547-2018 [8] in its specified operation modes, thresholds, and durations for VRT and FRT.
Given the relevance of NBR 16149:2013 for regulating PV-based MMDG in Brazil, this study investigates the impacts of small-scale inverter-based DERs on fault currents and overcurrent protection coordination. The IEEE 13-Node Distribution Test Feeder [20] is used as a case study, with the analysis adhering to Brazilian regulatory requirements. A range of scenarios with and without the presence of inverter-based DERs are simulated using Simulink/MATLAB software. Key factors, including the location of DERs, their output power, and operating modes, are evaluated in relation to fault current levels. The impacts on coordination are assessed based on the maximum and minimum fault currents through OCP devices. The results emphasize that OCP coordination issues may arise during faults. Additionally, the findings indicate that while the location of inverter-based DERs has a limited effect on fault current levels, the DERs’ output power plays a more significant role.
The remainder of this paper is organized as follows. Section 2 details the methodology, including the DER model, simulation scenarios, and OCP settings. Section 3 presents and discusses the simulation results, focusing on the impacts on fault currents and protection coordination. Finally, Section 4 offers the concluding remarks.
2. Methodology
2.1. Distribution Test Feeder
The IEEE 13-Node Distribution Test Feeder was selected to evaluate fault current impacts in a scenario with high penetration of small-scale inverter-based DERs. The original system [20] was modified to integrate the DERs, as shown in Figure 1. The complete technical report for the original, unmodified feeder, detailing all line, load, and transformer parameters, is available as Supplementary Material. In addition, the original loads were evenly distributed across phases to improve the power balance of the feeder. At each node with a load, a DER with active power equal to the load’s active power was connected. The Brazilian regulation mandates that the DERs’ maximum power must not surpass the maximum load of the consumer unit.
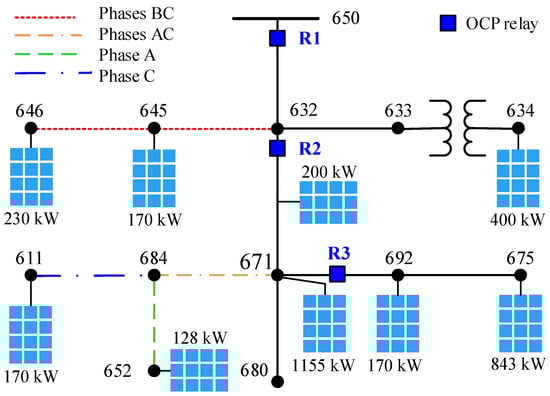
Figure 1.
IEEE 13-Node Distribution Test Feeder with DERs and OCP relays.
2.2. Inverter-Based DER Model: Brazilian Standard NBR 16149:2013
Using Simulink/MATLAB, the DERs were modeled as single-phase controlled alternating current (ac) sources [5,21,22] with VRT capability [8] and reactive current injection that follow the NBR 16149:2013 standard [19]. The model considers only VRT capability due to the fixed frequency employed in the Phasor simulation method [23]. This DER model was previously validated and applied in [13,14,24].
Figure 2 shows the main block of the proposed inverter-based DER model developed in Simulink/MATLAB. The voltage at PCC () is acquired through a PMU (Phasor Measurement Unit), which extracts the voltage magnitude (V) and angle (), for the positive sequence. For a defined output power () and pf, the current magnitude (I) and angle () are computed, which are inputs of a single-phase controlled current source.
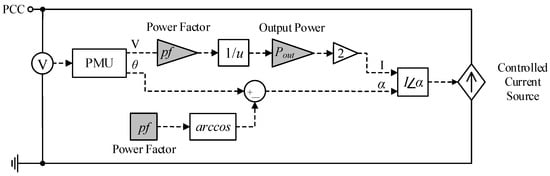
Figure 2.
Proposed simplified single-phase inverter-based DER model circuit developed in Simulink/MATLAB.
For voltage sags at between 0.5 p.u. and 1.1 p.u., the output current phasor in the positive sequence of the inverter-based DER generator () is defined based on its nominal power () and phasor. For voltage drops below 0.5 p.u., is limited at 2.0 p.u. If falls below 0.1 p.u. or exceeds 1.1 p.u., the inverter-based DER disconnects from the grid. Equation (1) presents the current magnitude behavior as a function of .
The inverter-based DER operating modes can be defined as follows. Figure 3 represents the behavior of and power factor () as functions of .
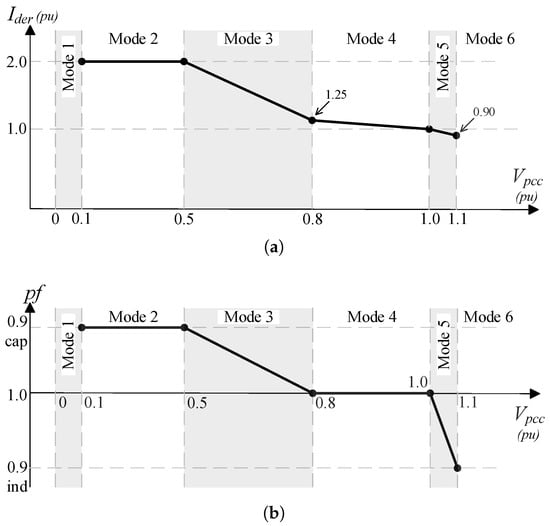
Figure 3.
Behavior of inverter-based DER model (a) current and (b) power factor as functions of voltage at the PCC.
- Mode 1 (): The DER is disconnected or ceases energy injection due to undervoltage at the PCC.
- Mode 2 (): The DER injects a 2.0 p.u. current with a power factor of 0.9 leading.
- Mode 3 (): The DER injects current following a piecewise linear curve, with the power factor varying from unity to 0.9 leading.
- Mode 4 (): The DER injects current with a unity power factor.
- Mode 5 (): The DER injects current following a piecewise linear curve, with the power factor varying from unity to 0.9 lagging.
- Mode 6 (): The DER is disconnected due to overvoltage at the PCC.
For each operation mode, based on the voltage measurement from the PMU, the inputs of the inverter-based DER model are changed, following the scheme proposed in Figure 2. The VRT connection/disconnection times were not considered in this work, since the operating time of the OCP relays was assumed to be faster.
2.3. Simulations
Simulations were conducted using Simulink/MATLAB software with the Phasor simulation type set to 60 Hz. The Phasor simulation method focuses on steady-state conditions and RMS values, which is the primary scope of this study. It is important to note that dynamic or time-domain simulations are typically preferred when analyzing inverter-based DERs. However, this study assumes that the settling time of the DERs’ controls is faster than the protection actuation and that the substation is an infinite bus, meaning the phase-locked loop accuracy is high.
Three OCP relays (Rs) were strategically placed in the IEEE 13-Node Distribution Test Feederas, as shown in Figure 1: R1 near the substation, R2 at node 632, and R3 between nodes 671 and 692. Faults were applied at two different nodes, one at a time, to analyze the fault current behavior:
- At node 675, downstream of R1, R2, and R3, and 1.37 km from the substation;
- At node 680, downstream of R1 and R2 and upstream of R3, located 1.53 km from the substation.
At each node, two types of bolted faults were applied:
- A three-line-to-ground (3LG) fault, representing a symmetrical and more severe scenario;
- A single-line-to-ground (LG) fault on each phase, representing an asymmetrical scenario with a higher rate of occurrence in power systems.
High-impedance, arcing, and evolving faults, though prevalent in distribution systems, were considered outside the scope of this work. A DER compliant with Brazilian regulations and with power output equal to the local load was placed at each of the nine load nodes (Figure 1). For each fault scenario (defined by location and type), all 512 possible combinations of the operational statues of DERs (i.e., connected or disconnected) were simulated, including the base case with no DERs present.
2.4. DER Influence Assessment
The influence of DERs was assessed by analyzing their impact on the protection system for each fault type and scenario. The evaluation focused on three effects: (1) changes in short-circuit current magnitudes through the OCP relays, (2) alterations to the coordination between OCP devices, (3) shifts in the current phasor diagrams at each relay location. To understand the drivers of these effects, the analysis correlated them with four key characteristics: the specific location of the DERs, the total number of active DERs, the aggregated power of DERs situated upstream versus downstream of each relay, and the total net power injected by the DERs into the feeder.
2.5. Overcurrent Protection
A minimum CTI of 200 ms was maintained between consecutive relays for phase and neutral protection, according to [25]. This choice provides a robust safety margin, accounting for the multifactorial nature of protection system operation, including device tolerances and breaker clearing times. Relay settings—including pickup current, current transformer ratio (CTR), time multiplier setting (TMS), and curve type (either Extremely Inverse, EI, or Very Inverse, VI)—are detailed in Table 1. These settings were established based on the analysis presented for the original test system in [20].

Table 1.
Relay settings for overcurrent protection.
The required primary current rating of the current transformer () was determined using a saturation factor () of 20, per the IEEE standard [26], as defined in Equation (2).
Here, represents the maximum short-circuit current at the CT installation point. The resulting current transformer ratio () is then calculated using Equation (3), assuming a standard rated secondary current () of 5 A.
The pickup currents for phase () and ground () protection were determined by the criteria in Equations (4) and (5), respectively.
The parameters are defined as , a demand growing factor (assumed as 1.5); , the minimum two-phase-to-ground fault current at the end of the protection zone; , a safety factor, which may vary according to relay technology (assumed as 1.1 for digital relays); , the unbalance factor (0.4, typical for distribution feeders); , the neutral current; and , the minimum LG fault current in the end of the protected zone of the relay.
Finally, the TMS was calculated for each relay using Equation (6)
where t is the relay operating time; M is the multiple of the pickup current, defined as the ratio of the measured fault current () to the pickup current referred to the primary side (); and A and P are constants that define the inverse-time curve characteristics, per [27]. It is important to note that all modeled relays were equipped with directional elements set to operate for forward faults only.
3. Results and Discussion
3.1. Three-Line-to-Ground Faults
This section analyzes the impact of DERs on fault currents during three-phase-to-ground faults. The currents measured at the OCP relays are presented in Table 2 for a fault at node 675 and in Table 3 for a fault at node 680. A negative sign in the tables indicates reverse current flow. The following metrics are used: is the reference fault current without DERs; and are the minimum and maximum recorded fault currents with DERs; and and represent the current deviations from the reference case, expressed in amperes (A) and as a percentage (%).
Table 2.
Currents through OCP relays for a 3LG fault at node 675.
Table 3.
Currents through OCP relays for a 3LG fault at node 680.
A comparison reveals that the fault at node 680 produced a slightly higher current variation at relay R1, whereas the fault at node 675 caused a greater variation at R2. The impact on R3 during the fault at node 675 was minimal, with a variation of only 3.09%.
A situation occurs during the fault at node 680: DERs on the 671–675 branch contribute to the fault, and under certain DER configurations, the current through R3 reverses direction. This is illustrated in Figure 4, which shows the case with the maximum reverse current. In this scenario, the current variations at R3 ranged from an increase of 12.49% to a decrease of 1443.22%(reverse flow). This extreme percentage is attributable to the low reference current at R3 without DERs compared to the substantial reverse current of 280.08 A with DERs.
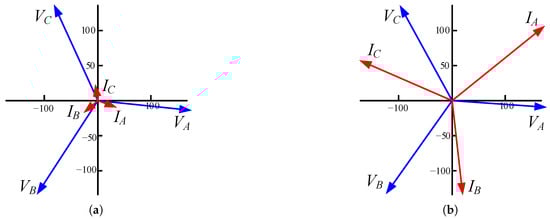
Figure 4.
Phasor diagrams of currents and voltages at R3 for a 3LG fault at node 680, showing (a) the forward-flowing current without DERs and (b) the reverse-flowing current with DERs.
The fault location also influences the DERs’ operational modes. A fault farther from the substation, such as at node 680, results in a less severe voltage sag at the DER terminals, allowing more units to remain connected and actively injecting current. This leads to more pronounced current variations at the OCPs. For example, as shown for relay R2 in Table 4 and Table 5, more DERs remain in Mode 2 (injecting current) during the fault at node 680, compared to the fault at node 675 where more DERs enter Mode 1 (disconnected).
Table 4.
DER operation modes for maximum and minimum fault currents at R2 for 3LG fault at node 675.
Table 5.
DER operation modes for maximum and minimum fault currents at R2 for 3LG fault at node 680.
To investigate the factors driving these variations, the fault current at R2 was correlated with the number and net power of connected DERs relative to the relay’s position, as shown in Figure 5. The x-axis indexes the 512 unique DER connection scenarios defined in Section 2.
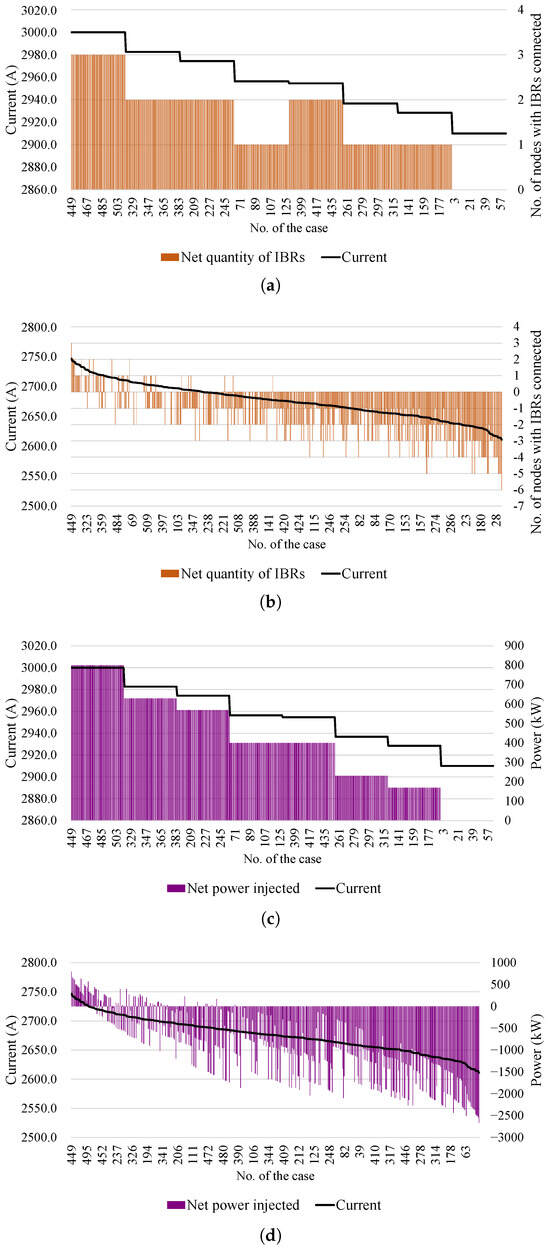
Figure 5.
Net quantity of DERs connected relative to R2 for a 3LG fault (a) at node 675 and (b) at node 680, and net power injected by the DERs (c) at node 675 and (d) at node 680.
The analysis shows that the number of connected DERs (either upstream or downstream) does not strongly correlate with the fault current magnitude. For the same number of active DERs, a wide range of fault currents was observed. This indicates that the mere quantity of connected DERs is not the primary driver; rather, the total power they inject is the key factor.
Conversely, the net injected power exhibits a strong correlation with the fault current at R2, particularly for the fault at node 675. As shown in Figure 5, a positive net power (indicating higher injection upstream of R2) consistently leads to higher fault currents, while negative net power (higher injection downstream) leads to lower fault currents. For the fault at node 680, this correlation is weaker but still observable.
For relay R3 during the fault at node 680, the relationship is more complex. As seen in Figure 6, there is no clear correlation between the fault current and either the net number or the net power of the DERs. Multiple combinations of DER status can result in the same fault current, and notably, reverse current can occur even with a net positive power injection upstream of the relay.
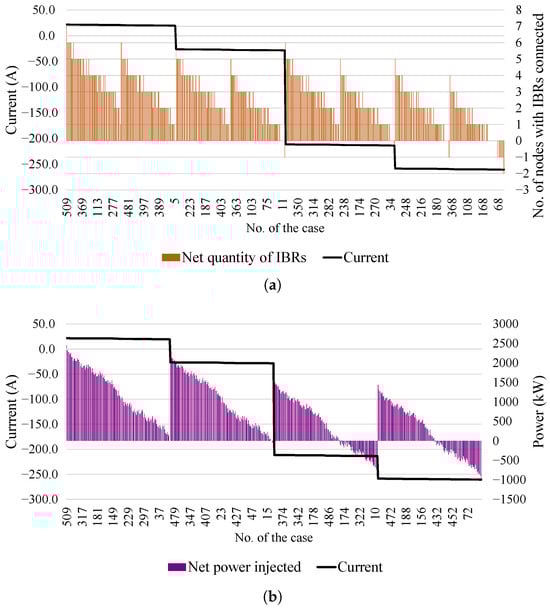
Figure 6.
(a) Net quantity of DERs connected (b) and net power injected by the DERs relative to R3 for a 3LG fault at node 680.
3.2. Single-Line-to-Ground Faults
The analysis of single-line-to-ground faults is presented in Table 6 (fault at node 675) and Table 7 (fault at node 680) for a fault in a given phase, such as Phase A.
Table 6.
RMS currents, in (A), through OCP relays for an LG fault at node 675.
Table 7.
RMS currents, in A, through OCP relays for an LG fault at node 680.
With the exception of relay R3, during the fault at node 680, the current variations for LG faults were more significant than for three-phase-to-ground (3LG) faults. While the maximum variation for a 3LG fault was 3.09%, the range for LG faults was between −10.76% and 11.00%. The variations were more pronounced for faults at node 680, which can be attributed to the greater number of DERs remaining connected and operating in modes that inject more power as a result of less severe voltage sags.
Relay R3 exhibited a reverse current behavior similar to the 3LG case during the fault at node 680, although the magnitude was smaller. The maximum reverse variation for the LG fault was −831.27%, compared to −1443.22% for the 3LG fault.
The currents in the healthy phases were also affected by the presence of DERs at both fault locations. This is an expected consequence of the magnetic coupling between phases and the continued power exchange from DERs connected to the healthy phases.
The influence of DER operating mode is detailed in Table 8 and Table 9, which provide a comparative example for a fault in Phase A. To explain the observed , the key difference lies in the behavior of the DERs at nodes 634 and 645. During the fault at node 680, their operating modes (3-4-4 and 4) result in higher net power injection compared to the fault at node 675, where the modes are 2-4-4 and 5. This occurs because Mode 2 represents a disconnected DER and Mode 5 involves reactive power absorption, both of which reduce the current contribution. A similar logic applies to the case, where the differing modes at nodes 632–671 and 671 (1-6-5 vs. 2-5-5) explain the different outcomes. This pattern of behavior was consistent across other faulted phases and relays.
Table 8.
DER operation modes for maximum and minimum fault currents through R2 for Phase A LG fault at node 675.
Table 9.
DER operation modes for maximum and minimum fault currents through R2 for Phase A LG fault at node 680.
The correlation analysis for LG faults, shown for Phase B at relay R2 in Figure 7, reinforces findings from the 3LG case. The net quantity of connected DERs shows a weak correlation with the fault current. In contrast, the net injected power demonstrates a stronger correlation, although the relationship is less deterministic than in the 3LG case, as multiple current values can be observed for the same net power level.
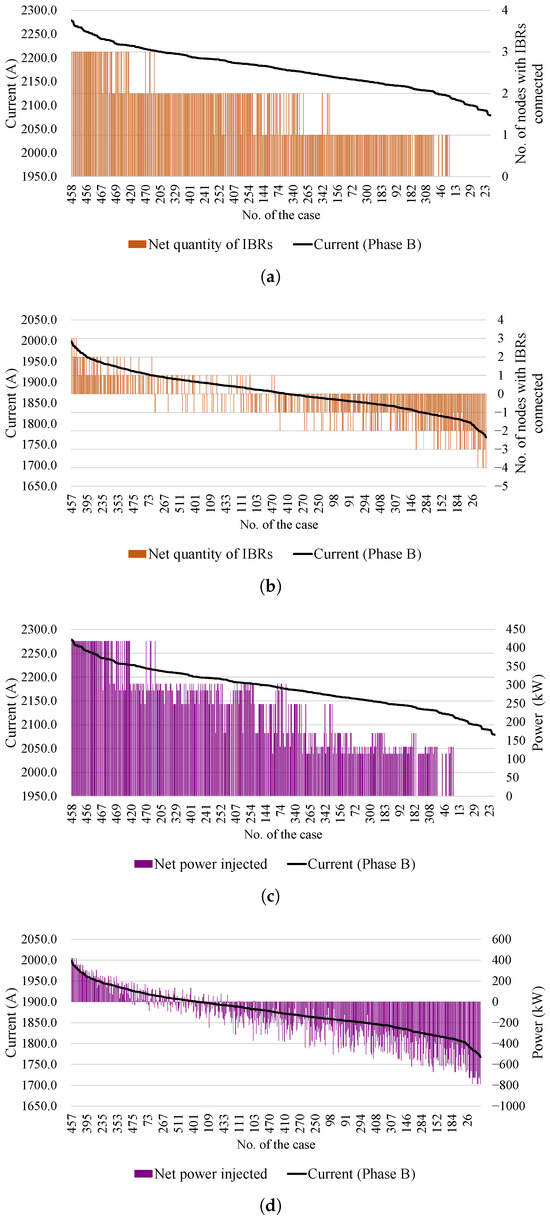
Figure 7.
Net quantity of DERs connected relative to R2 for Phase B LG faults (a) at node 675 and (b) at node 680, and net power injected by the DERs (c) at node 675 and (d) at node 680.
It is important to note that the findings of this study are based on a simplified feeder model, a choice made to isolate the fundamental impacts of DER power and location. In real-world networks with heterogeneous loading, pre-fault voltage profiles would be more complex, altering the absolute fault current magnitudes. Furthermore, while DER clustering can increase the fault contribution in a specific area, this effect is often moderated by the inherent short-circuit current limits of inverter-based resources. A detailed analysis of these complex scenarios remains a compelling direction for future research.
This study assumes an infinite bus at the substation, representing a strong grid. It is important to consider how these findings translate to weaker grids with higher source impedance, common in rural areas. In such systems, the grid’s fault current contribution is inherently limited. Consequently, the DERs’ contribution would represent a larger fraction of the total fault current, making their behavior and parameters—especially their power output—even more critical to the protection system’s response.
3.3. Impacts on Protection Coordination
This section evaluates the impact of DERs on the CTI between relays. The analysis focuses on the worst-case scenarios—the DER combinations producing maximum and minimum fault currents—for faults at nodes 675 and 680, resulting in 48 critical cases for evaluation.
For a 3LG fault at node 675, the DER combination that caused minimum current at R1 also caused maximum current at R2 and R3. This reduced the R2–R3 CTI from 283 ms to 234 ms. While this is a significant reduction, the CTI remained above the 200 ms coordination margin. Conversely, the R1–R2 CTI increased from 789 ms to 931 ms. For the 3LG fault at node 680, no CTI reduction was observed; for instance, the R1–R2 CTI increased from 725 ms to 1158 ms. The CTI between R2 and R3 was not affected because the fault current through R3 flowed in the reverse direction.
For the combination of maximum current through R2, coordination issues arose.
The analysis revealed that LG faults introduce the most critical coordination challenges. For the LG fault at node 675, several scenarios reduced the coordination margin. In the case producing minimum current at R1, the R2–R3 CTI for a Phase B fault dropped from 219 ms to 208 ms, approaching the 200 ms limit. A loss of coordination was observed for the case producing maximum current at R2. Under these conditions, the R2–R3 CTI for a Phase B fault fell from 219 ms to 199 ms, violating the minimum 200 ms threshold. This demonstrates a clear instance of miscoordination, where R3 would trip before R2. A similar CTI reduction occurred in Phase C, but the margin was not violated.
This finding highlights a critical challenge for protection engineers: even small-scale DERs, despite their low individual fault contributions, can collectively compromise the protection coordination of an entire feeder. In this study, miscoordination occurred from a fault at node 675, which is electrically distant from relay R3. A fault located closer to R3 could potentially lead to even more severe coordination issues. Of course, the specific outcome depends on the complex interplay between fault location, the resulting voltage sags, and the number and power injection of the DERs that remain connected. This conclusion is generalizable to other relay pairs and other distribution systems with high DER penetration.
For LG faults at node 680, the CTI between R1 and R2 decreased in some scenarios but always remained well above 500 ms. Miscoordination between R2 and R3 was not an issue due to the reverse current flow through R3. In such cases, the primary protection concern shifts to the significant risks of sympathetic tripping and fuse miscoordination in downstream laterals. This reverse current flow creates two distinct problems for downstream devices. First, it adds to the grid’s fault current, exposing fuses on healthy laterals to currents that can exceed their rating and cause a loss of coordination. Second, it makes non-directional relays like R3 prone to sympathetic tripping, as they cannot determine the fault’s actual location. A detailed methodology for analyzing and mitigating these risks by resizing protective devices was previously proposed by the authors in [28].
The analysis in this paper considered faults at two illustrative locations to demonstrate the impact of DERs on protection coordination. The fault location is a critical parameter, and the selection of different points could yield more severe impacts. Applying a fault at the reach limit of a protective device (i.e., just upstream of the next downstream relay) typically represents the worst-case scenario for CTI analysis. In such cases, the DER’s contribution relative to the total fault current would likely cause an even greater reduction in the CTI than what was observed in our results.
4. Conclusions
This study, conducted on the IEEE 13-Node Test Feeder, identified several key trends regarding the impact of small-scale, inverter-based DERs on distribution system protection.
The presence of DERs altered fault current magnitudes, with variations ranging from an 8.14% increase to a −10.76% decrease for LG faults. Such deviations can affect not only protection coordination but also the accuracy of current transformers. The analysis confirmed that these variations are more pronounced for relays located electrically farther from the substation. A noteworthy case was the reverse current through relay R3, where variations reached as high as −1477.71% for a 3LG fault, driven by the aggregated contribution from downstream DERs.
A primary conclusion is that the fault current magnitude does not correlate strongly with the number of connected DERs, but rather with the net active power they inject relative to the relay’s position. A clear trend was established: higher power injection from DERs upstream of a relay increases the fault current it measures, while higher injection from downstream DERs decreases it.
The phenomenon of reverse current flow, particularly through relay R3 during faults at node 680, raises significant practical concerns. This reverse flow, which intensifies as downstream DER power increases, could cause sympathetic tripping of fuses commonly used to protect lateral branches in residential and commercial areas with high PV penetration.
Regarding protection coordination, the analysis of 48 worst-case scenarios demonstrated that LG faults pose the greatest risk. CTI reduction occurred in 14 of the LG fault scenarios analyzed. Although only one case resulted in a direct loss of coordination (CTI < 200 ms), a consistent trend of CTI erosion due to downstream DERs was evident. It is important to note that these findings are conservative, as faults were not placed at locations optimized to stress the protection system. The specific impacts will ultimately depend on individual feeder characteristics and the utility’s protection philosophy.
This research demonstrates that the decentralized operation of small-scale DERs can significantly degrade the performance of overcurrent protection schemes, even when their individual fault contributions are small. The key drivers are the collective net power and relative location of DERs, which can lead to reduced coordination margins and potentially hazardous reverse current flows. Establishing a precise predictive model for these impacts remains a complex but critical area for future work.
Supplementary Materials
The following supporting information can be downloaded at: https://www.mdpi.com/article/10.3390/electricity6030054/s1, and https://cmte.ieee.org/pes-testfeeders/resources/ (accessed on 14 September 2025).
Author Contributions
Conceptualization, M.C.V. and O.E.B.; methodology, M.C.V. and M.A.M.; software, M.C.V. and M.A.M.; validation, M.C.V.; formal analysis, M.C.V. and M.A.M.; investigation, M.C.V. and M.A.M.; data curation, M.C.V.; writing—original draft preparation, M.C.V. and M.A.M.; writing—review and editing, M.C.V., M.A.M., O.E.B., and Y.Y.; supervision, O.E.B. and Y.Y. All authors have read and agreed to the published version of the manuscript.
Funding
This research was supported in part by the Coordenação de Aperfeiçoamento de Pessoal de Nível Superior—Brazil (CAPES)—Finance Code 001. The APC was funded in part by the Federal Institute of Espírito Santo.
Institutional Review Board Statement
Not applicable.
Informed Consent Statement
Not applicable.
Data Availability Statement
The raw data supporting the conclusions of this article will be made available by the authors on request.
Acknowledgments
M. C. Vargas would like to thank the Federal Institute of Espírito Santo for their financial and institutional support.
Conflicts of Interest
The authors declare no conflicts of interest.
Abbreviations
The following abbreviations are used in this manuscript:
| DER | Distributed Energy Resource |
| OCP | Overcurrent Protection |
| PV | Photovoltaic |
| PCC | Point of Common Coupling |
| VRT | Voltage Ride-Through |
| FRT | Frequency Ride-Through |
| CTI | Coordination Time Interval |
| MMDG | Micro- and Mini-Distributed Generation |
| NBR | Brazilian Standard |
| PMU | Phasor Measurement Unit |
| 3LG | Three-Line-to-Ground |
| LG | Line-to-Ground |
| CTR | Current Transformer Ratio |
| TMS | Time Multiplier Settings |
| EI | Extremely Inverse |
| VI | Very Inverse |
| SF | Saturation Factor |
References
- Lew, D.; Asano, M.; Boemer, J.; Ching, C.; Focken, U.; Hydzik, R.; Lange, M.; Motley, A. The Power of Small: The Effects of Distributed Energy Resources on System Reliability. IEEE Power Energy Mag. 2017, 15, 50–60. [Google Scholar] [CrossRef]
- Blaabjerg, F.; Yang, Y.; Yang, D.; Wang, X. Distributed Power-Generation Systems and Protection. Proc. IEEE 2017, 105, 1311–1331. [Google Scholar] [CrossRef]
- IEEE Power & Energy Society. PES-TR67.r1—Impact of IEEE 1547 Standard on Smart Inverters and the Applications in Power Systems. Technical Report, IEEE PES. 2020. Available online: https://resourcecenter.ieee-pes.org/publications/technical-reports/pes_tp_tr67r1_itslc_1547_082820 (accessed on 14 September 2025).
- Dugan, R.C.; McDermott, T.E. Distributed generation. IEEE Ind. Appl. Mag. 2002, 8, 19–25. [Google Scholar] [CrossRef]
- Baran, M.; El-Markaby, I. Fault Analysis on Distribution Feeders With Distributed Generators. IEEE Trans. Power Syst. 2005, 20, 1757–1764. [Google Scholar] [CrossRef]
- Keller, J.; Kroposki, B. Understanding Fault Characteristics of Inverter-Based Distributed Energy Resources; Technical report (NREL/TP-550-46698); National Renewable Energy Laboratory (NREL): Golden, CO, USA, 2010. [Google Scholar] [CrossRef]
- Meskin, M.; Domijan, A.; Grinberg, I. Impact of distributed generation on the protection systems of distribution networks: Analysis and remedies—Review paper. IET Gener. Transm. Distrib. 2020, 14, 5944–5960. [Google Scholar] [CrossRef]
- IEEE Std 1547-2018; IEEE Standard for Interconnection and Interoperability of Distributed Energy Resources with Associated Electric Power Systems Interfaces. Institute of Electrical and Electronic Engineers (IEEE): New York, NY, USA, 2018. [CrossRef]
- Walling, R.A.; Saint, R.; Dugan, R.C.; Burke, J.; Kojovic, L.A. Summary of Distributed Resources Impact on Power Delivery Systems. IEEE Trans. Power Deliv. 2008, 23, 1636–1644. [Google Scholar] [CrossRef]
- Fani, B.; Bisheh, H.; Sadeghkhani, I. Protection coordination scheme for distribution networks with high penetration of photovoltaic generators. IET Gener. Transm. Distrib. 2018, 12, 1802–1814. [Google Scholar] [CrossRef]
- Mahindara, V.R.; Rodriguez, D.F.C.; Pujiantara, M.; Priyadi, A.; Purnomo, M.H.; Muljadi, E. Practical Challenges of Inverse and Definite-Time Overcurrent Protection Coordination in Modern Industrial and Commercial Power Distribution System. IEEE Trans. Ind. Appl. 2021, 57, 187–197. [Google Scholar] [CrossRef]
- Vargas, M.C.; Batista, O.E.; Yang, Y. Estimation Method of Short-Circuit Current Contribution of Inverter-Based Resources for Symmetrical Faults. Energies 2023, 16, 3130. [Google Scholar] [CrossRef]
- Vargas, M.C.; Mendes, M.A.; Batista, O.E. Fault Current Analysis on Distribution Feeders with High Integration of Small Scale PV Generation. In Proceedings of the 2019 IEEE Power & Energy Society General Meeting (PESGM), Atlanta, GA, USA, 4–8 August 2019; pp. 1–5. [Google Scholar] [CrossRef]
- Mendes, M.A.; Vargas, M.C.; Simonetti, D.S.L.; Batista, O.E. Load Currents Behavior in Distribution Feeders Dominated by Photovoltaic Distributed Generation. Electr. Power Syst. Res. 2021, 201, 107532. [Google Scholar] [CrossRef]
- Li, Y.; Feng, B.; Wang, B.; Sun, S. Joint planning of distributed generations and energy storage in active distribution networks: A Bi-Level programming approach. Energy 2022, 245, 123226. [Google Scholar] [CrossRef]
- Electricity Regulatory Agency (ANEEL). Normative Resolution No. 1000, December 7th, 2021. 2021. Available online: https://www2.aneel.gov.br/cedoc/ren20211000.pdf (accessed on 14 September 2025).
- Brazil. Law No. 14300, January 6th, 2022. Estabilish the Legal Framework for Micro- and Mini-Distributed Generation, Electrical Energy Compensation System (SCEE), Social Program of Renewable Energy (PERS). 2021. Available online: https://www.planalto.gov.br/ccivil_03/_ato2019-2022/2022/lei/l14300.htm (accessed on 14 September 2025).
- Electricity Regulatory Agency (ANEEL). Distributed Generation: Panel. Available online: https://app.powerbi.com/view?r=eyJrIjoiY2VmMmUwN2QtYWFiOS00ZDE3LWI3NDMtZDk0NGI4MGU2NTkxIiwidCI6IjQwZDZmOWI4LWVjYTctNDZhMi05MmQ0LWVhNGU5YzAxNzBlMSIsImMiOjR9 (accessed on 14 September 2025).
- NBR 16149:2013; Photovoltaic (PV) Systems—Characteristics of the Utility Interface. Brazilian Association of Technical Standards (ABNT): Rio de Janeiro, Brazil, 2013.
- Kersting, W. Radial distribution test feeders. In Proceedings of the 2001 IEEE Power Engineering Society Winter Meeting. Conference Proceedings, Columbus, OH, USA, 28 January–1 February 2001; Volume 2, pp. 908–912. [Google Scholar] [CrossRef]
- Baran, M.E.; Hooshyar, H.; Shen, Z.; Huang, A. Accommodating High PV Penetration on Distribution Feeders. IEEE Trans. Smart Grid 2012, 3, 1039–1046. [Google Scholar] [CrossRef]
- Hooshyar, H.; Baran, M.E. Fault Analysis on Distribution Feeders With High Penetration of PV Systems. IEEE Trans. Power Syst. 2013, 28, 2890–2896. [Google Scholar] [CrossRef]
- Queiroz, L.G.O.; Batista, O.E. Single-phase PV generator model for distribution feeders considering voltage ride through conditions. Electr. Power Syst. Res. 2023, 223, 109612. [Google Scholar] [CrossRef]
- Matos, S.; Vargas, M.; Fracalossi, L.; Encarnação, L.; Batista, O. Protection philosophy for distribution grids with high penetration of distributed generation. Electr. Power Syst. Res. 2021, 196, 107203. [Google Scholar] [CrossRef]
- IEEE Std 242-2001; IEEE Recommended Practice for Protection and Coordination of Industrial and Commercial Power Systems. Institute of Electrical and Electronic Engineers (IEEE): New York, NY, USA, 2001.
- C37.110-2007; IEEE Guide for the Application of Current Transformers Used for Protective Relaying Purposes. Institute of Electrical and Electronic Engineers (IEEE): New York, NY, USA, 2007.
- IEC 60255-151:2009; Measuring Relays and Protection Equipment—Part 151: Functional Requirements for Over/Under Current Protection. International Electrotechnical Commission (IEC): Geneva, Switzerland, 2009.
- Vargas, M.C.; Batista, O.E.; Yang, Y. Fuse sizing using penetration level indicators in IBR-dominated distribution feeders. Electr. Power Syst. Res. 2026, 250, 112133. [Google Scholar] [CrossRef]
Disclaimer/Publisher’s Note: The statements, opinions and data contained in all publications are solely those of the individual author(s) and contributor(s) and not of MDPI and/or the editor(s). MDPI and/or the editor(s) disclaim responsibility for any injury to people or property resulting from any ideas, methods, instructions or products referred to in the content. |
© 2025 by the authors. Licensee MDPI, Basel, Switzerland. This article is an open access article distributed under the terms and conditions of the Creative Commons Attribution (CC BY) license (https://creativecommons.org/licenses/by/4.0/).