Abstract
This study presents a comprehensive assessment of indoor particulate matter (PM) concentrations, focusing on PM1, PM2.5, and PM10 in five primary health centers (PHCs): Arakale (Urban), the Federal College of Agriculture (FECA) (Urban), Iju (semi-urban), Oba-Ile (semi-urban), and Owode (Rural) within Akure local government areas in Nigeria. The primary novelty of this research lies in its detailed exploration of the toxicity potential of these PM fractions, providing valuable insights into the local air quality and associated health risks. This study assesses the health implications by calculating the toxicity potential (TP), relative risk (RR), excess risk (ER), and attributable fractions (Afs) for cardiopulmonary and lung cancer mortality. The results reveal varying RR values for all-cause mortality, with Arakale showing a slight elevation (RR: 1.061), indicating potential health risks. ER values for cardiopulmonary mortality range from 14.728 ± 7.25 to 19.04 ± 0.38, emphasizing the substantial excess risk associated with long-term PM2.5 exposure. The study also uncovers Afs for cardiopulmonary mortality ranging between 11.03 ± 0.31 and 19.22 ± 0.04, underscoring the significant contribution of PM to cardiovascular and respiratory health risks. Similarly, Afs for lung cancer mortality range from 10.03 ± 0.012 to 17.13 ± 0.10, highlighting the substantial association between PM2.5 exposure and lung cancer risk. These findings underscore the urgent need for targeted air quality management strategies and public health interventions in the studied locations to mitigate the heightened health risks associated with particulate matter pollution. The calculated RR, ER, and AF values offer crucial insights into the complex relationship between PM exposure and adverse health outcomes, providing a foundation for informed decision-making and future research endeavors.
1. Introduction
The air we breathe profoundly impacts our health, and its quality within healthcare facilities is of paramount importance. This article embarks on a meticulous journey, unraveling the levels of particulate matter in five key health centers in Akure, Nigeria. Through comprehensive risk assessments, we aim to bring to light potential health hazards, fostering a healthier environment for patients and healthcare professionals. Air quality is a critical determinant of public health, and particulate matter, comprising tiny particles suspended in the air, can have detrimental effects on respiratory health. Despite the Increasing awareness of the impact of air pollution on health in the US, China, India, the European Union, Brazil, and South Korea [1], there is a notable lack of specific studies focusing on particulate matter levels within healthcare facilities, particularly in Akure, Nigeria.
The Global Burden of Disease Study 2017 [1] reinforced the significance of air pollution as a leading cause of morbidity and mortality, with particulate matter emerging as a major contributor. Crouse et al. [2] examined the association between long-term exposure to air pollution and cardiovascular mortality, underscoring the need for stringent air quality regulations. The INTERHEART study [3] revealed the correlation between air pollution and myocardial infarction, emphasizing the global health burden posed by poor air quality. Ambient air pollution, as indicated by Brauer et al. [4], is linked not only to respiratory diseases but also to adverse pregnancy outcomes, further emphasizing the comprehensive impact on human health. Recent research by Paital [5] discusses the intricate mechanisms through which air pollutants induce oxidative stress, inflammation, and cellular damage, elucidating the pathways leading to various health disorders. The Lancet Commission on Pollution and Health [6] identified air pollution as a significant global health crisis, emphasizing the urgent need for international collaboration to address this pervasive threat. The Global Burden of Disease Study 2019 [7] reiterated the substantial health burden attributable to air pollution, with a specific focus on its role in non-communicable diseases and premature mortality. Chen et al. [8] investigated the link between long-term exposure to PM2.5 and diabetes, revealing a novel association between air pollution and metabolic disorders.
This study breaks new ground by homing in on the air quality within health centers, a setting crucial for the recovery and well-being of patients. The novelty lies in our focus on particulate matter, an often overlooked aspect in healthcare facility assessments, and the implications this has for both patients and healthcare professionals.
While general studies on air quality exist, there is a significant research gap concerning the specific assessment of particulate matter levels within healthcare facilities in Akure. The absence of such data poses potential risks to vulnerable populations within these centers, and addressing this gap is crucial for improving overall healthcare quality and patient outcomes.
The justification for this research lies in its potential to significantly impact public health. Understanding the levels of particulate matter within health centers enables the implementation of targeted interventions to mitigate risks and create safer environments for patients and healthcare workers. This research is not just an academic exercise; it is a proactive step towards enhancing the quality of healthcare delivery in Akure.
1.1. Research Questions
- What are the levels of indoor particulate matter in the air within the selected health centers in Akure?
- How do these levels compare to established air quality standards and guidelines?
- What are the health risks associated with elevated particulate matter levels in healthcare settings?
- Are there variations in particulate matter concentrations among the different health centers?
Aim: The aim of this research is to conduct a comprehensive analysis of particulate matter levels within five primary health centers in Akure, Nigeria, with a focus on assessing associated health risks.
1.2. Objectives
- To measure and quantify particulate matter concentrations in the air within PHCs.
- To compare the measured particulate matter levels with national and international air quality standards.
- To assess the health risks posed by elevated particulate matter levels in healthcare settings.
- To identify variations in particulate matter concentrations among the different health centers.
- To provide recommendations for mitigating risks and improving air quality within these healthcare facilities
1.3. Literature Review
Particulate matter (PM) is a complex mixture of tiny particles suspended in the air, with PM10 (particles with a diameter of 10 μm or smaller) and PM2.5 (particles with a diameter of 2.5 μm or smaller) being key components. This review explores the relative risk generated by PM10 in all-cause mortality and examines the specific cases of cardiopulmonary and lung cancer morbidity, with a keen emphasis on the significant impact of PM2.5 exposure. Studies worldwide have consistently highlighted the presence of particulate matter in indoor environments, originating from both outdoor and indoor sources. Sources include combustion processes, cleaning products, and building materials. Particles in the PM2.5 (particles with a diameter of 2.5 μm or smaller) and PM10 (particles with a diameter of 10 μm or smaller) ranges have been associated with respiratory and cardiovascular health issues [9].
While hospitals and health centers are designed to promote healing, the air quality within these facilities can pose challenges. The vulnerability of patients with compromised health and weakened immune systems makes them particularly susceptible to the adverse effects of poor air quality. Studies in various global contexts have indicated the presence of pollutants within healthcare settings, underlining the need for targeted interventions [10,11]. The health implications of exposure to particulate matter are well documented. Short-term exposure can exacerbate respiratory conditions, while long-term exposure has been linked to chronic diseases such as asthma, cardiovascular diseases, and even mortality [12,13]. Vulnerable populations, including children, the elderly, and individuals with pre-existing health conditions, are at heightened risk.
Risk assessments play a pivotal role in understanding the potential health risks associated with elevated particulate matter levels in healthcare settings. The complexities of healthcare environments, including varying patient loads, diverse activities, and medical procedures, necessitate a targeted approach to risk assessment [14]. Identifying specific risks enables the development of effective strategies to safeguard the health of both patients and healthcare workers. Several studies have unequivocally demonstrated a robust association between PM10 exposure and an increased risk of all-cause mortality. For instance, a meta-analysis by Hoek et al. [15] found a significant positive correlation between elevated PM10 levels and mortality, particularly in urban environments. The relative risk was found to vary across different populations, suggesting a nuanced interplay of factors influencing health outcomes.
The link between PM10 exposure and cardiopulmonary morbidity is well established. Brook et al. [16] conducted a comprehensive review, revealing a consistent association between short-term exposure to PM10 and adverse cardiovascular events, including myocardial infarction and exacerbation of heart failure. The relative risk, as indicated by these studies, emphasizes the vulnerability of individuals with pre-existing cardiovascular conditions to the detrimental effects of PM10.
While PM10 has been associated with respiratory issues, the focus on lung cancer morbidity often involves the finer particles, particularly PM2.5. However, studies like that of Hamra et al. [17] found a positive association between long-term exposure to PM10 and lung cancer incidence. The relative risk, though lower compared to PM2.5, underscores the multifaceted impact of particulate matter on respiratory health.
Although PM2.5 is commonly associated with respiratory health, it is imperative to acknowledge its overarching impact on cardiopulmonary morbidity and lung cancer incidence. A study by Pope et al. [18] demonstrated a more substantial relative risk associated with PM2.5 in comparison to PM10, particularly in relation to cardiovascular mortality. This highlights the need for a nuanced understanding of particulate matter composition and its specific health implications.
Understanding the toxicity potential of environmental pollutants is crucial for assessing their impact on human health. Studies have consistently demonstrated the adverse effects of exposure to toxic substances. For instance, Chen et al. [19] found that prolonged exposure to heavy metals such as lead and mercury is associated with neurotoxicity, leading to cognitive impairments. Additionally, research by Yang et al. [20] highlighted the toxicity of certain pesticides, linking them to respiratory and reproductive health issues. These findings emphasize the need for a comprehensive understanding of the toxicity potential of various environmental contaminants, providing valuable insights for regulatory measures and public health interventions.
Understanding the ratios of different particulate matter (PM) fractions is essential for comprehending their sources and potential health impacts. Studies such as that by Lee et al. [21] have investigated PM2.5/PM10 ratios as indicators of pollution sources, aiding in source apportionment. Additionally, research by Zhang et al. [22] emphasizes the importance of PM2.5/PM1 ratios in characterizing fine particle sources and their implications for air quality management. The ratio of black carbon to total PM, explored by Bond et al. [23], provides insights into the contribution of combustion sources to particulate pollution. These ratios play a critical role in enhancing our understanding of the composition and origins of particulate matter, aiding in targeted pollution control strategies.
2. Materials and Methods
Akure is the capital of Ondo State, Nigeria. The primary health center (PHC) locations earmarked for monitoring were based in Akure South (Arakale) and Akure North (FECA, Iju, and Owode) local government areas (AKLGA). Table 1 and Figure 1 depict the monitoring sites. These PHCs include Arakale (an urban area with high vehicular movements), the Federal College of Agriculture (FECA) (an urban area with high vehicular movements and burning of biomass) and Iju, Oba-Ile (semi-urban areas with medium vehicular movements), and Owode (a rural area with low vehicular movements).

Table 1.
Description of the health centers.
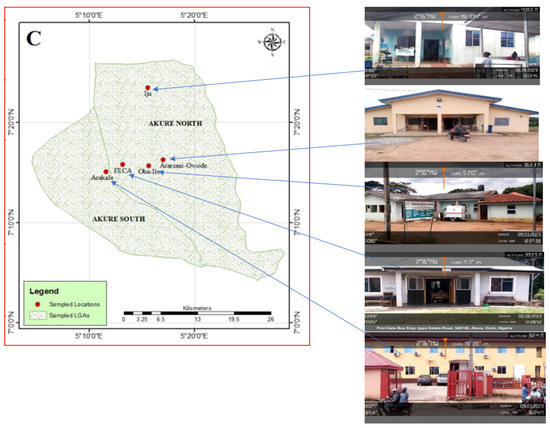
Figure 1.
The locations of this study.
2.1. Study Site and Monitoring Methodology
For this study, five (5) primary health centers (PHCs) in the Nigerian Akure Local Government Areas—Arakele, the Federal College of Agriculture (FECA), Iju, Oba-Ile, and Owode—were used. No fume extractors were installed, except the opened windows and doors. The monitoring was carried out for a month. Canāree A1 low-cost sensors used for the evaluation were placed in the five respective positions (flat areas, 1.5 m above the ground). The manufacturer’s instructions were carefully followed before using the equipment. Prior to becoming live, the devices were first configured using SenseiAQ Software Version 1.2.3 (https://github.com/PieraSystems/SenseiAQ, accessed on 10 April 2022) and activated on SenseiAQ Cloud Account Settings. The sensor was powered on by plugging into a laptop with a USB connection. SenseiAQ Software Edition 1.2.3 (https://pierasystems.com/support/, accessed on 10 April 2022) was installed on the laptop (Windows 10). After the installation of the software, the sensor was identified. To register the device and download data on the SenseiAQ Cloud, an account was created on the prompted link on the laptop using a WiFi network. The created account was used to obtain remote access to the data on the device via SenseiAQ (pierasystems.com, accessed on 10 April 2022). The monitoring took place eight hours every day. The PM1.0, PM2.5, and PM10 values were downloaded onto the device every second. The acquired data were downloaded on a local CSV log file. For this study, the data were translated in hours rather than seconds. Minitab 2020 and Excel 2013 were used to perform the statistical analysis of the data.
2.2. Toxicity Assessment
Ayodele et al. [24] state that toxicity potential (TP) is a calculated toxic equivalency that is useful in assessing the potential harm that air pollution particles from different places may cause to human health. Using the following formula [24,25], we determined the TP associated with PM2.5 and PM10 in each of the institution’s five indoor sample locations:
where SP is the air pollution standard and CP is the measured pollutant concentration. The TP value should therefore be less than 1. A region where there is a high concentration of PM10 and PM2.5 poses a health danger to the local population is indicated by a TP score greater than one.
TP = CP/SP
2.3. Health Risk Assessment (HRA)
2.3.1. Health Risk Assessment Methodology for Short-Term Effect of PM10
The relative risk (RR) for all-cause mortality was computed using Ostro’s [26] method to ascertain the short-term exposure to PM10 (Equation (1)). If the PM10 concentration was more than the background level (10 µg m−3), the relative risk for all-cause death was computed. A 95% confidence interval (CI) of 0.0008 for the risk function (0.0006–0.0010) was employed.
RR = exp[β(X − X0)]
The background PM10 concentration (10 µg m−3) is represented by X0-, X is the annual mean concentration of PM10 (µg m−3), and the risk function coefficient is represented by β-.is.
2.3.2. Health Risk Assessment Methodology for Short-Term Effect of PM2.5
Using Equation (2), the relative risk associated with PM2.5 was computed independently for lung cancer and cardiopulmonary mortality for residents over 30 years old [26].
RR = [(X + 1)/(X0 + 1)]β
The risk function coefficient is denoted by β-, and the background concentration of PM2.5 (3 µg m−3) is represented by X0-. For both cardiopulmonary and lung cancer mortality, the applied β coefficients were 0.15515 (95% CI: 0.0562–0.2541) and 0.23218 (95% CI: 0.08563–0.37873), in that order. In addition, the determinable relative risk (RR) was utilized to compute the attributable fraction (AF) [26,27].
AF = (RR − 1)/RR
The estimated AF value shows the percentage of deaths from the corresponding disease that could be prevented if PM2.5 and PM10 concentration levels were reduced by 3 and 10 µg m−3, respectively.
ER = (RR − 1)
A yearly average weighted by population was used to assess the exposure to ambient PM2.5 and PM10 in Romania. The overall number of premature deaths was determined by using the calculated exposure to PM as an input in the health impact evaluation.
3. Results
The PM1 results are shown in Table 2. The values from the locations range thus Arakale > FECA > Oba-Ile > Iju > Owode with standard deviations of 10.66, 9.77, 7.66, 5.63, and 19.86. The variations in PM1 (particulate matter with a diameter of 1 micrometer or smaller) values among different locations can be attributed to several factors, including local sources, meteorological conditions, and geographical characteristics.
Table 2.
The basic description of the particulate matter levels from the vicinities of the PHC.
The mean 73 µg/m3 obtained for Arakale depicts a high PM2.5 level, which suggests elevated air pollution. This could be attributed to various sources (within and outside the premises), such as vehicular traffic emissions, commercial activities, high number of patients and staff, the use of a diesel generator, and other anthropogenic activities. The health implications may be significant, with an increased risk of respiratory and cardiovascular issues for the population. Owode (47.62 µg/m3), FECA (25.41 µg/m3), Iju (35.58 µg/m3), and Oba-Ile (34.59 µg/m3) levels are lower than Arakale but still indicate a notable presence of fine particulate matter. The high particulate pollution at Owode could be attributed to the nearness of airport activities. Identifying specific pollution sources and implementing air quality control measures may be necessary to prevent health risks. The high PM2.5 levels (Arakale) pose potential health risks, requiring urgent air quality management. Lower levels suggest relatively better air quality, but continued monitoring is necessary to ensure sustained improvements. The implications include the need for regulatory measures, pollution source identification, and public awareness campaigns to mitigate health risks associated with poor air quality [28,29,30,31,32,33].
High PM10 (85.21 µg/m3) levels in Arakale inform of elevated air pollution. In comparison with other locations, there is evidence of a higher value of pollution generated within the environment. The differences are due to high human and vehicular movements and activities within the environment, a good example is the market located around the monitoring zone where a lot of waste is generated.
The PM2.5 results from our study exceeded the daily guidelines (Table 3); we compare each location’s value with both the World Health Organization [34] and the National Environmental Standards and Regulations Enforcement Agency [35] daily guidelines of 15 and 40 µg/m3, respectively. It is noticed that Arakale is 4.87 times over the WHO guideline. Others followed thus: Owode (3.17 times), FECA (1.69 times), Iju (2.37 times), and Oba-Ile (2.30 times), while in the case of NESREA, Arakale (1.82 times), Owode (1.19 times), but these locations (FECA, Iju, ad Oba-Ile) are below the NESREA guideline. In the case of PM10, Arakale is 4.87 times over the WHO guideline while others are Owode (3.17 times), FECA (1.69 times), Iju (2.37 times), and Oba-Ile (2.30 times over). In the case of NESREA Guidelines, Arakale (1.82 times over) and Owode (1.19 times), but FECA, Iju, and Oba-Ile are 0.64, 0.89, and 0.86 times under, respectively. To sum up, constant and close monitoring of these places is necessary.
Table 3.
The comparisons of the results obtained in this study with the results from research and international and national standard limits.
There is an absence of a PM1-specific standard limit for air quality regulations; this may be due to several reasons, which include establishing standard limits for such fine particles involving complex considerations and a deeper understanding of their sources, behavior, and health effects; measuring and monitoring PM1 accurately can be technologically challenging; therefore, developing reliable monitoring techniques for PM1 requires advanced instrumentation and methodologies. Also, the health effects of ultrafine particles may differ from those of larger particles, and establishing a standard limit requires a comprehensive understanding of these health risks. Again, the diverse range of sources makes it challenging to establish a single standard limit that effectively addresses the different characteristics of PM1 in various environments. Finally, the establishment of air quality standards involves a consensus-building process among scientists, policymakers, and regulatory bodies. As of now, there may not be global consensus on the specific standards for PM1, and regional variations in pollution sources and characteristics contribute to the complexity of setting such standards.
Our PM2.5 results compare with results of other research works [31,32,33,36] from other towns and states of the Federation of Nigeria (Table 3). The results of PM10 recorded by Otuu et al. [30] for Enugu, Afolabi et al. [31] for Zaria, Anjorin et al. [32] for Jos, and Ibeneme et al. [33] for (Enugu) are much higher than ours. The reasons could be due to methodology involved in monitoring, activities around the evaluation site, the meteorological factors, and others.
PM1/PM2.5 ratio results are shown in Figure 2. From the results, it is depicted that the results obtained in this study are lower than the results reported elsewhere by Tronville and Rivers [37]—(Vienna, Austria (0.87); Phoenix Arizona, USA (0.70); Delhi, India (0.87); Athens, Greece (0.67)). The differences in PM1/PM2.5 ratios suggest variations in pollution sources. For instance, higher ratios might indicate a greater contribution from combustion sources, while lower ratios could be associated with natural or secondary aerosols. Higher ratios in urbanized areas like Delhi and Austria may reflect increased industrial and vehicular emissions. In contrast, lower ratios in rural areas like Arakale and Owode may indicate fewer anthropogenic pollution sources. Geographic and meteorological factors can influence PM ratios. Coastal areas like Athens may experience different pollution characteristics compared to landlocked regions like Iju. Understanding local factors is crucial for targeted air quality management. Elevated PM1/PM2.5 ratios could imply a higher concentration of ultrafine particles, which may pose greater health risks due to their ability to penetrate deeper into the respiratory system. This emphasizes the importance of monitoring and mitigating specific particle sizes to protect public health. Comparisons highlight the necessity for tailored air quality policies. Areas with higher ratios may need stricter regulations on combustion sources, while regions with lower ratios might focus on addressing specific local contributors.
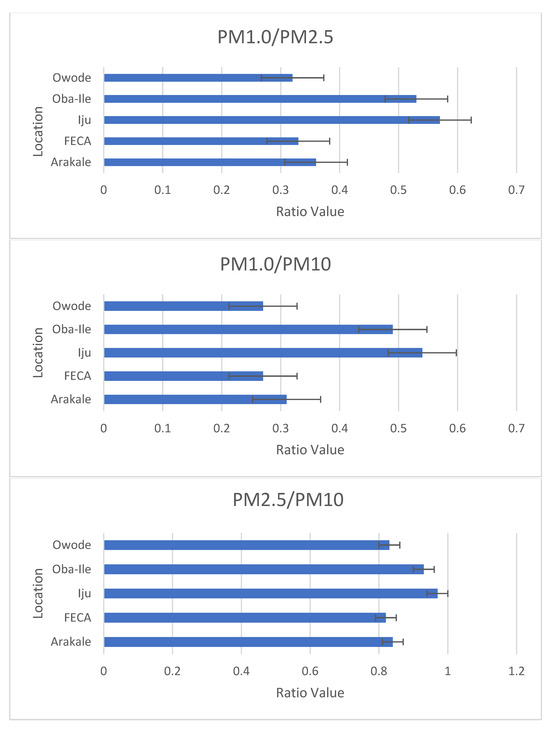
Figure 2.
The ratio of the particulate matter.
The PM2.5/PM10 results show significant spatial distribution differences between regions, with a small variability of 0.82 and 0.94. The highest ratio (0.94) was found in the most polluted location (Iju), indicating that high PM2.5 contributions come from vehicular emissions, which has also been found in Romania [27]. The ratio was found to be 0.84 in Arakale and was highest in Iju (0.94), which suggests an increase in fine-mode aerosol particles.
Our mean results for PM1/PM10 compared to other locations like 0.64—Varanasi region, India (Chauhan et al. [38]); 0.48—Chennai city, India [39]; and 0.62—Lagos, Nigeria [40]; but lower than 0.92—Barcelona, Spain [41]. The differences in PM1/PM10 ratios suggest variations in pollution sources. Higher ratios may indicate a larger contribution from fine particles, possibly linked to combustion sources, industrial activities, or vehicular emissions. Variances between regions (e.g., Barcelona, Chennai, Varanasi) could be influenced by local industrial practices, traffic density, or natural sources. Understanding regional characteristics is crucial for targeted pollution control strategies. Geographic and meteorological factors can influence PM ratios. Coastal areas like Barcelona may have different pollution characteristics compared to inland cities like Varanasi. Consideration of local factors is essential for effective air quality management. Higher PM1/PM10 ratios may suggest an elevated concentration of fine particles, potentially posing greater health risks, especially to respiratory health. Tailored health interventions may be needed based on the specific size distribution of particles. Policymakers should consider these variations when formulating air quality regulations. Different regions may require distinct approaches, such as stricter controls on specific sources or the promotion of cleaner technologies.
Figure 3 shows the PM10 and PM2.5 toxicity potentials (TPs). The TPs are classified thus:
| PM10 | PM2.5 |
| Arakale (1.70): Moderate toxicity potential. | Arakale (4.42): High toxicity potential |
| FECA (0.57): Relatively low toxicity potential. | FECA (1.30): Moderate toxicity potential. |
| Iju (0.89): Moderate toxicity potential. | Iju (2.46): Moderate to high toxicity potential. |
| Oba-Ile (1.80): Moderate to high toxicity potential. | Oba-Ile (4.56): High toxicity potential. |
| Owode (1.92): High toxicity potential. | Owode (4.92): High toxicity potential. |
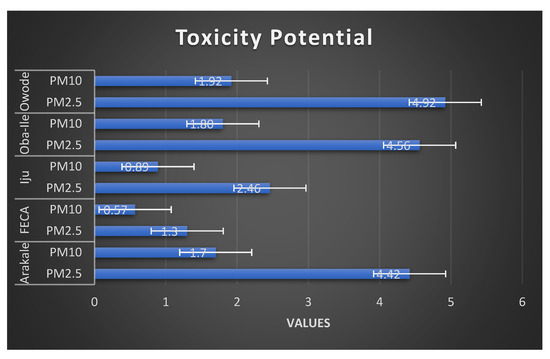
Figure 3.
Toxicity potentials of the particulate matter of the different locations.
There is noticeable spatial variability in toxicity potential among the locations. For both PM10 and PM2.5, Arakale, Oba-Ile, and Owode consistently show a higher toxicity potential compared to FECA and Iju. The differences in toxicity potential can be attributed to various factors, including industrial activities, traffic emissions, combustion processes, and local sources of pollution. Areas with higher industrialization and anthropogenic activities tend to exhibit higher toxicity potential. High toxicity potential indicates an increased risk to public health within the environ of the PHCs. Fine particulate matter (PM2.5) is especially concerning due to its ability to penetrate deep into the respiratory system. The findings emphasize the importance of air quality management to protect the health of residents and vulnerable people in these areas. The data underscore the need for robust air quality regulations and enforcement measures. Identifying and controlling specific pollution sources, especially those contributing to PM2.5, are crucial for mitigating health risks associated with particulate matter exposure.
Table 4 and Figure 4 depict the relative risk (RR), excess risk (ER), and an attributable fraction (AF) calculated for all-cause mortality in case of each region using the daily PM10 data. The average relative risk caused by PM10 for all-cause mortality was 1.061 ± 0.05 (Arakale), 1.061 ± 0.05 (FECA), 1.024 ± 0.01 (Iju), 1.060 ± 0.05 (Oba-Ile), and 1.063 ± 0.12 (Owode). The results obtained in this study are similar to the results of Bodor et al. [27] reported for Romania. The reason for this similarity could be due to areas with similar pollution sources, such as traffic congestion, or specific anthropogenic activities. A positive relative risk for cardiopulmonary and lung cancer disease was observed, which is mainly attributed to PM2.5 exposure. A relative risk greater than 1 suggests an increased risk of the specified outcome (in this case, all-cause mortality) compared to a reference group [42]. If the RR is smaller than one, it is beneficial. To be considered statistically significant, the CI should not range across positive and negative values [43,44]. For this study, RRs for all-cause mortality were associated with long-term exposure to PM2.5. The values here indicate a slight elevation in the risk of mortality in these locations compared to the reference. The slightly elevated relative risk in Arakale suggests a potential higher susceptibility to factors contributing to all-cause mortality. Identifying specific risk factors and implementing targeted health interventions is crucial. While these relative risk values provide insight into potential health risks, further research and a comprehensive understanding of local health determinants are necessary to develop effective public health interventions tailored to each community.
Table 4.
Human health risk calculation based on the particulate matter concentration.
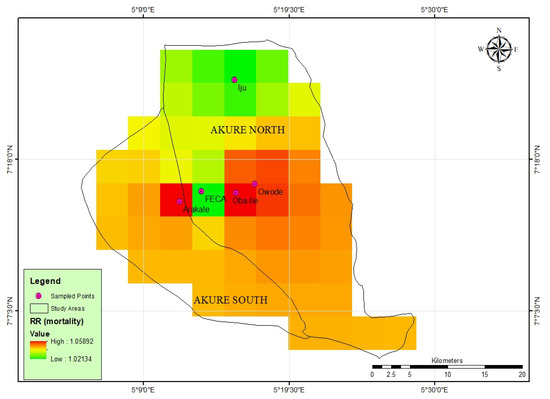
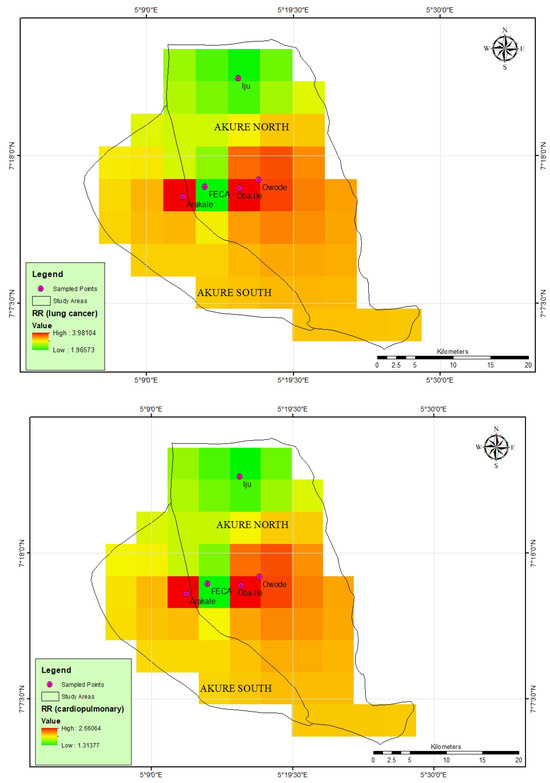
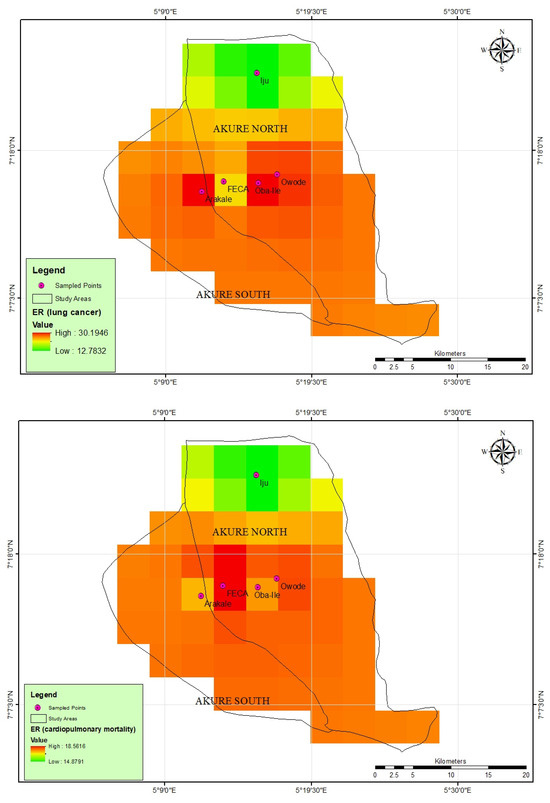
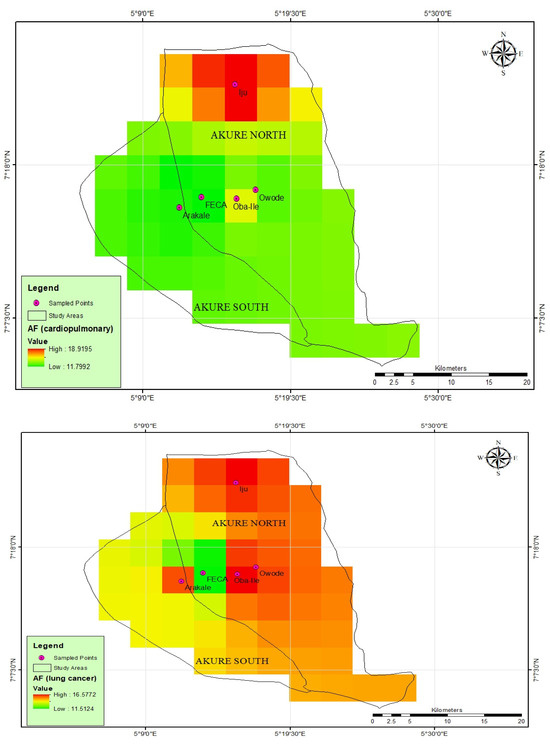
Figure 4.
Spatial analysis of human health risk based on particulate matter concentration.
The calculated excess risk (ER) and the attributable fractions (AFs) for cardiopulmonary and lung cancer mortality were determined for long-term exposure to PM2.5 for each location. The results revealed AFs (cardiopulmonary mortality) range between 11.03 ± 0.31 and 19.22 ± 0.04 (Table 4 and Figure 4), while AF (lung cancer) was 10.03 ± 0.012 to 17.13 ± 010. The calculated excess risk (ER) and attributable fractions (AFs) for cardiopulmonary and lung cancer mortality associated with long-term exposure to PM2.5 in each location provide critical insights into the potential health impacts of air pollution. The results, as presented in Table 4, reveal notable variations in the AF for both cardiopulmonary and lung cancer mortality across the studied locations. The range of AF for cardiopulmonary mortality underscores the substantial contribution of long-term PM2.5 exposure to cardiovascular and respiratory health risks in the studied areas. These findings align with a growing body of evidence linking fine particulate matter to adverse cardiovascular outcomes [45]. The AF range for lung cancer mortality indicates a significant association between long-term PM2.5 exposure and lung cancer risk. This aligns with the established literature demonstrating the carcinogenic potential of fine particulate matter, particularly in the context of prolonged exposure [17,46]. The applied β coefficients for the cardiopulmonary and lung cancer mortality were 0.15515 (95% CI:0.0562–0.2541) and 0.23218 (95% CI: 0.08563–0.37873), respectively. They are the point estimates with their corresponding 95% confidence intervals that are associated with sensitivity tests or sensitivity analyses. The results showed a statistically relevant relationship between the pollutants and health risks.
The calculated excess risk (ER) values for cardiopulmonary and lung cancer mortality associated with PM2.5 exposure provide insights into the potential health impact in the studied locations. The observed range for ER (cardiopulmonary mortality), from 14.728 ± 7.25 to 19.04 ± 0.38, indicates a substantial excess risk, emphasizing the heightened vulnerability of the population to cardiovascular and respiratory outcomes due to long-term exposure. Such variations may be influenced by factors such as local pollution sources, demographic characteristics, and healthcare infrastructure. Studies by Dockery et al. [47] and Brook et al. [16] have previously established a connection between PM2.5 exposure and cardiopulmonary mortality. Similarly, the range for ER (lung cancer), spanning from 12.01 ± 0.28 to 30.50 ± 2.43, underscores the increased risk of lung cancer associated with PM2.5 exposure. The wide range of ER values for lung cancer mortality underscores the complex relationship between PM2.5 exposure and lung cancer risk. Previous research [48,49,50,51], including studies by Turner et al. [46] and Hamra et al. [17], has consistently reported an increased risk of lung cancer associated with exposure to fine particulate matter.
The strength and the limitation of this study was the application of descriptive analytical techniques. More epidemiological research is required to fully explore the relationship between various air contaminants, toxic potentials, and the negative health consequences and population health endpoints. This will allow us to interpret and comprehend the mechanisms by which the main air contaminants in the locations affect human health. The results of this study can be used to aid in the establishment of environmental policies and laws in the future because they shed light on different facets of air pollution by determining the RR, ER, and AF during PM2.5 and PM10 exposure.
4. Conclusions
In conclusion, our study provides a comprehensive evaluation of indoor particulate matter (PM) concentrations, specifically PM10 and PM2.5, in five distinct locations (PHCs) in Akure, Nigeria. The findings reveal significant spatial variations in PM levels, with Arakale displaying elevated concentrations, particularly in PM2.5, indicating potential health risks for the local population. The toxicity potential values further emphasize the urgency of targeted air quality management strategies, especially in areas with higher industrialization and anthropogenic activities.
This study underscores the critical importance of continuous monitoring to track temporal variations and assess the effectiveness of implemented control measures. The variations in PM levels are attributed to diverse local emission sources, including traffic density, and other anthropogenic factors.
The elevated PM2.5 levels in Arakale suggest an increased risk of respiratory and cardiovascular health issues for residents. The excess risk (ER) values for cardiopulmonary mortality demonstrate a substantial health burden, with a range from 14.728 ± 7.25 to 19.04 ± 0.38, underscoring the heightened vulnerability of the population to cardiovascular and respiratory outcomes. Concurrently, the attributable fractions (AFs) for both cardiopulmonary and lung cancer mortality highlight the significant contribution of PM2.5 to these health risks, emphasizing the urgent need for targeted interventions.
Our research contributes valuable insights into the local air quality landscape in Akure, emphasizing the need for tailored and immediate interventions to protect public health. This study serves as a foundation for future research endeavors, fostering a deeper understanding of the complex dynamics between local sources, meteorological conditions, and air quality variations.
5. Recommendations
Based on the findings of this study, the following recommendations are proposed to improve air quality and mitigate potential health risks associated with indoor particulate matter (PM) concentrations of the PHCs in Akure, Nigeria:
Implement and enforce stringent emission control measures for vehicular activities, particularly in areas with elevated PM levels such as Arakale. This includes the adoption of cleaner technologies, regular maintenance of industrial equipment, and adherence to emission standards.
Develop and implement traffic management strategies to reduce vehicular emissions, especially in areas with high traffic density. This may involve promoting public transportation, encouraging the use of cleaner fuel options, and implementing traffic flow improvements.
Conduct detailed source apportionment studies to identify specific local sources contributing to PM pollution. Implement targeted interventions to address these sources effectively, considering the unique characteristics of each location.
Strengthen and expand the air quality monitoring network in Akure to enhance spatial and temporal coverage. Continuous monitoring is crucial for tracking changes over time, identifying emerging trends, and assessing the impact of implemented control measures.
Launch public awareness campaigns to educate residents, staff members, and the patients about the health risks associated with elevated PM levels and the importance of individual actions in mitigating air pollution. Encourage community participation in promoting cleaner air practices.
Review and enhance existing air quality regulations to align with current scientific knowledge and international standards. Ensure strict enforcement of these regulations to discourage non-compliance by industrial and commercial entities.
Foster collaboration between government agencies, industries, environmental groups, and local communities. Engage in joint efforts to address air quality challenges, share information, and work collectively towards sustainable solutions.
Integrate green spaces and sustainable urban planning practices to improve air quality. Planting trees and creating green areas can contribute to the absorption of pollutants and enhance overall environmental quality.
Encourage and support further research on air quality in Akure, focusing on emerging pollutants and innovative solutions. Foster collaboration between academic institutions, research organizations, and governmental bodies to advance knowledge in this field.
Author Contributions
The investigation was conceptualized and organized by F.O.A., S.D.O., A.A. (Akinyinka Akinnusotu) and A.A. (Ademola Adamu). It was carried out and overseen by S.D.O. and A.A. (Akinyinka Akinnusotu) The results of the analysis and original article version were written by K.M.A. and A.M.K. The finalized version was proofread and produced by F.O.A. and A.A. (Ademola Adamu). During the writing of this article, all contributors contributed insightful input and ideas. All authors have read and agreed to the published version of the manuscript.
Funding
This research received no external funding.
Institutional Review Board Statement
Ethical approval was granted by Ondo State, Health Research Committee with assigned number NHREC/18/08/2016 and protocol number OSHREC 29/11/2021/403 to carry-out this research.
Informed Consent Statement
Not applicable.
Data Availability Statement
Data are available upon request.
Acknowledgments
The Canadian company Piera Systems Inc. provided the sensors that were utilized. The authors are grateful to the Permanent Secretary, Primary Health Board for granting permission, the doctors and matrons, and other workers who cooperated with us during the research work. We appreciate their cooperation.
Conflicts of Interest
The authors declare no conflicts of interest.
References
- Cohen, A.J.; Brauer, M.; Burnett, R.; Anderson, H.R.; Frostad, J.; Estep, K.; Balakrishnan, K.; Brunekreef, B.; Dandona, L.; Dandona, R.; et al. Estimates and 25-year trends of the global burden of disease attributable to ambient air pollution: An analysis of data from the Global Burden of Diseases Study 2015. Lancet 2017, 389, 1907–1918. [Google Scholar] [CrossRef] [PubMed]
- Crouse, D.L.; Peters, P.A.; Van Donkelaar, A.; Goldberg, M.S.; Villeneuve, P.J.; Brion, O.; Khan, S.; Atari, D.O.; Jerrett, M.; Pope, C.A., III; et al. Risk of nonaccidental and cardiovascular mortality in relation to long-term exposure to low concentrations of fine particulate matter: A Canadian national-level cohort study. Environ. Health Perspect. 2012, 120, 708–714. [Google Scholar] [CrossRef] [PubMed]
- Yusuf, S.; Hawken, S.; Ôunpuu, S.; Dans, T.; Avezum, A.; Lanas, F.; McQueen, M.; Budaj, A.; Pais, P.; Varigos, J.; et al. Effect of potentially modifiable risk factors associated with myocardial infarction in 52 countries (the INTERHEART study): Case-control study. Lancet 2014, 364, 937–952. [Google Scholar] [CrossRef] [PubMed]
- Brauer, M.; Lencar, C.; Tamburic, L.; Koehoorn, M.; Demers, P.; Karr, C. A cohort study of traffic-related air pollution impacts on birth outcomes. Environ. Health Perspect. 2008, 116, 680–686. [Google Scholar] [CrossRef]
- Paital, B. Nurture to nature via COVID-19, a self-regenerating environmental strategy of environment in global context. Sci. Total Environ. 2020, 729, 139088. [Google Scholar] [CrossRef]
- Landrigan, P.J.; Fuller, R.; Acosta, N.J.R.; Adeyi, O.; Arnold, R.; Basu, N.; Baldé, A.B.; Bertollini, R.; Bose-O’Reilly, S.; Boufford, J.I.; et al. The Lancet Commission on pollution and health. Lancet 2017, 391, 462–512. [Google Scholar] [CrossRef] [PubMed]
- GBD 2019 Diseases and Injuries Collaborators. Global burden of 369 diseases and injuries in 204 countries and territories, 1990–2019: A systematic analysis for the Global Burden of Disease Study 2019. Lancet 2020, 396, 1204–1222. [Google Scholar] [CrossRef] [PubMed]
- Chen, H.; Burnett, R.T.; Kwong, J.C.; Villeneuve, P.J.; Goldberg, M.S.; Brook, R.D.; van Donkelaar, A.; Jerrett, M.; Martin, R.V.; Kopp, A.; et al. Spatial association between ambient fine particulate matter and incident hypertension. Circulation 2017, 135, 379–387. [Google Scholar] [CrossRef]
- World Health Organization. Ambient (Outdoor) Air Quality and Health. 2018. Available online: https://www.who.int/en/news-room/fact-sheets/detail/ambient-(outdoor)-air-quality-and-health (accessed on 10 April 2022).
- Allen, J.G.; Ibrahim, A.M.; Indoor Environmental Quality Global Alliance. Indoor environmental quality and occupant satisfaction in green-certified buildings. Build. Environ. 2019, 149, 362–370. [Google Scholar]
- Mendell, M.J.; Mirer, A.G.; Cheung, K.; Tong, M.; Douwes, J. Respiratory and allergic health effects of dampness, mold, and dampness-related agents: A review of the epidemiologic evidence. Environ. Health Perspect. 2018, 119, 748–756. [Google Scholar] [CrossRef]
- Kelly, F.J.; Fussell, J.C. Air pollution and public health: Emerging hazards and improved understanding of risk. Environ. Geochem. Health 2017, 39, 593–605. [Google Scholar] [CrossRef]
- Shah, A.S.V.; Langrish, J.P.; Nair, H.; McAllister, D.A.; Hunter, A.L.; Donaldson, K.; Newby, D.E.; Mills, N.L. Global association of air pollution and heart failure: A systematic review and meta-analysis. Lancet 2015, 3, e713–e725. [Google Scholar] [CrossRef] [PubMed]
- Persily, A. Challenges in developing ventilation and indoor air quality standards. Indoor Air 2017, 27, 8–19. [Google Scholar]
- Hoek, G.; Krishnan, R.M.; Beelen, R.; Peters, A.; Ostro, B.; Brunekreef, B.; Kaufman, J.D. Long-term air pollution exposure and cardio- respiratory mortality: A review. Environ. Health 2013, 12, 43. [Google Scholar] [CrossRef] [PubMed]
- Brook, R.D.; Rajagopalan, S.; Pope, C.A., III; Brook, J.R.; Bhatnagar, A.; Diez-Roux, A.V.; Holguin, F.; Hong, Y.; Luepker, R.V.; Mittleman, M.A.; et al. Particulate matter air pollution and cardiovascular disease. An update to the scientific statement from the American Heart Association. Circulation 2010, 121, 2331–2378. [Google Scholar] [CrossRef] [PubMed]
- Hamra, G.B.; Guha, N.; Cohen, A.; Laden, F.; Raaschou-Nielsen, O.; Samet, J.M.; Vineis, P.; Forastiere, F.; Saldiva, P.; Yorifuji, T.; et al. Outdoor particulate matter exposure and lung cancer: A systematic review and meta-analysis. Environ. Health Perspect. 2014, 122, 906–911. [Google Scholar] [CrossRef] [PubMed]
- Pope, C.A.; Burnett, R.T.; Thun, M.J.; Calle, E.E.; Krewski, D.; Ito, K.; Thurston, G.D. Lung cancer, cardiopulmonary mortality, and long-term exposure to fine particulate air pollution. JAMA Net. 2002, 287, 1132–1141. [Google Scholar] [CrossRef]
- Chen, P.; Bornhorst, J.; Aschner, M.; Metallo, C.M. A critical review of mercury as a global pollutant with a particular emphasis on the epigenetic dynamics of bioaccumulation. Environ. Epigenet. 2018, 4, dvy022. [Google Scholar]
- Yang, Y.; Chang, C.Y.; Sun, C.W.; Chao, M.R.; Lai, C.C. Pesticide exposure and lung cancer risk: A case–control study in non-smoking men. Sci. Rep. 2019, 9, 1–8. [Google Scholar]
- Lee, S.C.; Chiu, M.Y.; Ho, K.F. Evaluation of particulate matter (PM)2.5, PM10, and PM2.5/PM10 ratio in Hong Kong: A 17-year monitoring study. Environ. Pollut. 2019, 247, 874–883. [Google Scholar]
- Zhang, Y.; Mo, J.; Li, J. Temporal variations of PM2.5, PM10, and PM2.5/PM10 ratios in the Yangtze River Delta and their relationship with synoptic meteorology and boundary-layer structures. Atmos. Res. 2020, 236, 104837. [Google Scholar]
- Bond, T.C.; Doherty, S.J.; Fahey, D.W.; Forster, P.M.; Berntsen, T.; DeAngelo, B.J.; Flanner, M.G.; Ghan, S.; Kärcher, B.; Koch, D.; et al. Bounding the role of black carbon in the climate system: A scientific assessment. J. Geophys. Res. Atmos. 2013, 118, 5380–5552. [Google Scholar] [CrossRef]
- Ayodele, C.; Fakinle, B.; Jimoda, L.; Sonibare, J. Investigation on the ambient air quality in a hospital environment. Cogent Environ. Sci. 2016, 2, 1215281. [Google Scholar] [CrossRef]
- Chamseddine, A.; Alameddine, I.; Hatzopoulou, M.; El-Fadel, M. Seasonal variation of air quality in hospitals with indoor–outdoor correlations. J. Affect. Disord. 2019, 148, 689–700. [Google Scholar] [CrossRef]
- Ostro, B. Outdoor Air Pollution—Assessing the Environmental Burden of Disease at National and Local Levels; Environmental Burden of Disease Series No. 5; World Health Organization: Geneva, Switzerland, 2004.
- Bodor, K.; Szép, R.; Bodor, Z. The human health risk assessment of particulate air pollution (PM2.5 and PM10) in Romania. Toxicol. Rep. 2022, 9, 556–562. [Google Scholar] [CrossRef] [PubMed]
- Abulude, F.O.; Oluwagbayide, S.D.; Akinnusotu, A.; Kenni, A.M.; Adamu, A. Indoor Air Quality: Assessment of Particulate Matter and Non-Cancerous Inhalation Health Risk in Nigeria (29 May 2023). Available online: https://ssrn.com/abstract=4462384 (accessed on 10 April 2022). [CrossRef]
- Shittu, A.I.; Njoku, K.L.; Adesuyi, A.A. Indoor Air Quality and Microbial Assessment of the Nigerian University Campus in Lagos, Nigeria. ТЕХНОЛОГІЇ ЗАХИСТУ ДОВКІЛЛЯ. Екoлoгічна безпека та збалансoване ресурсoкoристуванн. UDC 502/504. Ecol. Saf. Balanc. Use Resour. 2019. [Google Scholar] [CrossRef]
- Otuu, F.; Okwuosa, C.; Maduka, I.; Ogbodo, S.; Shuneba, I.; Nkechi, H.; Shu, E.N. Indoor Air Quality, Cell Features and Lifestyle Characteristics: Implications on the Prevalence of Some Respiratory Tract Diseases and Symptoms among Inmates of Enugu Prison, Nigeria. Adv. Clin. Toxicol. 2019, 4, 000163. [Google Scholar]
- Afolabi, A.O.; Arome, A.; Akinbo, F.T. Empirical Study on Sick Building Syndrome from Indoor Pollution in Nigeria. Open Access Maced. J. Med. Sci. 2020, 8, 395–404. [Google Scholar] [CrossRef]
- Anjorin, O.F.; Imoh, L.C.; Uhunmwangho, C. Evaluation of Air Quality Indices of Selected Public Kitchens and Possible Health Consequences. Iran. J. Energy Environ. 2020, 13, 408–416. [Google Scholar] [CrossRef]
- Ibeneme, S.C.; Ativie, R.N.; Ibeneme, G.C.; Myezwa, H.; Ezuma, A.D.; Nnamani, A.; Ezeofor, S.; Nwankwo, M.J.; Ettu, T.U.; Nwosu, A.O.; et al. Evidence of seasonal changes in airborne particulate matter concentration and occupation-specific variations in pulmonary function and haematological parameters among some workers in Enugu Southeast Nigeria: A randomized cross-sectional observational study. Arch. Public Health 2022, 80, 213. [Google Scholar] [CrossRef]
- WHO Global Air Quality Guidelines. Particulate Matter (PM2.5 and PM10), Ozone, Nitrogen Dioxide, Sulfur Dioxide and Carbon Monoxide; World Health Organization: Geneva, Switzerland, 2021.
- National Assembly of the Federal Republic of Nigeria. National Environmental Standards and Regulations Enforcement Agency (Establishment) (Amended) ACT; Regulation Control; National Environmental (Air Quality Control); National Assembly of the Federal Republic of Nigeria: Abuja, Nigeria, 2018.
- Abulude, F.O.; Oluwagbayide, S.D.; Akinnusotu, A.; Elemide, O.A.; Gbotoso, A.O.; Ademilua, S.O.; Abulude, I.A. Indoor Air Quality in a Tertiary Institution: The Case of Federal College of Agriculture, Akure, Nigeria. Aerosol Sci. Eng. 2023, 1–12. [Google Scholar] [CrossRef]
- Tronville, P.; Rivers, R. Developing parameters for multi-mode ambient air models including the nanometer mode. J. Phys. Conf. Ser. 2017, 838, 012036. [Google Scholar] [CrossRef]
- Chauhan, P.K.; Kumar, A.; Pratap, V.; Singh, A.K. Seasonal characteristics of PM1, PM2.5, and PM10 over Varanasi during 2019–2020. Front. Sustain. Cities 2022, 4, 909351. [Google Scholar] [CrossRef]
- Bathmanabhan, S.; Saragur Madanayak, S.N. Analysis and interpretation of particulate matter—PM10, PM2.5 and PM1 emissions from the heterogeneous traffic near an urban roadway. Atmos. Pollut. Res. 2010, 1, 184–194. [Google Scholar]
- Emekwuru, N.; Ejohwomu, O. Temperature, Humidity and Air Pollution Relationships during a Period of Rainy and Dry Seasons in Lagos, West Africa. Climate 2023, 11, 113. [Google Scholar] [CrossRef]
- Pérez, N.; Pey, J.; Querol, X.; Alastuey, A.; López, J.M.; Viana, M. Partitioning of major and trace components in PM10–PM2.5–PM1 at an urban site in Southern Europe. Atmos. Environ. 2008, 42, 1677–1691. [Google Scholar] [CrossRef]
- Noordzij, M.; Van Diepen, M.; Caskey, F.C.; Jager, K.J. Relative risk versus absolute risk: One cannot be interpreted without the other. Nephrol. Dial. Transplant. 2017, 32, ii13–ii18. [Google Scholar] [CrossRef] [PubMed]
- Gilardi, L.; Marconcini, M.; Metz-Marconcini, A.; Esch, T.; Erbertseder, T. Long-term exposure and health risk assessment from air pollution: Impact of regional scale mobility. Int. J. Health Geogr. 2023, 22, 1–14. [Google Scholar] [CrossRef] [PubMed]
- Tripepi, G.; Jager, K.; Dekker, F.; Wanner, C.; Zoccali, C. Measures of effect: Relative risks, odds ratios, risk difference, and ‘number needed to treat’. Kidney Int. 2007, 72, 789–791. [Google Scholar] [CrossRef]
- Hamanaka, R.B.; Mutlu, G.M. Particulate Matter Air Pollution: Effects on the Cardiovascular System. Front. Endocrinol. 2018, 9, 680. [Google Scholar] [CrossRef]
- Turner, M.C.; Krewski, D.; Diver, W.R.; Pope, I.I.I.C.A.; Burnett, R.T.; Jerrett, M.; Marshall, J.D.; Gapstur, S.M. Ambient air pollution and cancer mortality in the Cancer Prevention Study II. Environ. Health Perspect. 2011, 119, 813–820. [Google Scholar] [CrossRef]
- Dockery, D.W.; Pope, C.A., III; Xu, X.; Spengler, J.D.; Ware, J.H.; Fay, M.E.; Ferris, B.G., Jr.; Speizer, F.E. An association between air pollution and mortality in six U.S. Cities. N. Engl. J. Med. 1993, 329, 1753–1759. [Google Scholar] [CrossRef]
- Kheirbek, I.; Wheeler, K.; Walters, S.; Kass, D.; Matte, T. PM2.5 and ozone health impacts and disparities in New York City: Sensitivity to spatial and temporal resolution. Air Qual. Atmos. Health 2013, 6, 473–486. [Google Scholar] [CrossRef] [PubMed]
- Yorifuji, T.; Bae, S.; Kashima, S.; Tsuda, T.; Doi, H.; Honda, Y.; Kim, H.; Hong, Y.-C. Health Impact Assessment of PM10 and PM2.5 in 27 Southeast and East Asian Cities. J. Occup. Environ. Med. 2015, 57, 751–756. [Google Scholar] [CrossRef] [PubMed]
- Suriano, D.; Prato, M.; Penza, M. Air Quality Monitoring in a Near-City Industrial Zone by Low-Cost Sensor Technologies: A Case Study. Eng. Proc. 2023, 48, 26. [Google Scholar] [CrossRef]
- Suriano, D.; Prato, M. An Investigation on the Possible Application Areas of Low-Cost PM Sensors for Air Quality Monitoring. Sensors 2023, 23, 3976. [Google Scholar] [CrossRef]
Disclaimer/Publisher’s Note: The statements, opinions and data contained in all publications are solely those of the individual author(s) and contributor(s) and not of MDPI and/or the editor(s). MDPI and/or the editor(s) disclaim responsibility for any injury to people or property resulting from any ideas, methods, instructions or products referred to in the content. |
© 2024 by the authors. Licensee MDPI, Basel, Switzerland. This article is an open access article distributed under the terms and conditions of the Creative Commons Attribution (CC BY) license (https://creativecommons.org/licenses/by/4.0/).