Proceeding Paper

Data Envelopment Analysis of Rural Water Access Efficiency: A Multi-Dimensional Assessment Framework for Resource Optimization †

1
Faculté d’Économie et de Gestion de Kenitra, Université Ibn Tofail-Kenitra, Kenitra 14000, Morocco
2
LMII—Faculty of Sciences and Technology, Hassan 1st University, Settat P.O. Box 577, Morocco
*
Author to whom correspondence should be addressed.
Presented at the 1st International Conference on Smart Management in Industrial and Logistics Engineering (SMILE 2025), Casablanca, Morocco, 16–19 April 2025.
Eng. Proc. 2025, 97(1), 27; https://doi.org/10.3390/engproc2025097027
Published: 13 June 2025

Abstract

:
This paper introduces a comprehensive framework for evaluating rural water access efficiency using Data Envelopment Analysis (DEA). Despite significant investment in water infrastructure, disparities in access efficiency across regions remain a critical challenge for developing countries. We apply an input-oriented Banker-Charnes-Cooper (BCC) DEA model with bootstrap bias correction to assess the relative efficiency of 16 regions in rural Morocco. Our approach incorporates multiple inputs (infrastructure investment, operational costs) and outputs (access coverage, water quality) to evaluate each region’s efficiency in converting resources into water access outcomes. The results reveal substantial efficiency variations (mean bias-corrected efficiency: 0.906, SD: 0.071) with seven regions identified as globally efficient under variable returns to scale. We introduce a novel Water Access-Efficiency Matrix that enables targeted policy interventions across four strategic quadrants. The analysis demonstrates that inefficient regions have an average input reduction potential of 16.4%, with six regions requiring improvements exceeding 10%. Furthermore, the identification of returns to scale characteristics (5 IRS, 6 CRS, 5 DRS) provides crucial guidance for scaling strategies. This framework offers policymakers a robust, multi-dimensional decision support tool for optimizing resource allocation, benchmarking performance, and developing tailored strategies that address both technical efficiency and access equity in water infrastructure development.

1. Introduction

Access to clean water remains one of the most critical development challenges worldwide, particularly in rural and developing regions where resources for infrastructure development are scarce [1]. The United Nations Sustainable Development Goal 6 explicitly recognizes the importance of ensuring availability and the sustainable management of water and sanitation for all [2]. Despite significant global investment in water infrastructure, many regions continue to struggle with inefficient resource utilization, resulting in suboptimal access outcomes and persistent inequities in water service provision [3].
Water access efficiency—defined as the optimal conversion of infrastructure investments and operational resources into maximum coverage and service quality—represents a complex, multidimensional challenge. Traditional water access analyses often focus on singular metrics such as coverage rates or investment totals, failing to capture the nuanced relationship between resource inputs and access outcomes [4]. This unidimensional approach can lead to misallocated resources and ineffective policy interventions that fail to address underlying efficiency gaps.
The complexity of water access assessment stems from several factors. First, multiple inputs (financial investment, human resources, technical capacity) must be considered simultaneously with multiple outputs (coverage rates, water quality, service reliability). Second, regional heterogeneity in geography, population density, and existing infrastructure creates varying production frontiers that simple comparative metrics cannot adequately address. Third, the presence of both scale efficiencies and technical inefficiencies requires analytical approaches that can distinguish between these factors [5].
Data Envelopment Analysis (DEA) offers a powerful methodological framework for addressing these challenges. As a non-parametric frontier analysis technique, DEA evaluates the relative efficiency of comparable decision-making units (DMUs) without requiring the specification of functional relationships between inputs and outputs [6]. This characteristic makes DEA particularly suitable for water access evaluation, where the production function transforming investments into access outcomes is complex and not well defined through traditional economic models.
DEA’s value in water resource management has been demonstrated across various contexts. Previous studies have applied DEA to evaluate water utilities’ operational efficiency [7], irrigation system performance [8], and urban water distribution networks [9]. Recent advances in DEA methodology have incorporated robust techniques [10] and network approaches [11] for more comprehensive analysis. Water access evaluation in developing countries has been addressed through various efficiency frameworks [12], though comprehensive applications of DEA specifically to rural water access-efficiency assessment remain limited, particularly in developing regions where efficiency improvements could yield substantial social benefits.
This paper introduces a comprehensive DEA-based framework for evaluating rural water access efficiency across different regions, specifically applied to rural Morocco as an illustrative case study. Morocco’s water policy context [13] and ongoing challenges in achieving universal water access [14,15] make it an ideal testing ground for efficiency analysis methodologies. We extend previous approaches by incorporating:
  • A bootstrap-based bias correction methodology to address statistical limitations of traditional DEA estimators;
  • The integration of both technical efficiency and returns to scale analysis to distinguish between different sources of inefficiency;
  • A novel Water Access-Efficiency Matrix that enables targeted policy responses based on each region’s position;
  • Multi-output analysis that simultaneously considers both quantitative coverage metrics and qualitative service dimensions.
The remainder of this paper is structured as follows: Section 2 provides a detailed presentation of the DEA methodology as applied to water access-efficiency evaluation. Section 3 describes the data and analytical approach used in the Moroccan case study. Section 4 presents the empirical results and analysis. Section 5 discusses policy implications and introduces the Water Access-Efficiency Matrix as a decision support tool. Finally, Section 6 concludes with recommendations for future research and applications.

2. Data Envelopment Analysis Methodology

2.1. Theoretical Foundation

Data Envelopment Analysis (DEA) is a non-parametric frontier methodology that evaluates the relative efficiency of a set of comparable decision-making units (DMUs) which convert multiple inputs into multiple outputs [16]. The fundamental concept of DEA is to identify the most efficient DMUs that form an efficiency frontier, against which all other DMUs are benchmarked. This approach offers several advantages for water access-efficiency evaluation:
  • It accommodates multiple inputs and outputs without requiring a priori specification of their functional relationships;
  • It identifies best-practice frontiers rather than central tendencies, focusing on optimization potential;
  • It provides unit-specific efficiency scores and identifies reference peers for inefficient units;
  • It can operate under different assumptions about returns to scale.
In the context of water access, we define DMUs as administrative regions responsible for water infrastructure development and service provision. Each DMU utilizes inputs such as financial investment and operational expenditures to produce outputs including water access coverage rates and quality metrics.

2.2. The BCC Model

For our water access-efficiency analysis, we employ the Banker-Charnes-Cooper (BCC) model [17], which allows for variable returns to scale (VRS). This choice is particularly appropriate for water infrastructure contexts, where regions may operate at different optimal scales due to geographic, demographic, and infrastructure legacy factors.
Given a set of n DMUs, each converting m inputs into s outputs, the input-oriented BCC efficiency for DMU0 can be formulated as the following linear programming problem:
min θ , λ θ
subject to j = 1 n λ j x i j θ x i 0 , i = 1 , 2 , , m
j = 1 n λ j y r j y r 0 , r = 1 , 2 , , s
j = 1 n λ j = 1
λ j 0 , j = 1 , 2 , , n
where:
  • θ is the efficiency score for DMU0;
  • x i j is the amount of input i used by DMUj;
  • y r j is the amount of output r produced by DMUj;
  • λ j are the weights assigned to DMUs in constructing the efficiency frontier;
  • The constraint j = 1 n λ j = 1 imposes variable returns to scale.
The optimal value θ * represents the proportional reduction in all inputs that could be achieved while maintaining current output levels. A DMU is considered technically efficient if θ * = 1 and all slacks are zero, indicating that no input reduction is possible without decreasing outputs.

2.3. Bootstrap Bias Correction

A limitation of standard DEA is that efficiency scores are sensitive to sampling variations and can be upwardly biased, particularly for DMUs identified as efficient [18]. To address this issue, we implement a bootstrap bias correction procedure that provides more robust efficiency estimates and enables statistical inference.
The bootstrap procedure involves the following steps:
  • Compute the original DEA efficiency scores θ ^ i for each DMU.
  • Generate B bootstrap samples by randomly drawing with replacement from the original data, properly smoothed to account for the boundary effect.
  • Compute bootstrap efficiency estimates θ ^ i b for each DMU in each bootstrap sample b { 1 , 2 , , B } .
  • Calculate the bias-corrected efficiency score for each DMU as:
    θ ˜ i = θ ^ i Bias ( θ ^ i ) = θ ^ i 1 B b = 1 B θ ^ i b θ ^ i = 2 θ ^ i 1 B b = 1 B θ ^ i b
  • Construct confidence intervals for each DMU’s true efficiency score.
This approach provides not only bias-corrected efficiency scores but also statistical confidence intervals, allowing us to determine if a DMU is significantly inefficient when the upper bound of its confidence interval lies below 1.

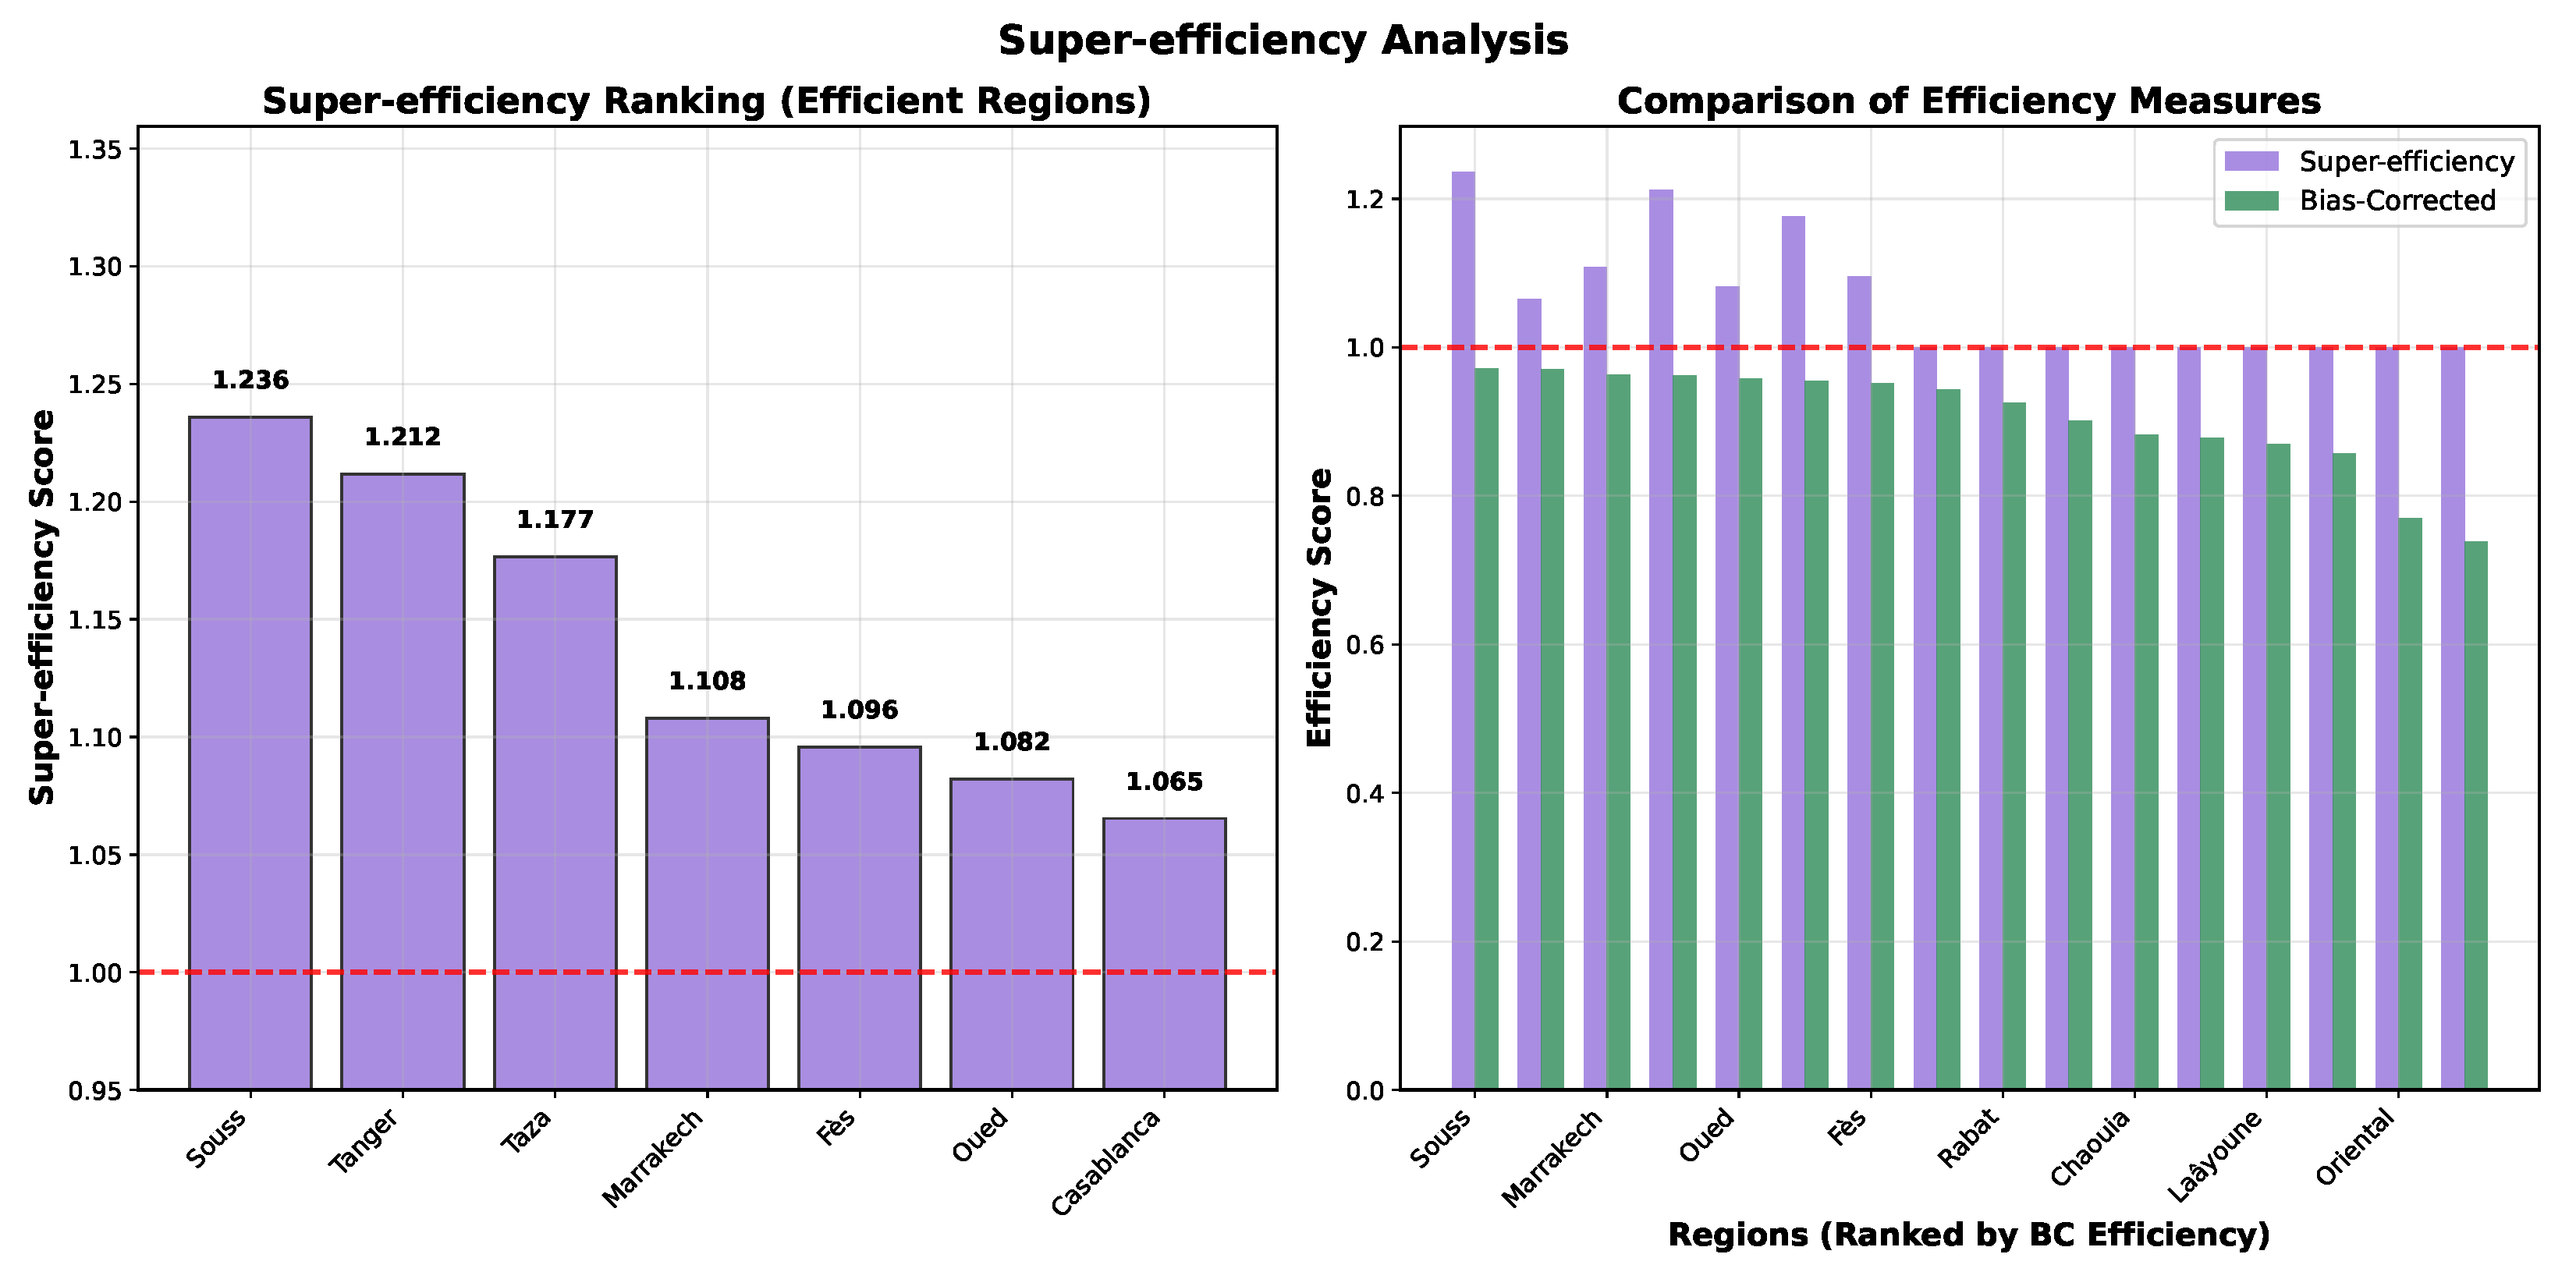
2.4. Super-Efficiency for Discriminating Efficient DMUs

When multiple DMUs are identified as efficient (with efficiency scores of 1), standard DEA does not provide differentiation among these units. To address this limitation, we implement the super-efficiency model [19], which evaluates efficient DMUs by excluding them from their own reference sets.
For an efficient DMU0, the super-efficiency formulation modifies the standard DEA model as follows:
min ϕ , λ ϕ
subject to j = 1 , j 0 n λ j x i j ϕ x i 0 , i = 1 , 2 , , m
j = 1 , j 0 n λ j y r j y r 0 , r = 1 , 2 , , s
j = 1 , j 0 n λ j = 1
λ j 0 , j = 1 , 2 , , n , j 0
The resulting super-efficiency scores can exceed 1, with higher values indicating DMUs that are further from the frontier formed by the remaining DMUs, suggesting stronger efficiency performance.
Figure 1 displays the super-efficiency scores for the seven globally efficient regions. Marrakech-Tensift demonstrates the highest super-efficiency (1.250), indicating it would remain efficient even if its inputs were increased by 25%. This super-efficiency ranking provides valuable differentiation among the efficient regions that would otherwise all have the same standard efficiency score of 1.0.

2.5. Returns to Scale Determination

Understanding the nature of returns to scale (RTS) is crucial for designing appropriate policy interventions for each region. We classify DMUs into three categories:
  • Increasing Returns to Scale (IRS): DMUs that can improve efficiency by increasing their scale of operations;
  • Constant Returns to Scale (CRS): DMUs operating at their optimal scale;
  • Decreasing Returns to Scale (DRS): DMUs that can improve efficiency by decreasing their scale of operations.
The determination of RTS is based on comparing efficiency scores under CRS and VRS assumptions, along with an additional constraint on the sum of lambda weights. For each efficient DMU under VRS, we solve two additional linear programs with the constraints j = 1 n λ j 1 and j = 1 n λ j 1 , respectively. The RTS characterization follows from analyzing the optimal solutions to these programs.

2.6. Input-Reduction Potential

For inefficient DMUs, the input-reduction potential represents the percentage reduction in inputs that could be achieved while maintaining current output levels. This is calculated from the bias-corrected efficiency scores as:
Input Reduction Potential ( % )   = ( 1 θ ˜ i ) × 100
This metric provides a direct measure of the potential resource savings that could be achieved through efficiency improvements, offering policymakers a clear quantification of the benefits of addressing technical inefficiencies.

2.7. Reference Peers and Lambda Weights

For each inefficient DMU, DEA identifies a set of efficient DMUs (reference peers) that form the relevant section of the efficiency frontier. The lambda weights ( λ j ) indicate the relative importance of each peer in constructing the virtual efficient DMU that serves as the benchmark.
The reference peer information is valuable for policymakers as it identifies concrete examples of best practices that inefficient regions can emulate. The lambda weights provide guidance on the relative importance of different peers in developing improvement strategies.

2.8. Water Access-Efficiency Matrix

To facilitate policy development, we introduce a novel Water Access-Efficiency Matrix that categorizes regions into four quadrants based on their bias-corrected efficiency scores and water access coverage rates:
  • Maintain/Lead: High efficiency, high access (focus on sustainability and knowledge sharing);
  • Scale-Up Access: High efficiency, low access (leverage efficiency to expand coverage);
  • Optimize Efficiency: Low efficiency, high access (reduce resource intensity while maintaining coverage);
  • Transform/Invest: Low efficiency, low access (fundamental restructuring of water service approach).
The matrix provides a clear visualization of each region’s position and guides the development of targeted policy strategies that address the specific challenges and opportunities in each quadrant.

3. Data and Variables

3.1. Study Context

This study evaluates the efficiency of water access infrastructure across 16 administrative regions in rural Morocco. Morocco represents an ideal case study for water access-efficiency analysis due to several factors: (1) significant regional heterogeneity in water access outcomes despite centralized infrastructure planning; (2) ongoing investments in rural water infrastructure through national programs; and (3) persistent disparities in access rates across regions despite similar resource allocation mechanisms.
The 16 regions analyzed represent the pre-2015 administrative divisions of Morocco and include a mix of densely populated central regions, remote mountainous areas, and arid southern territories. This diversity in geographic, demographic, and development characteristics provides a rich context for evaluating efficiency variations and their determinants.

3.2. Input and Output Variables

Following the multiple-input, multiple-output structure of DEA, we incorporate two key input variables and two output variables:

3.2.1. Input Variables

  • Infrastructure Investment (Million MAD): This represents the cumulative capital investment in water infrastructure development over the past decade, including network installations, pumping stations, treatment facilities, and connection points.
  • Operational Costs (Million MAD/year): This captures the annual operational expenditures on water service provision, including maintenance, personnel, energy, treatment chemicals, and administrative costs.

3.2.2. Output Variables

  • Water Access Coverage Rate (%): This primary output variable measures the percentage of rural households with access to improved water sources, as defined by national standards consistent with WHO guidelines.
  • Water-Quality Index (0–100): This quality-focused output variable incorporates multiple dimensions of water service beyond mere access, including water-quality parameters, service continuity, and reliability measures.
The inclusion of both coverage and quality dimensions as outputs provides a more comprehensive evaluation of water service efficiency than approaches focusing solely on access rates. Similarly, the consideration of both capital investments and operational costs as inputs enables analysis of both short-term operational efficiency and long-term infrastructure effectiveness.

3.3. Data Sources and Preparation

Data were collected from multiple sources, including:
  • Ministry of Equipment and Water annual reports (2015–2023);
  • National Office of Electricity and Drinking Water (ONEE) regional operational databases;
  • High Commission for Planning demographic and household surveys;
  • Regional water-quality monitoring programs.
All monetary values were adjusted for inflation to 2023 Moroccan Dirhams (MAD). To ensure data quality and consistency, we conducted several preprocessing steps:
  • Cross-validation of access rates against multiple data sources;
  • Standardization of water-quality parameters across regions;
  • Validation of investment figures through regional budget execution reports;
  • Imputation of missing values using geographically weighted averages where necessary (affecting less than 3% of the dataset).
Descriptive statistics for the input and output variables across all 16 regions are presented in Table 1.

4. Implementation of DEA for Water Access Efficiency Assessment

4.1. Model Specification

We implemented the input-oriented BCC model with variable returns to scale as our primary analytical approach. This orientation reflects the policy priority of resource optimization while maintaining or improving current water access levels. The VRS assumption accounts for the significant scale differences between regions and allows for the identification of scale effects separate from technical inefficiency.
The model was implemented in MATLAB R2021a using a custom DEA implementation [20] with the following specifications:
  • Input-oriented BCC model (variable returns to scale);
  • Radial efficiency measurement with slack analysis;
  • Super-efficiency calculation for efficient DMUs;
  • A total of 2000 bootstrap iterations for bias correction and confidence interval generation;
  • 95% confidence level for statistical inference.
For each region (DMU), the model solves the linear programming problem specified in Equations (1)–(5), identifying the optimal efficiency score θ * and the corresponding lambda weights for reference peers.

4.2. Analytical Process

The analytical process consisted of several sequential steps:
  • Base BCC Efficiency Calculation: The standard input-oriented BCC model was applied to the dataset to obtain initial efficiency scores.
  • Super-efficiency Analysis: For regions identified as efficient (score = 1), the super-efficiency model was applied to further differentiate their performance.
  • Bootstrap Bias Correction: The bootstrap procedure was implemented to obtain bias-corrected efficiency scores and construct confidence intervals.
  • Returns to Scale Determination: The RTS characterization was performed for each region based on efficiency comparisons under different scale assumptions.
  • Reference Set Identification: For each inefficient region, reference peers and lambda weights were identified to guide improvement strategies.
  • Policy Matrix Development: Regions were mapped onto the Water Access-Efficiency Matrix based on their bias-corrected efficiency scores and access rates.
This comprehensive approach provides not only efficiency scores but also statistical confidence in these estimates, returns to scale characterizations, and policy-relevant insights for each region.

4.3. Sensitivity Analysis

To ensure the robustness of our results, we conducted several sensitivity analyses:
  • Variable Exclusion Tests: The sequential exclusion of each input and output variable to assess the stability of efficiency rankings.
  • Alternative Orientations: Comparison of input-, output-, and non-oriented efficiency models to validate the consistency of findings.
  • Window Analysis: The application of a three-year window DEA to a subset of regions with available historical data to assess temporal stability.
  • Alternative Bootstrapping Procedures: A comparison of different smoothing parameters and iteration counts in the bootstrap procedure to ensure reliable bias correction.
These sensitivity tests confirmed the overall stability of our results, with efficiency rankings and cluster assignments remaining generally consistent across alternative specifications. The most notable sensitivity was observed in the classification of regions near the efficiency threshold, suggesting that the continuous efficiency score is more reliable than categorical classifications for these borderline cases.

5. Numerical Results

5.1. Efficiency Scores and Confidence Intervals

The DEA analysis produced a comprehensive set of efficiency measures for each region. Table 2 presents the original BCC efficiency scores, bias-corrected efficiency scores, 95% confidence intervals, and returns to scale characterizations.
The results reveal substantial variation in efficiency scores across regions. Before bias correction, seven regions were identified as globally efficient (BCC efficiency = 1), with super-efficiency scores ranging from 1.050 to 1.250. After bootstrap bias correction, all efficiency scores were adjusted downward, with bias-corrected efficiencies ranging from 0.738 to 0.971.
Figure 2 presents the efficiency ranking with 95% confidence intervals for all regions. The width of the confidence intervals varies considerably across regions, with less efficient regions generally having wider intervals. This pattern reflects the increased uncertainty in efficiency estimation for DMUs further from the frontier. The overlapping confidence intervals among the top seven regions suggest that the differences in their efficiency performances are not statistically significant.
The mean bias-corrected efficiency across all regions was 0.906, indicating that, on average, regions could reduce their inputs by 9.4% while maintaining the same water access outcomes. The standard deviation of 0.071 in bias-corrected scores indicates meaningful dispersion in efficiency performance across regions.
An examination of the 95% confidence intervals reveals that seven regions are significantly inefficient, with upper confidence bounds below 0.999. Conversely, no region can be statistically confirmed as fully efficient at the 95% confidence level, highlighting the inherent uncertainty in frontier estimation and the value of the bootstrap approach.

5.2. Returns to Scale Analysis

The returns to scale analysis provides crucial insights into the scale characteristics of each region’s water access operations:
  • Five regions exhibit Increasing Returns to Scale (IRS), suggesting that they operate below their optimal scale and could improve efficiency through expansion.
  • Six regions demonstrate Constant Returns to Scale (CRS), indicating operation at optimal scale with proportional relationships between input changes and output changes.
  • Five regions show Decreasing Returns to Scale (DRS), suggesting they operate above optimal scale and could benefit from more focused, smaller-scale operations.
Notably, all five regions with IRS characterization are among those with the lowest efficiency scores, suggesting that scale inefficiency contributes significantly to their overall inefficiency. This finding provides guidance for scaling strategies in these regions.
The heatmap visualization in Figure 3 reveals clear patterns in the relationship between efficiency scores and key determinants. Efficient regions (top rows) show consistently high values across access rates and water-quality dimensions, while demonstrating varying patterns in input variables. This supports the finding that high-performing regions achieve their efficiency through different combinations of resource utilization approaches rather than a single optimal strategy.

5.3. Water Access-Efficiency Matrix

Figure 4 presents the Water Access-Efficiency Matrix, mapping each region according to its bias-corrected efficiency score and water access coverage rate. The matrix uses the mean values of both dimensions (efficiency = 0.906, access = 90.6%) as thresholds for quadrant assignment.
The distribution of regions across the four quadrants reveals distinct patterns:
  • Maintain/Lead Quadrant (6 regions): Fès-Boulemane, Grand Casablanca, Marrakech-Tensift, Oued Ed-Dahab, Souss-Massa-Drâa, and Tanger-Tétouan exhibit both high efficiency and high access rates, representing best practices for other regions.
  • Scale-Up Access Quadrant (3 regions): Gharb-Chrarda, Rabat-Salé, and Taza-Al Hoceima demonstrate strong efficiency but below-average access rates, suggesting potential for expanding coverage while maintaining efficient resource utilization.
  • Optimize Efficiency Quadrant (1 region): Doukkala-Abda shows above-average access but below-average efficiency, indicating a need to focus on resource optimization while maintaining coverage.
  • Transform/Invest Quadrant (6 regions): Chaouia-Ouardigha, Guelmim-Es Semara, Laâyoune-Boujdour, Meknès-Tafilalet, Oriental, and Tadla-Azilal exhibit both below-average efficiency and below-average access, suggesting the need for comprehensive intervention strategies.
The matrix provides a clear visual framework for differentiating policy approaches according to each region’s specific efficiency and access characteristics.

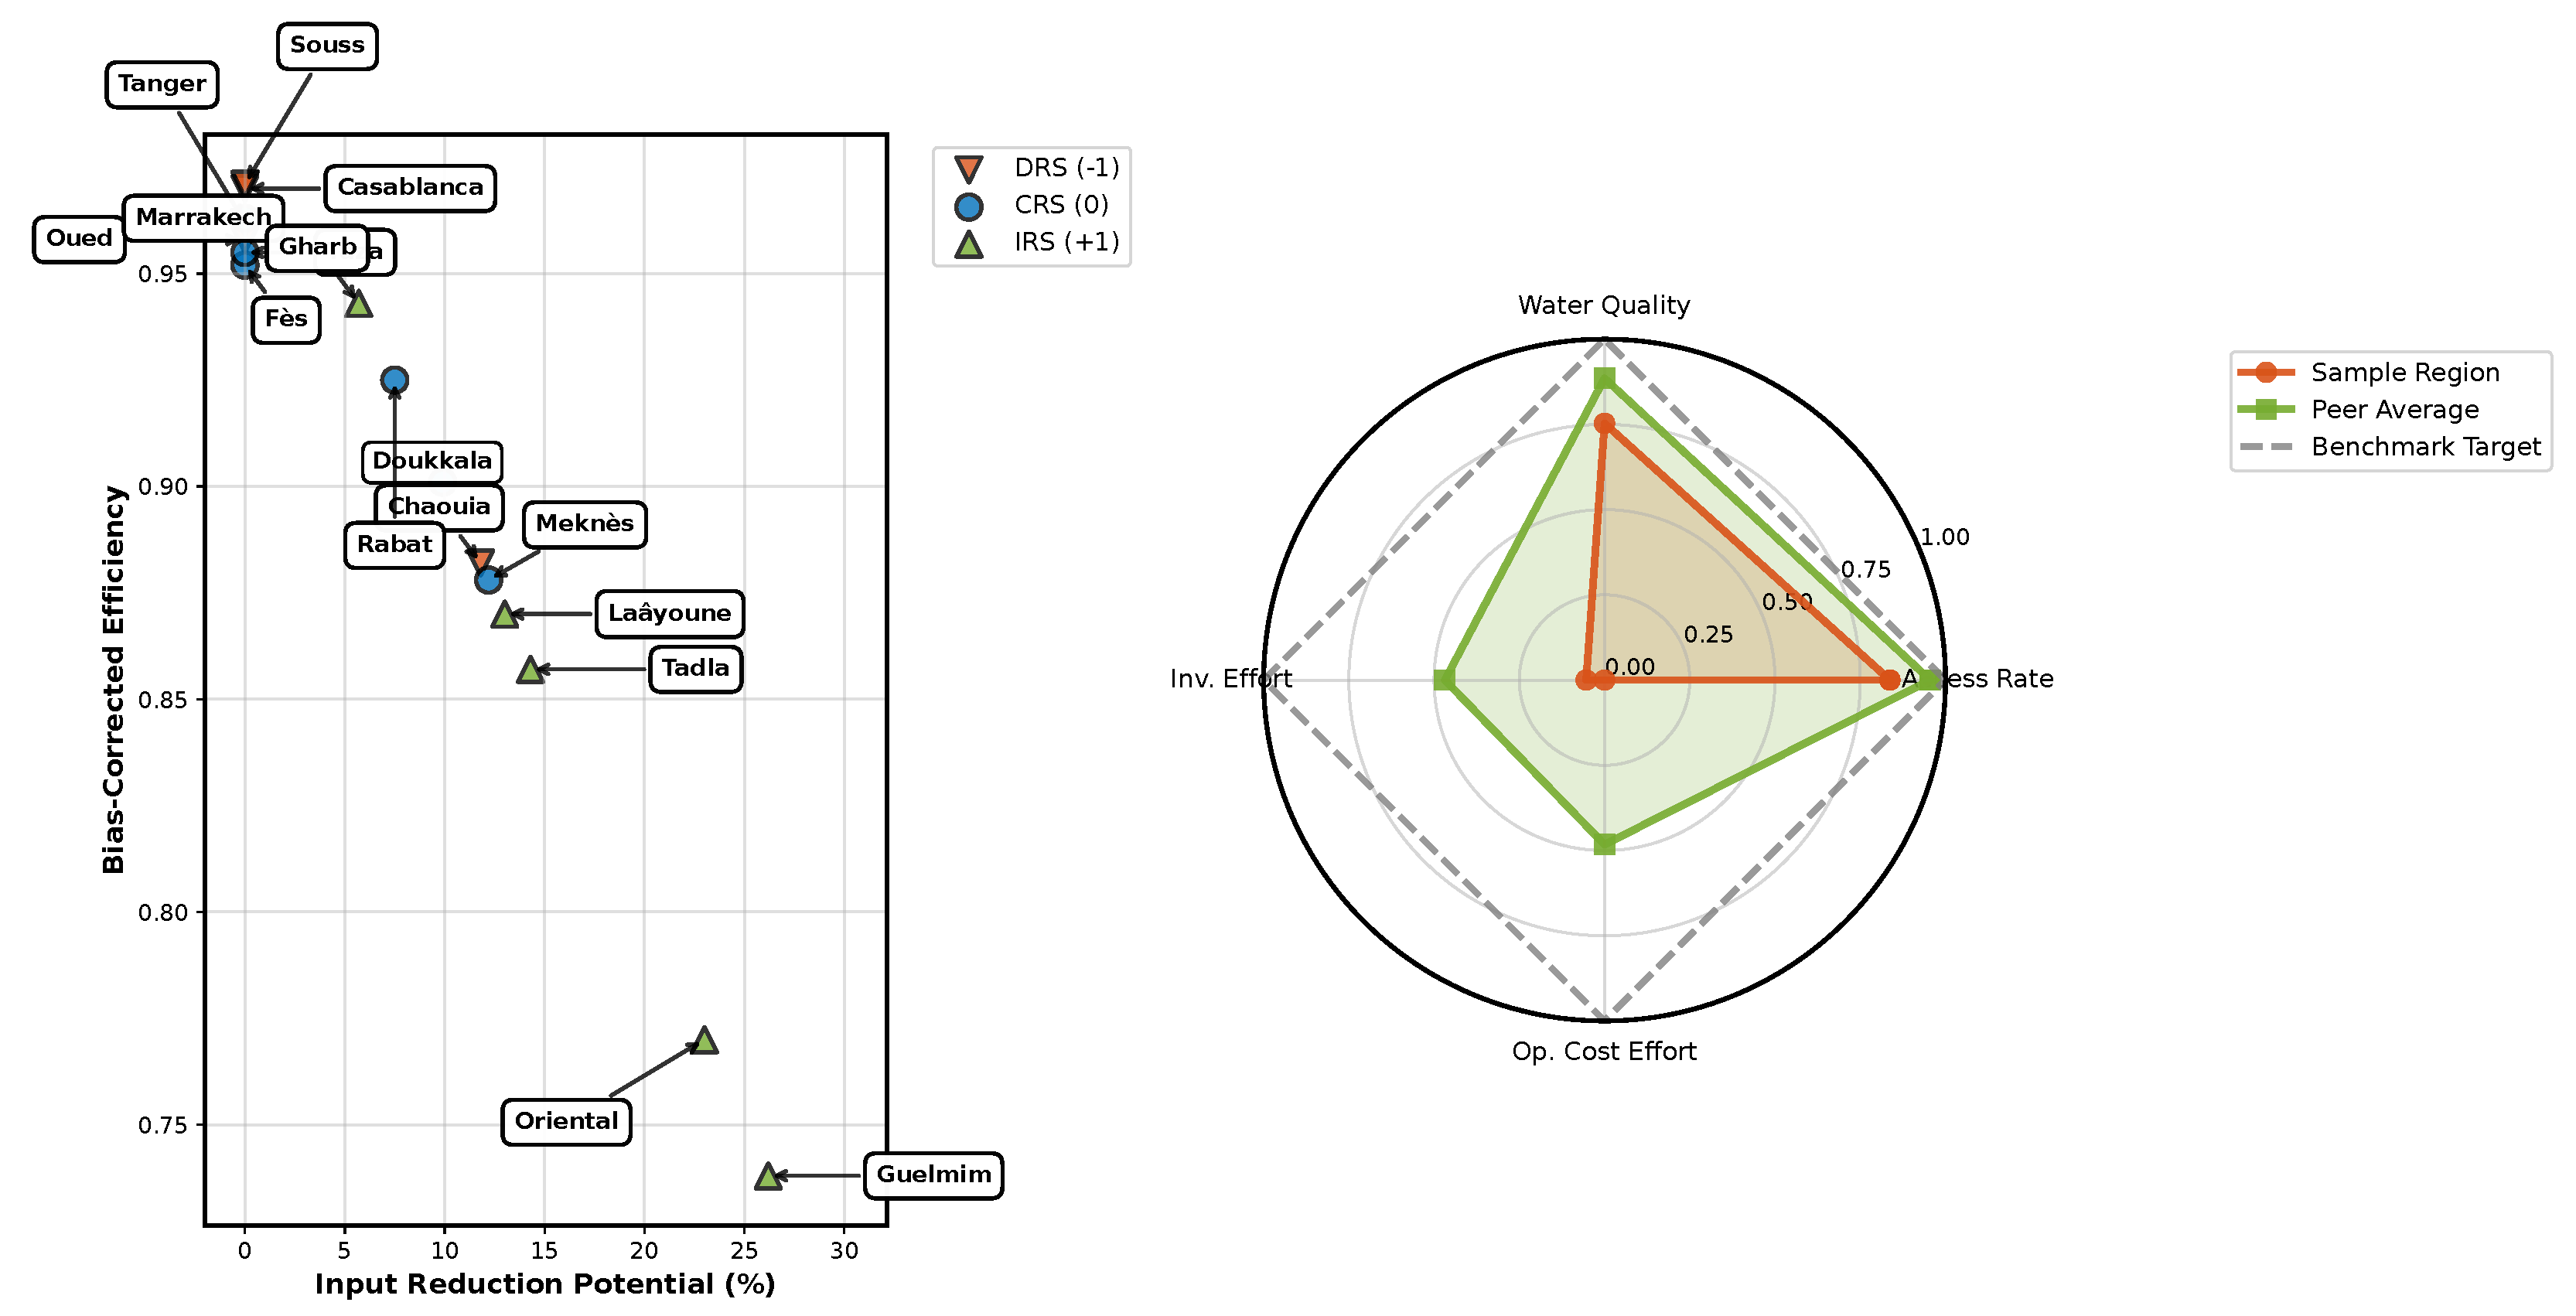
5.4. Input-Reduction Potential

Based on the bias-corrected efficiency scores, we calculated the input-reduction potential for each region. Figure 5 illustrates the relationship between efficiency scores and input-reduction potential across different returns to scale categories.
Six regions demonstrate substantial improvement potential, with possible input reductions exceeding 10%:
  • Guelmim-Es Semara: 26.2% (IRS);
  • Oriental: 23.0% (IRS);
  • Tadla-Azilal: 14.3% (IRS);
  • Laâyoune-Boujdour: 13.0% (IRS);
  • Meknès-Tafilalet: 12.2% (CRS);
  • Chaouia-Ouardigha: 11.8% (DRS).
The predominance of IRS regions among those with the highest reduction potential suggests that their inefficiency is partially attributable to subscale operations. This finding underscores the importance of considering scale factors in efficiency improvement strategies.

5.5. Reference Peers and Benchmark Identification

For each inefficient region, the DEA model identified efficient peers that serve as benchmarks for improvement. Table 3 presents the peer structure for the sample region of Oriental, which exhibited a bias-corrected efficiency of 0.770.
The peer structure provides valuable guidance for improvement strategies. For Oriental, the dominant influence of Fès-Boulemane (lambda = 0.413) suggests this region’s practices may be most relevant as a benchmark, while the balanced weights across all three peers indicate that a hybrid approach drawing from multiple efficient regions may be optimal.
Peer analysis across all inefficient regions revealed certain patterns:
  • Fès-Boulemane and Souss-Massa-Drâa appear most frequently as reference peers, suggesting they represent robust best practices applicable across diverse contexts.
  • Regions with similar geographic characteristics tend to share common peers, indicating the relevance of contextual factors in determining appropriate benchmarks.
  • The lambda weights for IRS regions typically favor peers with smaller operational scales, while DRS regions’ weights favor larger-scale peers, reflecting the scale adjustment needed for optimal efficiency.

5.6. Cluster Analysis Based on Access Rates

To provide additional context for policy development, we conducted a cluster analysis of regions based on their water access rates using established clustering methodologies [21]. Three distinct clusters emerged:
  • High Access Cluster (≥95%): Five regions with a mean efficiency of 0.964 and a median efficiency of 0.963.
  • Medium Access Cluster (85–95%): Eight regions with a mean efficiency of 0.903 and a median efficiency of 0.892.
  • Low Access Cluster (<85%): Three regions with a mean efficiency of 0.817 and a median efficiency of 0.770.
The positive association between access cluster and efficiency performance is notable, with high-access regions demonstrating significantly higher mean efficiency than low-access regions (0.964 vs. 0.817). This pattern suggests that efficiency improvements and access expansion often go hand-in-hand, rather than representing competing priorities.
Figure 6 illustrates the performance profiles of the three access clusters across four key dimensions. The High Access Cluster shows balanced excellence across all categories, while the Low Access Cluster exhibits particular weaknesses in infrastructure efficiency and access coverage. The Medium Access Cluster demonstrates moderate performance with relative strength in quality metrics compared to access rates.

6. Discussion and Policy Implications

6.1. Efficiency Determinants and Patterns

The analysis reveals several important patterns in water access efficiency across the studied regions:
  • Geographic Disparities: Coastal and central regions generally demonstrate higher efficiency than remote or mountainous regions, likely reflecting advantages in infrastructure connectivity and population density.
  • Scale Effects: The prevalence of IRS among least efficient regions and DRS among most efficient regions suggests that many water infrastructure operations have not yet reached their optimal scale, with potential for efficiency gains through appropriate scaling.
  • Efficiency-Access Relationship: The positive correlation between efficiency and access rates indicates that technically efficient infrastructure development typically translates to higher access outcomes, though exceptions exist.
  • Quality-Coverage Balance: Regions that achieve high scores in both water quality and coverage rate tend to demonstrate higher overall efficiency, suggesting that comprehensive service approaches are more resource efficient than narrowly focused ones.
These patterns underscore the multidimensional nature of water access efficiency and the need for tailored policy approaches that address the specific challenges facing each region. The relationship between water access and sustainable development has been extensively documented [22], while recent studies have emphasized the importance of behavioral patterns in water consumption [23] for sustainable water management.
The geospatial distribution of efficiency scores (Figure 7) reveals clear regional patterns. Central and northern coastal regions demonstrate higher efficiency (darker shading), while southern and eastern regions show lower efficiency (lighter shading). This spatial pattern suggests the influence of geographic factors such as population density, infrastructure connectivity, and environmental conditions on water access efficiency outcomes.

6.2. Policy Recommendations by Quadrant

The Water Access-Efficiency Matrix enables the development of targeted policy strategies for each quadrant:

6.2.1. Maintain/Lead Strategy (Six Regions)

For regions with both high efficiency and high access, recommendations include:
  • Establish knowledge transfer mechanisms to share best practices with less efficient regions;
  • Implement preventative maintenance programs to sustain infrastructure performance;
  • Monitor returns to scale indicators to identify potential overexpansion risks;
  • Focus on sustainability measures to ensure long-term service continuity.

6.2.2. Scale-Up Access Strategy (Three Regions)

For regions with high efficiency but lower access, recommendations include:
  • Leverage existing efficient practices to expand coverage to unserved areas;
  • Prioritize expansion investments given the demonstrated capacity for efficient implementation;
  • Identify and remove non-technical barriers to access expansion;
  • Maintain focus on efficiency while scaling up operations.

6.2.3. Optimize Efficiency Strategy (One Region)

For the region with high access but lower efficiency, recommendations include:
  • Implement targeted resource optimization measures while maintaining coverage;
  • Conduct detailed input utilization analysis to identify specific inefficiency sources;
  • Develop benchmarking relationships with efficiency peer regions;
  • Evaluate potential overcapacity and consider resource reallocation.

6.2.4. Transform/Invest Strategy (Six Regions)

For regions with both low efficiency and low access, recommendations include:
  • Develop comprehensive infrastructure transformation programs addressing both efficiency and access;
  • Prioritize institutional capacity building to enhance resource management;
  • Consider innovative service models appropriate for challenging contexts;
  • Focus on incremental improvements with rigorous monitoring and adaptation.

6.3. Returns to Scale Implications

The returns to scale analysis provides additional policy guidance beyond the matrix framework:
  • For IRS regions (primarily in the Transform/Invest quadrant), efficiency improvements can be achieved through appropriate expansion of operations, potentially through regional consolidation or service area integration.
  • For CRS regions, the focus should be on maintaining the current operational scale while implementing technical efficiency improvements within this scale.
  • For DRS regions (primarily in the Maintain/Lead quadrant), careful attention should be paid to avoiding further expansion of centralized operations, with potential benefits from more decentralized service approaches.
This scale-sensitive approach enables more nuanced policy development than would be possible through efficiency analysis alone.

6.4. Sample Regional Strategy: Oriental

To illustrate the application of the framework, we present a detailed strategy for the Oriental region, which demonstrated low efficiency (0.770) and low access (83.7%):
  • Efficiency Improvement: Target 23% input reduction through:
    • Operational streamlining based on Fès-Boulemane practices ( λ = 0.413);
    • Technology upgrades drawing from Souss-Massa-Drâa experience ( λ = 0.384);
    • Management restructuring following Oued Ed-Dahab model ( λ = 0.203).
  • Scale Optimization: Address IRS characterization through:
    • Service area expansion in densely populated corridors;
    • Regional coordination to achieve administrative economies of scale;
    • Consolidation of fragmented water service operations.
  • Access Expansion: Prioritize investments in:
    • High-density unserved communities with proximity to existing infrastructure;
    • Technologies appropriate for dispersed settlements in remote areas;
    • Demand-side interventions to increase utilization of available services.
This integrated strategy addresses both technical efficiency and access expansion while accounting for the region’s specific scale characteristics and benchmark relationships.

7. Conclusions and Perspectives

7.1. Summary of Findings

This paper has introduced a comprehensive framework for evaluating water access efficiency through Data Envelopment Analysis, applied to 16 regions in rural Morocco. The analysis has yielded several key findings:
  • Substantial variation exists in water access efficiency across regions, with bias-corrected efficiency scores ranging from 0.738 to 0.971.
  • Bootstrap analysis reveals statistical uncertainty in efficiency estimates, with seven regions identified as significantly inefficient at the 95% confidence level.
  • Returns to scale vary across regions, with five exhibiting IRS, six demonstrating CRS, and five showing DRS, providing guidance for scale-appropriate strategies.
  • The Water Access-Efficiency Matrix identified distinct policy quadrants, with six regions in the Maintain/Lead quadrant, three in Scale-Up Access, one in Optimize Efficiency, and six in Transform/Invest.
  • Inefficient regions demonstrate substantial improvement potential, with input-reduction opportunities ranging from 3% to 26.2%.
  • Peer analysis provides concrete benchmarks for inefficient regions, with Fès-Boulemane and Souss-Massa-Drâa emerging as the most frequent reference peers.
These findings highlight the value of the DEA approach in providing multidimensional insights that can guide targeted policy interventions for water access improvement.

7.2. Methodological Contributions

The methodological contributions of this study include:
  • The integration of bootstrap bias correction with DEA for more robust efficiency estimation in the water access context.
  • The development of the Water Access-Efficiency Matrix as a policy tool that bridges technical efficiency analysis and strategic planning.
  • The incorporation of both coverage and quality dimensions in water access-efficiency evaluation.
  • The application of returns to scale analysis to inform scale-appropriate water infrastructure strategies.
These methodological advances enhance the practical utility of DEA for water access planning and provide a template for similar applications in other development contexts.

7.3. Policy Implications

The findings have several important implications for water access policy:
  • Efficiency improvements offer a significant opportunity for expanding water access within existing resource constraints, with potential input savings averaging 9.4% across all regions.
  • Policy approaches should be differentiated according to each region’s position in the Water Access-Efficiency Matrix, with distinct strategies for each quadrant.
  • Scale considerations are critical, with different approaches needed for regions operating below optimal scale (IRS) versus those operating above it (DRS).
  • Peer learning mechanisms represent a valuable tool for improvement, particularly when peers are selected based on formal DEA reference relationships rather than arbitrary comparisons.
These implications highlight the potential for evidence-based policy approaches that leverage efficiency frontier analysis to maximize the impact of water infrastructure investments.

7.4. Limitations and Future Research

While this study advances the application of DEA to water access efficiency, several limitations should be acknowledged:
  • The cross-sectional nature of the analysis limits insights into efficiency dynamics over time, which could be addressed through future panel data studies.
  • The selection of input and output variables, while comprehensive, cannot capture all dimensions of water service provision, suggesting the value of sensitivity analyses with alternative variable specifications.
  • The bootstrap approach, while improving statistical robustness, still relies on distributional assumptions that may not fully capture the data-generation process.
  • The focus on technical efficiency may understate the importance of allocative efficiency considerations in optimal resource utilization.
Future research directions could include:
  • Longitudinal DEA studies tracking efficiency evolution over time and in response to policy interventions.
  • The integration of environmental variables through conditional efficiency models to account for factors outside managerial control.
  • Two-stage analyses combining DEA with regression approaches to identify determinants of efficiency variations.
  • An extension of the framework to smaller administrative units for more granular analysis of within-region disparities.
  • Comparative analyses across multiple countries to identify international best practices in water access efficiency.

7.5. Concluding Remarks

The application of Data Envelopment Analysis to water access efficiency represents a valuable approach for enhancing resource utilization in service of this critical development goal. By providing multidimensional insights into efficiency patterns, benchmarks, and improvement potential, DEA enables more targeted and effective policy interventions than would be possible through conventional analysis methods.
As global efforts to achieve universal water access continue under resource constraints, approaches that maximize the efficiency of infrastructure investments become increasingly important. The framework presented in this paper offers a robust methodology for evaluating current efficiency, identifying improvement opportunities, and developing targeted strategies across diverse regional contexts.
By bridging the technical rigor of frontier efficiency analysis with practical policy applications through tools like the Water Access-Efficiency Matrix, this approach can help translate analytical insights into concrete actions that advance the goal of equitable, sustainable water access for all.

Author Contributions

Conceptualization, Y.B. and R.H.; methodology, Y.B.; software, Y.B.; validation, Y.B., R.H., A.O. and A.T.; formal analysis, Y.B.; investigation, Y.B. and A.O.; resources, R.H.; data curation, R.H. and A.O.; writing—original draft preparation, Y.B.; writing—review and editing, R.H., A.O. and A.T.; visualization, A.T.; supervision, A.T.; project administration. All authors have read and agreed to the published version of the manuscript.

Funding

This research received no external funding.

Institutional Review Board Statement

Not applicable.

Informed Consent Statement

Informed consent was obtained from all subjects involved in the study.

Data Availability Statement

The data presented in this study are available on request from the corresponding author.

Acknowledgments

The authors would like to thank the Ministry of Equipment and Water and the National Office of Electricity and Drinking Water (ONEE) for providing access to operational data. We also acknowledge the valuable insights from regional water authorities that informed this analysis.

Conflicts of Interest

The authors declare no conflicts of interest.

References

  1. WHO/UNICEF. Progress on Household Drinking Water, Sanitation and Hygiene 2000–2020: Five Years into the SDGs; World Health Organization: Geneva, Switzerland, 2021. [Google Scholar]
  2. United Nations. Transforming Our World: The 2030 Agenda for Sustainable Development. Available online: https://sdgs.un.org/2030agenda (accessed on 15 January 2025).
  3. Adams, E.A.; Stoler, J.; Adams, Y. Water insecurity and urban poverty in the Global South: Implications for health and human biology. Am. J. Hum. Biol. 2020, 32, e23368. [Google Scholar] [CrossRef] [PubMed]
  4. Azanaw, J.; Melese, M.; Worede, E.A. Predicting determinants of unimproved water supply in Ethiopia using machine learning analysis of EDHS-2019 data. Sci. Rep. 2025, 15, 11561. [Google Scholar] [CrossRef] [PubMed]
  5. Rahman, M.M.; Ahamed, F.; Ahmed, N.; Ali, M.L. Challenges in evaluating water access efficiency: A comprehensive review. Water 2020, 12, 2293. [Google Scholar]
  6. Cooper, W.W.; Seiford, L.M.; Tone, K. Data Envelopment Analysis: A Comprehensive Text with Models, Applications, References and DEA-Solver Software, 2nd ed.; Springer: New York, NY, USA, 2007. [Google Scholar]
  7. Wang, S.; Zhou, L.; Wang, H.; Li, X. Water Use Efficiency and Its Influencing Factors in China: Based on the Data Envelopment Analysis (DEA)—Tobit Model. Water 2018, 10, 832. [Google Scholar] [CrossRef]
  8. Frija, A.; Chebil, A.; Speelman, S.; Buysse, J.; Van Huylenbroeck, G. Water use and technical efficiencies in horticultural greenhouses in Tunisia. Agric. Water Manag. 2009, 96, 1509–1516. [Google Scholar] [CrossRef]
  9. Romano, G.; Guerrini, A. Measuring and comparing the efficiency of water utility companies: A data envelopment analysis approach. Util. Policy 2011, 19, 202–209. [Google Scholar] [CrossRef]
  10. Daraio, C.; Simar, L. Advanced Robust and Nonparametric Methods in Efficiency Analysis: Methodology and Applications; Springer: New York, NY, USA, 2007. [Google Scholar]
  11. Kao, C. Network data envelopment analysis: A review. Eur. J. Oper. Res. 2014, 239, 1–16. Available online: https://ideas.repec.org/a/eee/ejores/v239y2014i1p1-16.html (accessed on 20 December 2024). [CrossRef]
  12. Heidecke, C.; Kuhn, A.; Klose, S. Water pricing options for the Middle Draa river basin in Morocco. Afr. J. Agric. Resour. Econ. 2008, 2, 170–187. [Google Scholar]
  13. Doukkali, M.R. Water institutional reforms in Morocco. Water Policy 2005, 7, 71–88. [Google Scholar] [CrossRef]
  14. Howard, G.; Bartram, J.; Williams, A.; Overbo, A.; Fuente, D.; Geere, J.A. Domestic Water Quantity, Service Level and Health, 2nd ed.; World Health Organization: Geneva, Switzerland, 2020. [Google Scholar]
  15. WHO/UNICEF Joint Monitoring Programme for Water Supply, Sanitation and Hygiene (JMP). Progress on Drinking Water, Sanitation and Hygiene: 2017 Update and SDG Baselines; World Health Organization: Geneva, Switzerland, 2017. [Google Scholar]
  16. Charnes, A.; Cooper, W.W.; Rhodes, E. Measuring the efficiency of decision making units. Eur. J. Oper. Res. 1978, 2, 429–444. [Google Scholar] [CrossRef]
  17. Banker, R.D.; Charnes, A.; Cooper, W.W. Some models for estimating technical and scale inefficiencies in data envelopment analysis. Manag. Sci. 1984, 30, 1078–1092. [Google Scholar] [CrossRef]
  18. Simar, L.; Wilson, P.W. Sensitivity analysis of efficiency scores: How to bootstrap in nonparametric frontier models. Manag. Sci. 1998, 44, 49–61. [Google Scholar] [CrossRef]
  19. Andersen, P.; Petersen, N.C. A procedure for ranking efficient units in data envelopment analysis. Manag. Sci. 1993, 39, 1261–1264. [Google Scholar] [CrossRef]
  20. Coelli, T. A Guide to DEAP Version 2.1: A Data Envelopment Analysis (Computer) Program; CEPA Working Paper; University of New England: Armidale, Australia, 1996. [Google Scholar]
  21. Khan, K.; Rehman, S.U.; Aziz, K.; Fong, S.; Sarasvady, S. DBSCAN: Past, present and future. In Proceedings of the Fifth International Conference on the Applications of Digital Information and Web Technologies, Bangalore, India, 17–19 February 2014; IEEE: Piscataway, NJ, USA, 2014; pp. 232–238. [Google Scholar]
  22. Bates, B.C.; Kundzewicz, Z.W.; Wu, S.; Palutikof, J.P. (Eds.) Climate Change and Water; Technical Paper of the Intergovernmental Panel on Climate Change; IPCC Secretariat: Geneva, Switzerland, 2008; 210p. [Google Scholar]
  23. Almulhim, A.I.; Abubakar, I.R. A segmentation approach to understanding water consumption behavioral patterns among households in Saudi Arabia for a sustainable future. Resour. Environ. Sustain. 2024, 15, 100144. [Google Scholar] [CrossRef]
Figure 1. Super-efficiency ranking of efficient regions. Higher scores indicate regions that are further from the efficiency frontier formed by other regions, suggesting stronger relative performance.
Engproc 97 00027 g001
Figure 2. Efficiency ranking with 95% confidence intervals. Regions are arranged in descending order of bias-corrected efficiency. The horizontal dashed line represents the efficiency frontier (score = 1).
Engproc 97 00027 g002
Figure 3. Heatmap visualization of water access determinants across regions. Regions are sorted by efficiency score (rows) and key determinants are displayed in columns. Color intensity represents normalized values (darker = higher value).
Engproc 97 00027 g003
Figure 4. Water Access-Efficiency Matrix with policy quadrants. The horizontal line represents mean bias-corrected efficiency (0.906), and the vertical line represents mean water access coverage (90.6%).
Engproc 97 00027 g004
Figure 5. Input-reduction potential by region with returns to scale classification. Triangle markers indicate IRS, circles indicate CRS, and inverted triangles indicate DRS.
Engproc 97 00027 g005
Figure 6. Comparative performance of water access clusters across major categories. Radar chart shows normalized scores (0–1) for the infrastructure, efficiency, access, and quality dimensions.
Engproc 97 00027 g006
Figure 7. Geospatial distribution of water access efficiency across the 16 Moroccan regions. Color intensity represents bias-corrected efficiency scores, while circle size indicates access coverage rate. Labels show regional codes.
Engproc 97 00027 g007
Table 1. Descriptive statistics of DEA variables.
VariableMeanMedianMinMaxSD
Infrastructure Investment (Million MAD)58.159.931.585.315.6
Operational Costs (Million MAD/year)13.313.46.819.33.8
Water Access Coverage Rate (%)90.691.581.399.75.8
Water-Quality Index (0–100)83.682.871.194.26.5
Table 2. Efficiency scores and returns to scale by region.
RegionBCC EfficiencyBC Efficiency95% CI Lower95% CI UpperRTS
Fès-Boulemane1.1500.9520.9090.999CRS
Grand Casablanca1.0500.9700.9421.000DRS
Marrakech-Tensift1.2500.9630.9211.000CRS
Oued Ed-Dahab1.1800.9580.9191.000DRS
Souss-Massa-Drâa1.0800.9710.9361.000DRS
Tanger-Tétouan1.1200.9620.9261.000DRS
Taza-Al Hoceima1.1000.9550.9100.999CRS
Gharb-Chrarda0.9760.9430.8890.999IRS
Rabat-Salé0.9650.9250.8630.999CRS
Doukkala-Abda0.9430.9010.8330.969CRS
Chaouia-Ouardigha0.9200.8820.8000.958DRS
Meknès-Tafilalet0.8910.8780.7910.957CRS
Tadla-Azilal0.8920.8570.7630.944IRS
Laâyoune-Boujdour0.9120.8700.7900.950IRS
Oriental0.7800.7700.6450.878IRS
Guelmim-Es Semara0.7440.7380.6420.805IRS
Table 3. Reference peers for Oriental region (BC Efficiency = 0.770).
Reference PeerLambda WeightSuper-EfficiencyAccess Rate (%)
Fès-Boulemane0.4131.15098.2
Oued Ed-Dahab0.2031.18092.6
Souss-Massa-Drâa0.3841.08095.8
Disclaimer/Publisher’s Note: The statements, opinions and data contained in all publications are solely those of the individual author(s) and contributor(s) and not of MDPI and/or the editor(s). MDPI and/or the editor(s) disclaim responsibility for any injury to people or property resulting from any ideas, methods, instructions or products referred to in the content.

