Abstract
Natural fibre-reinforced composites are becoming increasingly popular due to their affordability, sustainability, and biodegradability. These composites, made from recyclable materials, are suitable for various sustainable energy applications due to their remarkable mechanical properties and life cycle advantages. The biodegradable composite materials are a sustainable alternative for energy applications. This composite construction uses Soric XF (Lantor Composites, Veenendaal, The Netherlands) as the fibre reinforcement core material and jute fibre, an eco-friendly and sustainable substitute for glass fibre reinforcement composite materials, as the outer face sheet obtained from jute bags. The dry fibres are piled as dry loads at various fibre orientation angles, including 0°, 45°, and 90°, and this orientation will be reflected in the composite strength. Vacuum-assisted resin transfer moulding (VARTM) is a technique used to fabricate this material at room temperature. Further, this research focuses on a comparative analysis of experimental and computational results involving composite materials with jute fibre as the outer face sheet and Soric XF as the fibre reinforcement core material. The experimental investigation included tensile ASTM D638-03 and flexural ASTM D790 to evaluate the composite’s mechanical properties and structural integrity under various load conditions. Simultaneously the computational simulations were performed using the ANSYS-Mechanical 2023 R2 to replicate these conditions and predict the composite’s performance. The experimental and simulated data were analysed and compared. This study demonstrates the efficacy of using computational tools to predict the behaviour of natural fibre composites. It underscores the importance of experimental validation for enhancing the reliability of simulation models. The results from the computational study are compared with the experimental results to study the predictive nature of the NFRC material.
1. Introduction
The usage of polymer sandwich composites reinforced with carbon, glass fibres, etc. have been drastically increasing in the recent years. Because of their mechanical qualities, their applications are gradually growing due to high carbon emissions. Natural fibres like jute, bamboo, coir, flax, hemp, etc. are used instead of synthetic fibres to create modern strength composites and lower carbon emissions. Natural fibres also favour the “go green” technology in composite fibre fabrication systems due to their biodegradable and renewable properties. They reduce the carbon footprint in our ecosystem [1]. When compared to traditional metals, synthetic composites are also more affordable. However, synthetic materials are not recyclable or naturally degradable, posing environmental issues in waste management. Natural fibres are valuable because they do not create waste when separated. Any leftover material can be used to make biogas or to fertilize crops and the High-Performance Graphene-Based Natural Fiber Composites [2] Wood polymer flake boards, used to make frames for doors and windows, are manufactured by numerous wood industries. They are also used in the building industry to make beams, roofing materials, and crossing bridges [3]. Because they have strong insulation qualities, they are also employed to soundproof passenger compartments to prevent noise and vibration. Natural fibre-reinforced composites, or NFRC, are also utilized in packaging materials, safety materials, safety helmets, and toys, and they are also used in the building industry. It is not easy to replace alternatives to oil and gas with renewable energy sources. It is not as simple to maintain the balance between essential factors like energy efficiency and pollution-free or very low-pollution energy sources, but current research attempts to achieve that on both an industrial and laboratory scale. Therefore, the primary goal in finding a substitute was to reduce carbon emissions that significantly affect the environment. When utilizing renewable energy technologies, the higher cost of financing is another factor to consider. However, governments worldwide are offering subsidiaries to promote these renewable energy sources. Solar, photovoltaic, and wind power have recently earned much support, similar to startups or businesses.
The probable viability and accessibility of renewable energy sources, including solar and wind power, depend on the temperature status and geological zone [4]. Natural fibres can be easily moulded into various shapes and offer numerous benefits, such as satisfactory tensile properties, affordability, minimal cost, insulating properties, exceptional toughness, favourable thermal characteristics, low density, corrosion resistance, and lightweight (e.g., the natural fibres have a density of 1.3 g/cm3 compared to 2.5 g/cm3 for fiberglass) Scientists are researching the development of many polymer composites with readily available natural fibres to increase the mechanical qualities and performance toward the environment [5]. This study uses jute fibre, a natural fibre, as an outer face sheet for sandwich composite material. Jute fibre are considered to be highly demanded macrofibre within the industry due to its affordability and widespread availability, making it a preferred option over other natural fibres. Its economic viability and non-abrasive properties allow for integrating substantial filling levels, resulting in notable cost reduction in composite production processes. Historically, jute fibres were used in jute fibre ropes, sack bags, cloths, and geotextiles. Nevertheless, in current times, the utilisation of jute fibres has transcended these conventional applications. Specifically, industries have begun recognising and leveraging the advantages of fabricated jute fibres for the automotive industry, wind blades, etc. [6,7]. Soric XF is a honeycomb core material used in sandwich composite manufacturing. It is a nonwoven core infused with polypropylene featuring a hexagonal groove and compressive resistance, enabling traditional manufacturing techniques through resin infusion. Sandwich composite structures, especially those with honeycomb cores, are utilized extensively because they have excellent characteristics (such as bending and compression) compared to conventional composite laminates.
Sandwich composites with honeycomb structures are lightweight core materials with high performance and low vibration in aerospace, automotive, windmill blades, construction, and marine applications [8]. These fibres (jute fibre, Soric XF fibre) are fabricated using a vacuum infusion or VARTM process for a better fibre-to-resin ratio. VARTM impregnates fibre performance and has an advantage in product quality and various designable product shapes. The VARTM process is used in the manufacturing engineering of wind blades, aerospace components, and hulls for boats. The advantages of using the VARTM process are cost-effectiveness, less processing time, uniform epoxy coverage, bonding multiple layers into a single surface for one application, and good-quality products. The [9] VARTM process improves polymer impregnation of plant fibres by using a vacuum to create a natural fibre-reinforced composite (NFRC). This method enhances the bonding between the plant fibres and the polymer. Compared to hand layup and compression moulding, VARTM significantly reduces the void content in NFRC, leading to better product performance. The fabricated NFRC samples are further subjected to scanning electron microscope analysis to find the matrix errors and dispersion of resin and fibre.
Creating sustainable materials has become increasingly important for various businesses, especially the energy sector, in recent years. Natural fibre composites with synthetic or bio-based [10] matrices provide a sustainable substitute for conventional materials like metals and polymers. In a study the pineapple leaf based composite laminates shows significant improved strength [11]. These sustainable composites are becoming increasingly sought after because of their outstanding performance in particular applications, recyclability, and decreased environmental effects. Their mechanical qualities, including tensile and flexural strength, have been the subject of multiple investigations due to their potential for structural applications, including energy-related industries. Designing materials that endure operating challenges while preserving sustainability requires understanding these characteristics. The bio inspired based sustainable composite materials can also observe to have capacity of absorbing the shock and also can dissipate the absorbed energy [12].
Jute and related fibres are natural fibre-reinforced composites (NFRCs) known for their biodegradability, strength-to-weight ratios, and relative lightweight. However, these composites behave in an anisotropic manner, which means that the orientation of the fibre affects their mechanical characteristics. Because of this feature, fibre orientation analysis is crucial, particularly for structural applications where directional pressures are frequent. Examining these composites’ tensile and flexural characteristics is essential for energy applications as materials frequently encounter variable load situations [13]. Two essential structural integrity and durability markers are tensile strength, which gauges resistance to pulling forces, and flexural strength, which evaluates behaviour under bending.
In a study, by employing the activated carbon along with the jute fibres and polyester based composites shows a significant improvement in the stiffness of the material, in contradictory the strength and ductility of the materials were observed to be compromised drastically [14]. The composites materials developed with the combination of PLA with jute and flax fibers were undergone various investigation for the suitability of engineering applications, form the observed results jute fiber based composite material shows significantly lesser mechanical properties when compared to the combination of PLA-Falx composites [15].
This study aims to assess the suitability of a composite material composed of jute and Soric layers for use as a structural material in the energy industry. The Soric layers provide flexibility and weight distribution, while the jute fibres offer strength. These elements are combined to form a well-balanced composite that may be used in lightweight manufacturing. To describe the mechanical behaviour of the composite and learn more about its load-bearing capacity and failure modes, the project simulates tensile and flexural testing. Static structural analysis, which enables the study of how the material reacts to applied forces without the impacts of changes in load or time-dependent behaviour, is used to simulate these tests to represent real-world conditions correctly.
Another important component of composite materials’ performance is fibre orientation. Three typical orientations are examined in this study: 0°, 45°, and 90°. Since fibre alignment concerning the applied load can significantly affect stress distribution, deformity, and total material strength, each orientation offers distinct mechanical properties. Because the fibres directly oppose the applied force, a 0° orientation, where the fibres line up with the load direction, usually provides the highest tensile strength. Conversely, a 90° orientation, where the fibres are opposite to the load, can provide improved flexural qualities but frequently exhibits decreased tensile strength. The 45° orientation offers an intermediate profile that balances tensile and shear qualities for specific structural uses with multidirectional forces.
By evaluating these composites under regulated loading circumstances, the static structural approach employed in this analysis allows for predicting the material’s behaviour under tensile and flexural loads. The research offers valuable information on the structural integrity of each configuration by examining maximum distortion, von Mises stress, and safety variables. Under energy applications, where material must retain structural integrity over extended operating times and sometimes under challenging conditions, the analysis of deformation and stress distributions is especially pertinent. The study compares breaking loads and strain tendencies in various fibre architectures to identify the best fibre configurations for energy storage or production applications.
This study examines the mechanical behaviour of 3-layer and 5-layer composite constructions using computer simulations to ascertain their efficacy and load-bearing capacity. While the 5-layer structure is assessed for its potential to improve structural strength and stability, the 3-layer composite, which has fewer layers, acts as a foundation for mechanical performance. The results are anticipated to show how layer configuration affects load-bearing capacity and material fracture under stress. The design and optimization of environmentally friendly composite materials for energy applications, where preserving strength under load is crucial for operational effectiveness and safety, can benefit from this expertise.
Overall, by thoroughly examining the structural characteristics of these materials under tensile and flexural loads, this research aims to aid in designing environmentally conscious composite materials for energy-related uses. The study’s findings will help choose and create composite materials suited for outstanding performance energy systems, advancing sustainability and satisfying the requirements of contemporary engineering applications.
2. Method of Fabrication and Materials
2.1. Materials Obtained from Different Sources
The present study uses EPOTEC YD 535 LV epoxy resin, HARDENER TH-7257 hardener from Aditya Birla Advanced Materials, (Ultramarine Yatch Private Limited, Puducherry, India) and a Soric XF core fibre mat sourced from an ultramarine yacht. The epoxy resin has a density of 1.10–1.20 g cm3, the viscosity is 1200–1400 mPa, the specific gravity of the hardener is 0.90–1.10 g cm3, and the viscosity is 250–300 cP. Jute fibre is obtained from local suppliers and used as a natural reinforcement composite.
2.2. Fabrication of NFRC Using the VARTM Process
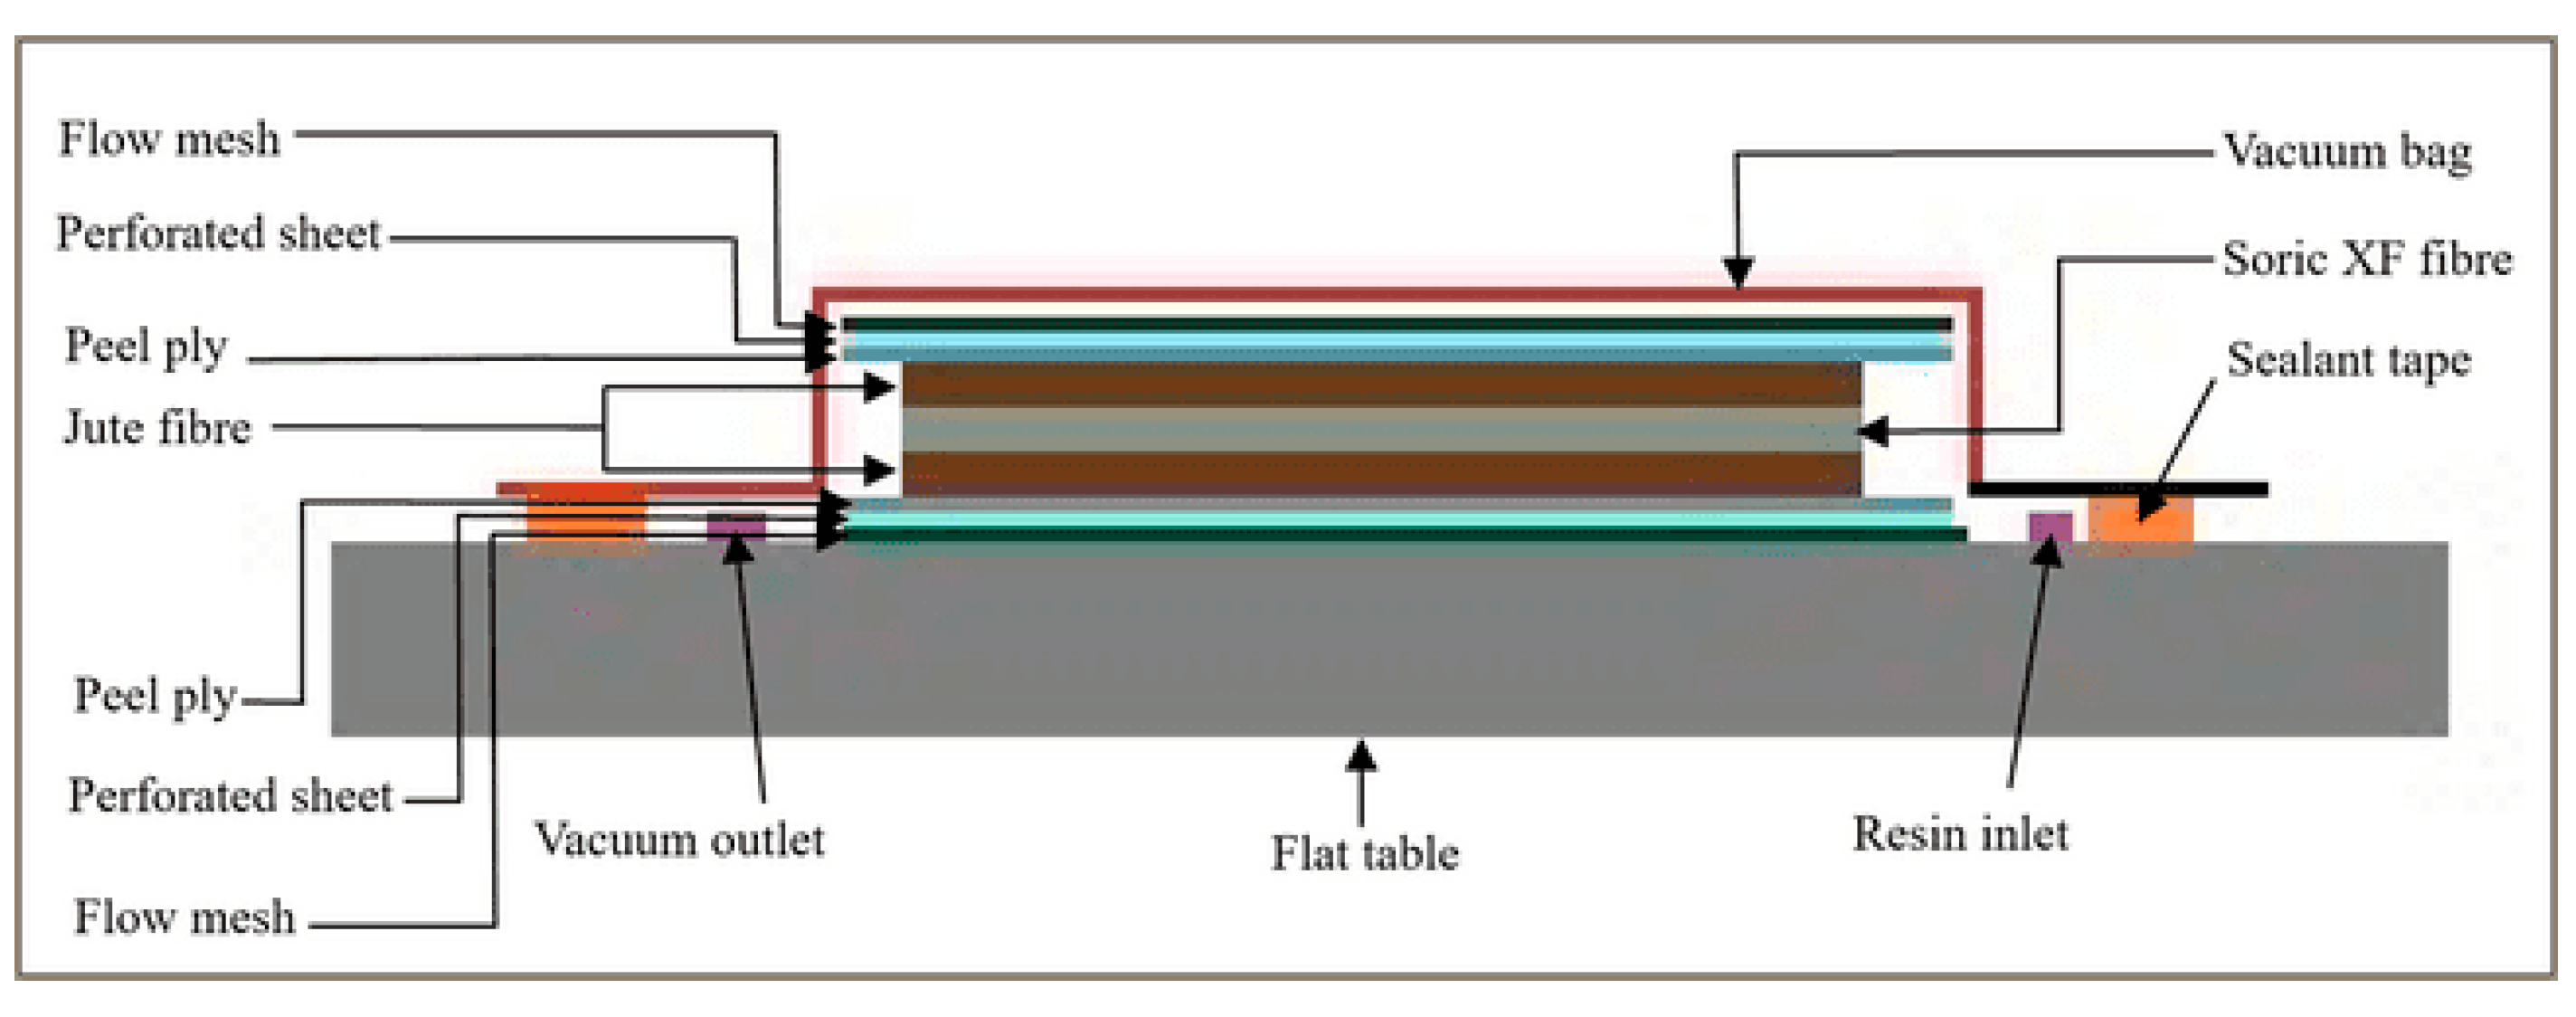
These methods comprise the VARTM process of moulding, the process of de-moulding, and the surface quality check of the created parts. The composite part was made during the fabrication process and extracted during the de-moulding process. The de-moulded component was subjected to the surface treatment process to achieve the final output of the component. The components of the VARTM process are explained in Figure 1. The moulding process begins with applying a release agent to the mould to facilitate easy removal. Next, dry NFRC sandwich composites are placed in dry conditions and are carefully positioned on the mould, ensuring the correct thickness and orientation of the composite portion during stack-up.

Figure 1.
Fibre layers are set up for the VARTM process.
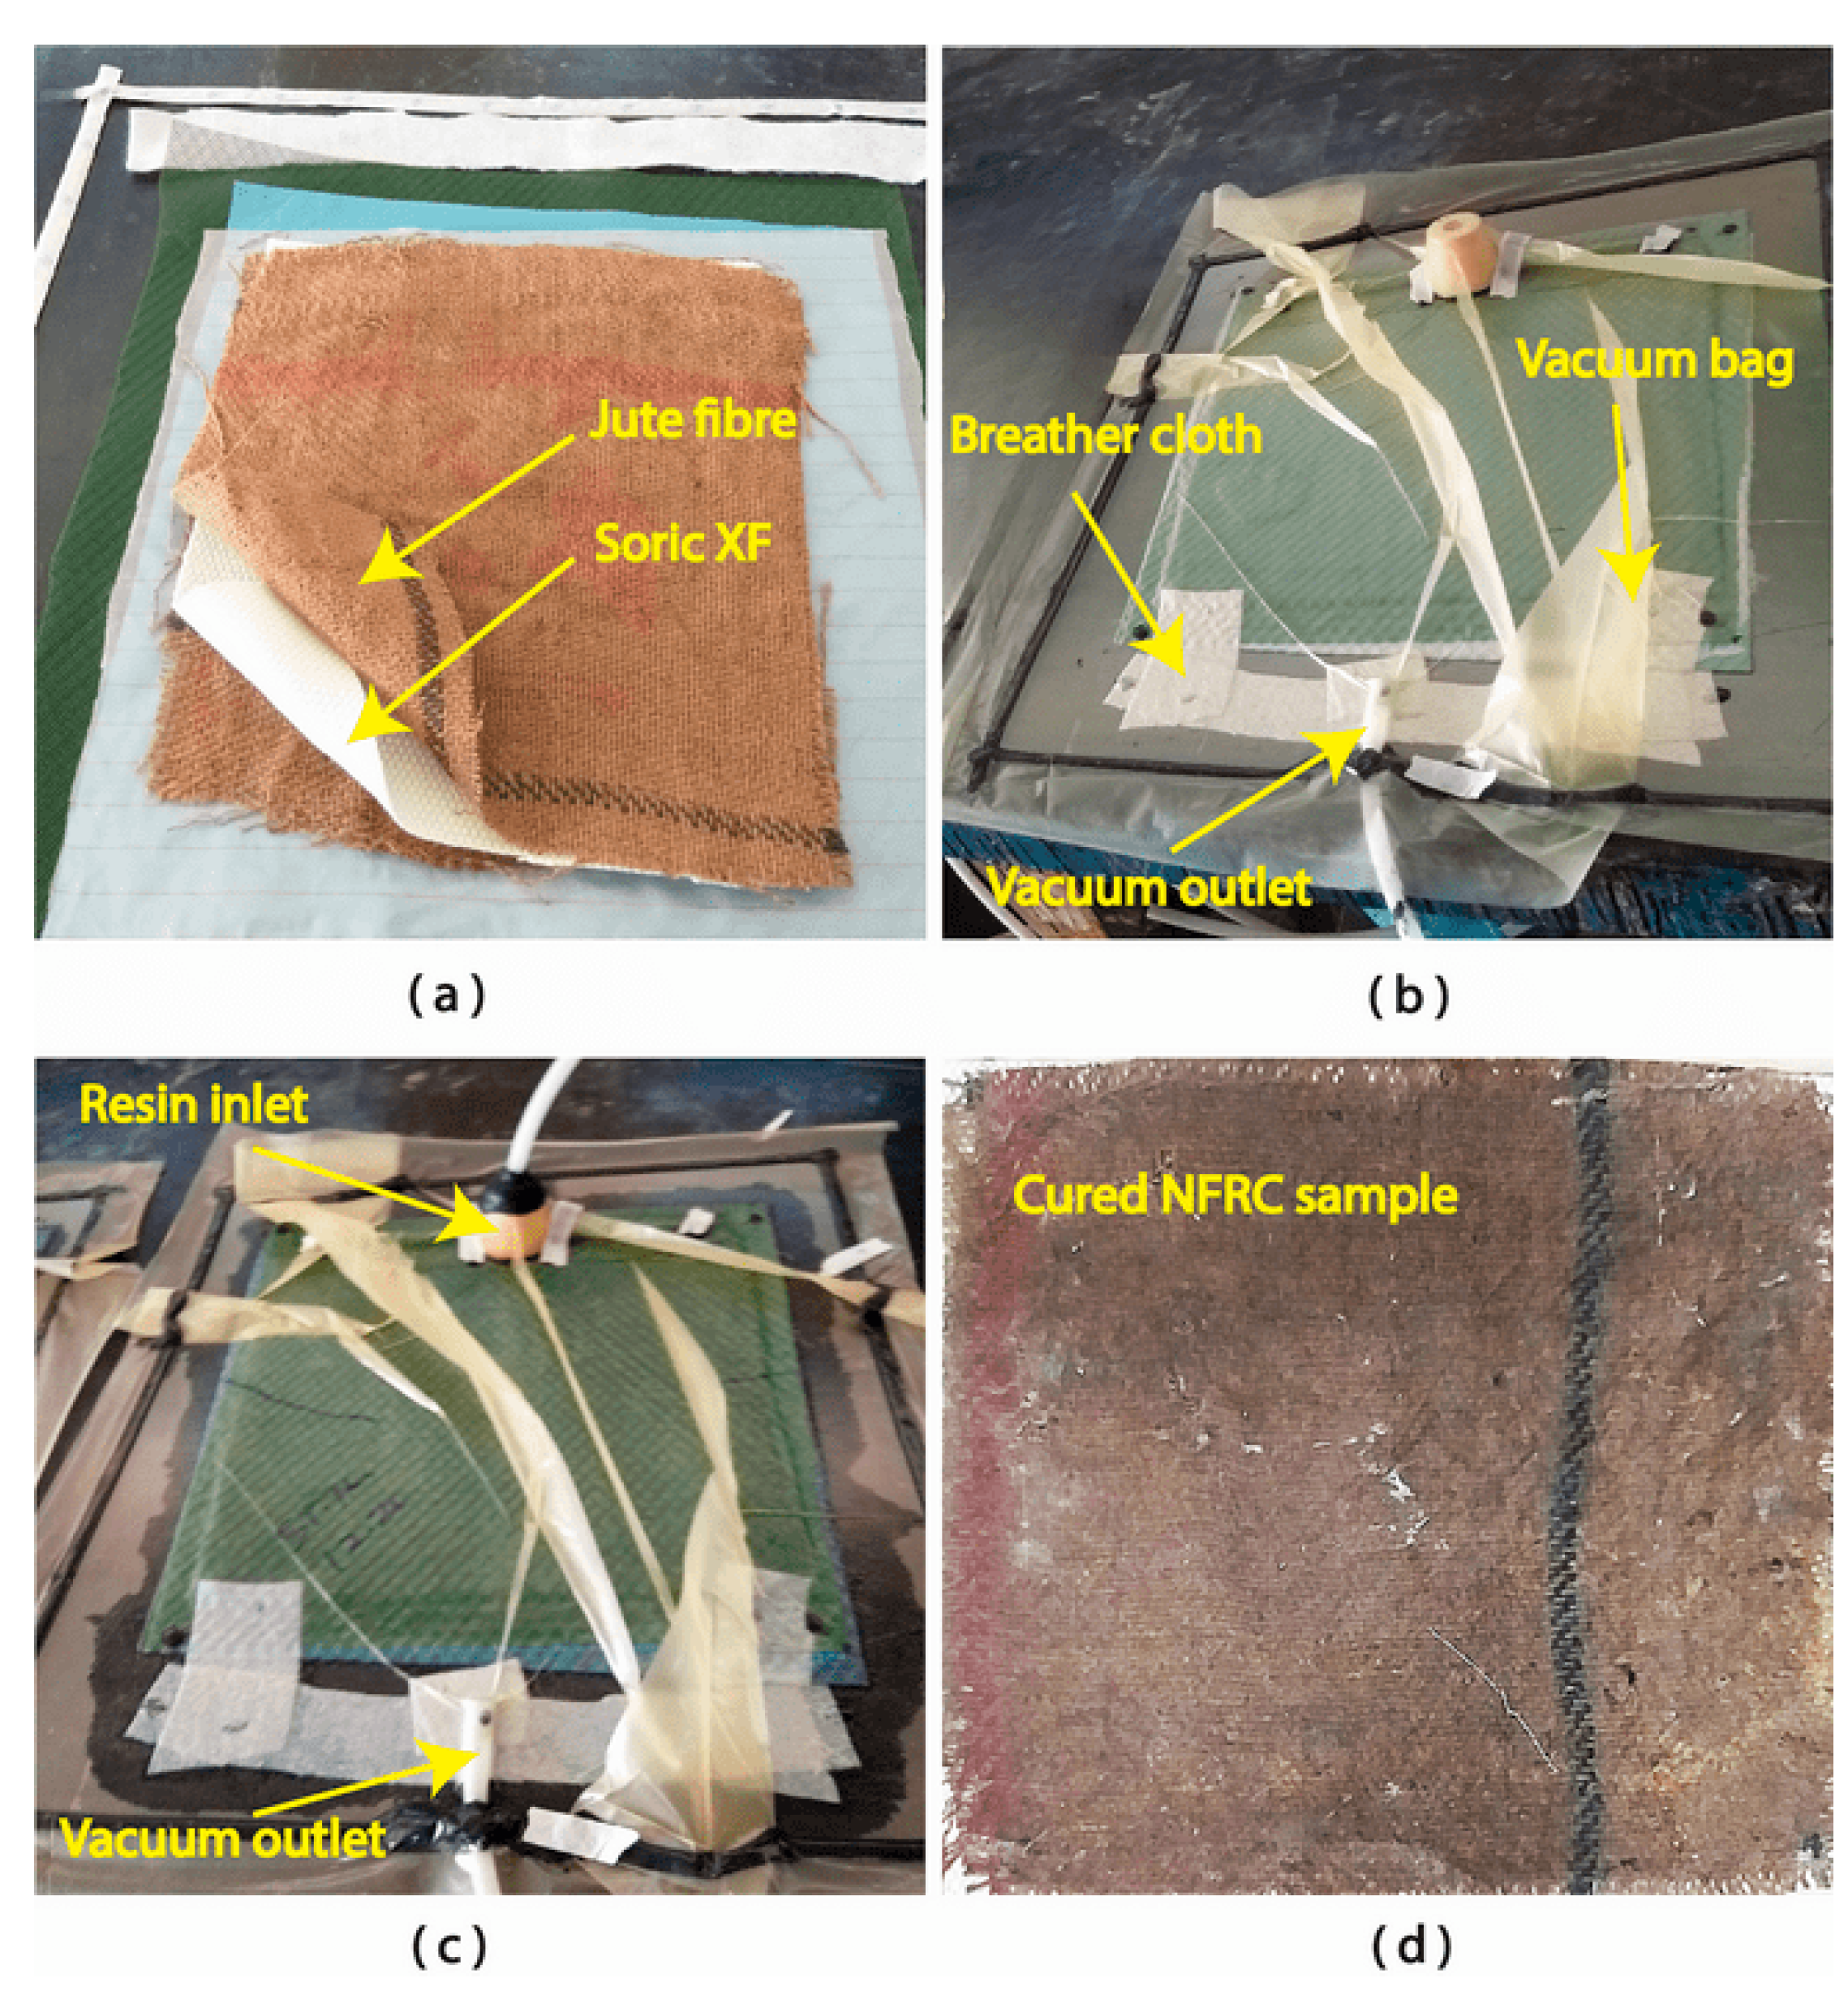
On top of the NFRC sandwich composite, peel ply is applied. Peel ply allows the matrix to permeate through to the dry jute fibre and Soric XF fibre, which are then placed accordingly, as shown in Figure 2a.
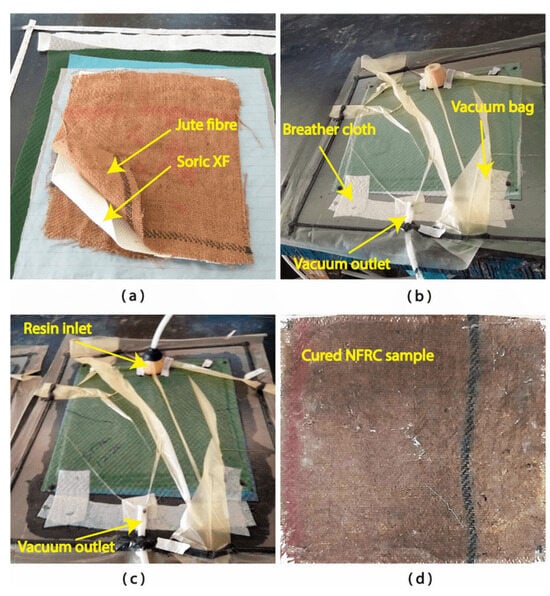
Figure 2.
(a) Dry fibre stack-up; (b) stacker-up layers are kept under vacuum; (c) the sample has been incorporated with a 10:3 mixtures of resin and hardener; (d) de-moulding of the cured sample.
Simultaneously, the perforated sheet and the infusion mesh are positioned above the stacked fibres. The infusion mesh’s function is to provide a flow medium for the VARTM operation. Since the top region of the mould is covered by the infusion spiral, the resin can easily reach the bottom surface. The sealant tape is applied across the mould surface boundary for tight sealing. A vacuum bag completely covers the mould surface, sealing the entire unit. In this instance, one surface end is subjected to the vacuum pump, and the resin inlet positioning is placed on the other end. The whole setup is kept in a vacuum for five minutes, and the sealed airtight sample is subjected to vacuum pressure to prevent any leakage in a vacuum bag, as shown in Figure 2b. The 10:3 ratios of resin and hardener is mixed and inserted into the resin port, which is attached to the inlet. The resin trapper is connected to the suction pump through the vacuum output. After ensuring the airtight setup, the resin fills the experimental setup through the inlet. Due to resin, the dry NFRC fibres (Soric XF and jute) become wet. Here, the infusion mesh facilitates fluid circulation as a permeability medium. Vacuum pressure is kept at that level for a few hours after the resin is distributed across the mould. It follows the period needed for the combination of hardener and resin to solidify, as shown in Figure 2c. After the curing period, the solid plate of the NFRC sample is removed from the mould. It is used to facilitate the removal of the fibre panel component made of composite peel ply. The generated portion is solidified and helps the resin fully cure at room temperature for six hours. Then, the cured NFRC samples are removed from the VARTM setup at a room temperature of 28 ± 30 °C. The fabricated components will have irregular and rough boundary surfaces; equipment for sanding and grinding is employed to give the components a smooth surface finish, as shown in Figure 2d. The cured samples are cut into the desired dimensions using water jet cutting per ASTM standards D638-03 [8,16]; Tensile test. Mohsin Abdullah Al-Shammri Sahar Emad Abdullah: College of Engineering-University of Baghdad, Baghdad Governorate, Iraq, 2017. and D790 [17,18]; Flexural test. K. Venkatesanand, and G. B. Bhaskar: SRM Valliammai Engineering College, Kancheepuram and MIT, Anna University, Chennai India. This is performed for different fibre orientations, such as 0°, 45°, and 90°.
2.3. Numerical Analysis of NFRC by FEA Software
2.3.1. Three-Dimensional Modelling of the ASTM D638-03 and ASTM D790 NFRC Structure
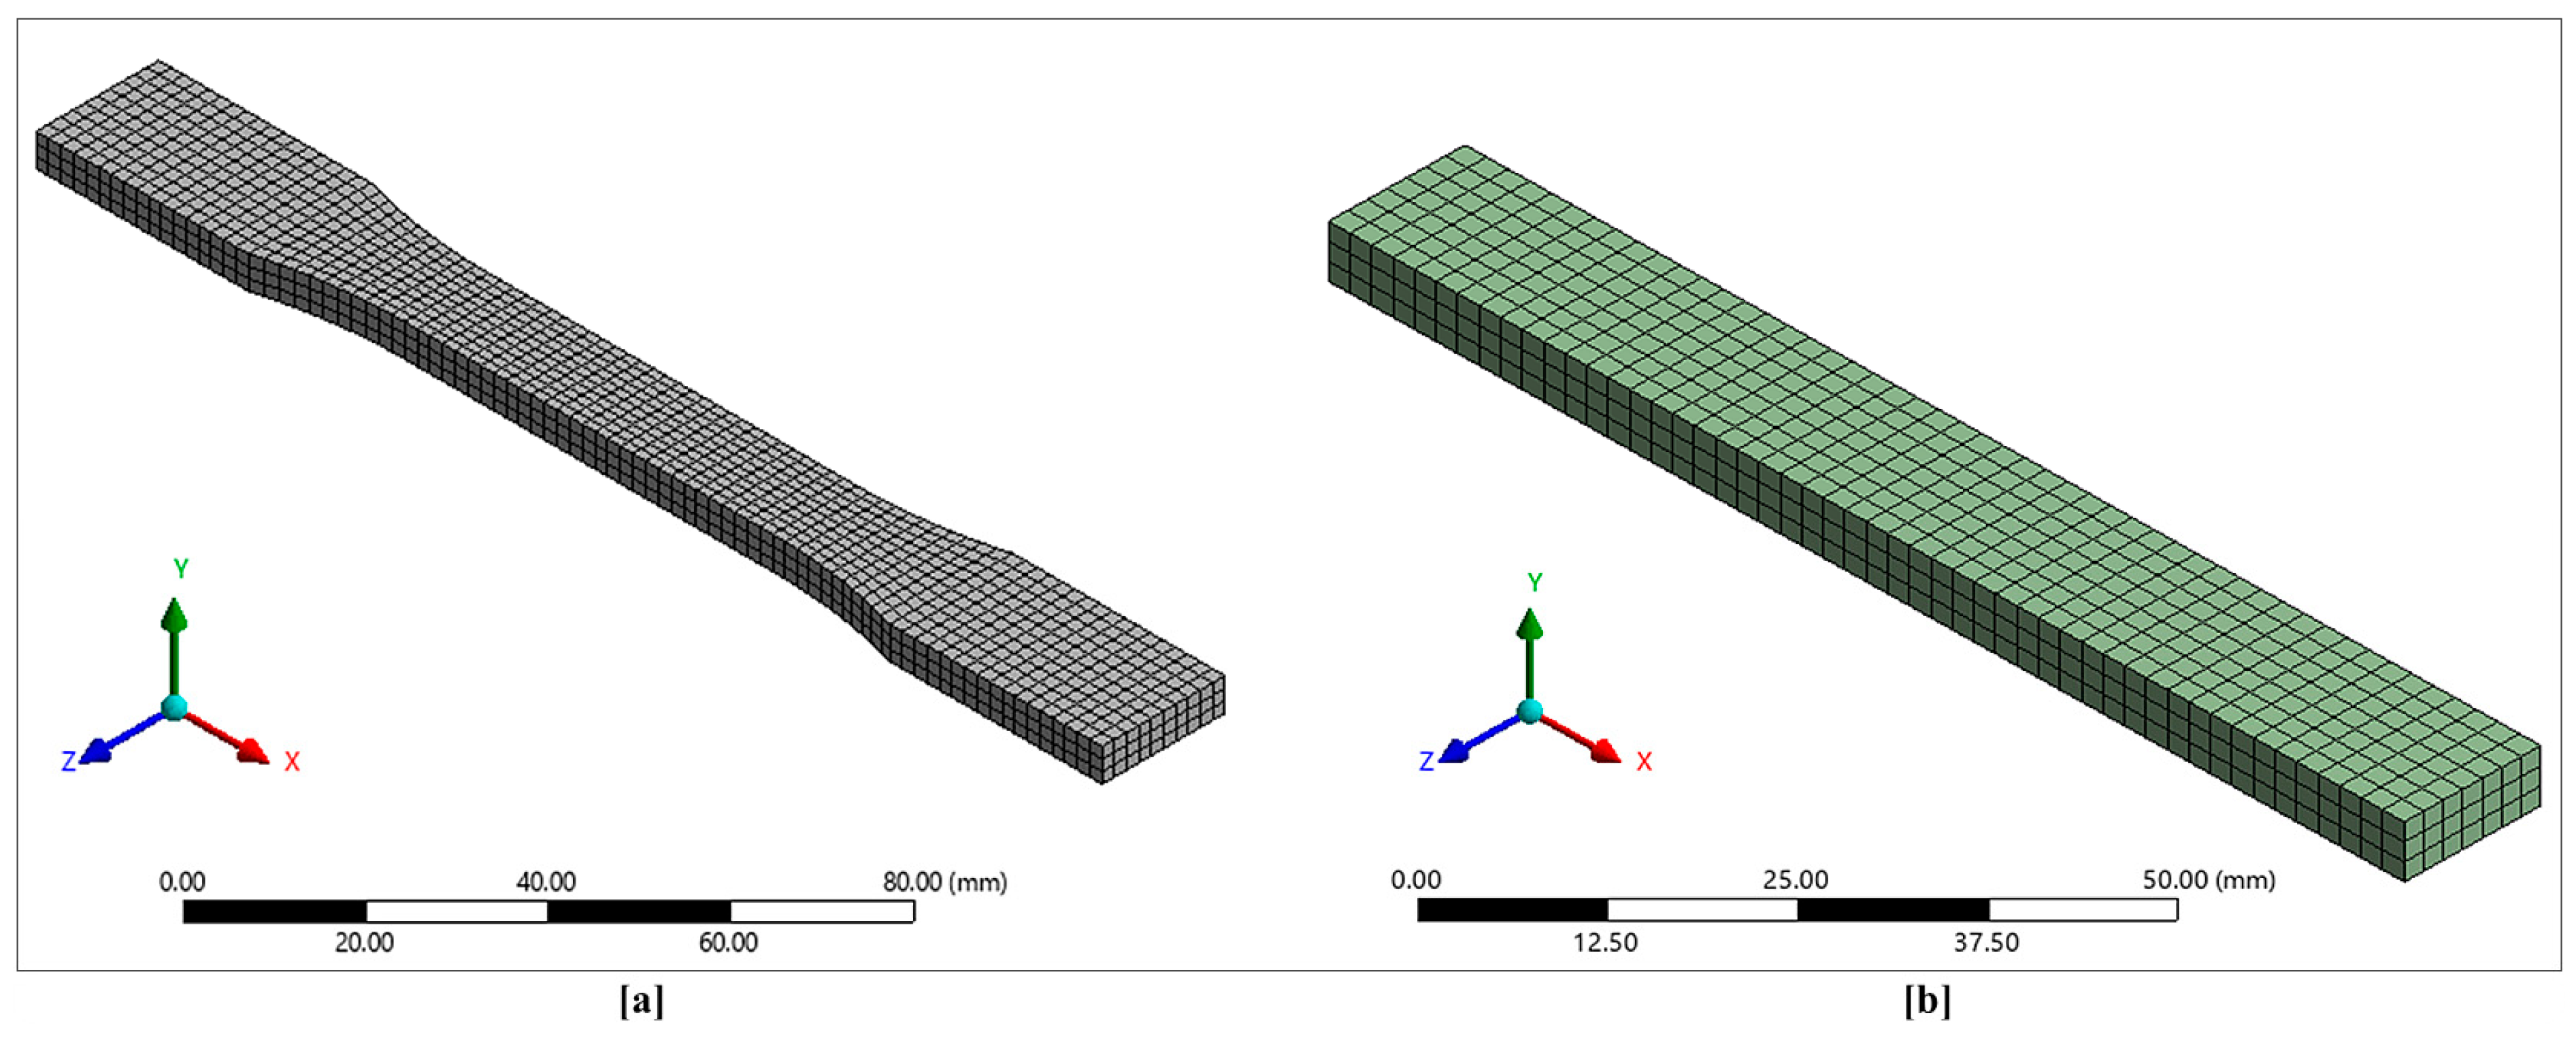
A tensile test is carried out to determine the material’s behaviour under axial loading conditions. The material characteristics under various loads are observed here. For the computational study, a 3D model of the component is designed according to the dimensions provided by ASTM D638-03 [16] standards, as shown in Figure 3a. A flexural test is carried out to determine the material’s behaviour when the component is subjected to a bending force, where we apply the force perpendicular to the surface of the specimen. For the computational simulation, a 3D model of the specimen is modelled as per ASTM D790 [18] standards, as shown in Figure 3b. The Jute fibre thickness is 1 mm, and the Soric core material thickness is 3 mm, thereby bringing the entire thickness of the composite to 5 mm. For the tensile test, three fibre orientations, 0°, 45°, and 90°, are considered as the tensile and flexural properties of the composite material, which vary significantly with the orientation of the fibre. In order to understand the characteristic behavior and reliability of materials can be effectively obtained through the computational analysis especially FEA [19].
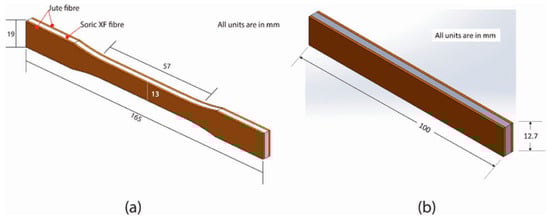
Figure 3.
(a) Three-dimensional model of ASTM D638-03 structure; (b) 3D model of ASTM D790 structure.
The above 3D model of the NFRC composite was imported into FEA software for the study. The ASTM D638-03 material properties assigned to the composite in the FEA software are given in Table 1. The model was meshed [20] which generated 13,802 nodes and 2550 elements (Element size = 2 mm), as shown in Figure 4a. The ASTM D790 3D model of the specimen was imported to the simulation software with a mesh size of 2 mm, which generated 5884 nodes and 1050 elements, as shown in Figure 4b.

Table 1.
Material properties of the structure considered for the computational study.

Figure 4.
(a) Simulated mesh for ASTM D638-03 structure; (b) simulated mesh for ASTM D790 structure.
2.3.2. Boundary Conditions
For the boundary conditions of the tensile test, we apply fixed support to one end of the structure and apply a load at the other end of the structure. This will ensure that the model is under tensile loading conditions [21]. The tensile test is carried out at various load conditions to observe the failure of the composite material. The load at which the material fails is taken as the failure load. For the boundary conditions of the flexural test, we provide two fixed supports, both of which are 20 mm from either end of the structure. The load is applied at the structure’s exact center, and the force’s direction is perpendicular to the surface of the test structure. This arrangement ensures proper flexural deformation of the structure. Failure occurs when the safety factor falls below one, so we apply various load conditions to record the load condition at which the safety factor goes below one.
3. Results and Discussion
3.1. Tensile Test
3.1.1. An Experimental Test of an ASTM D638 Tensile Specimen
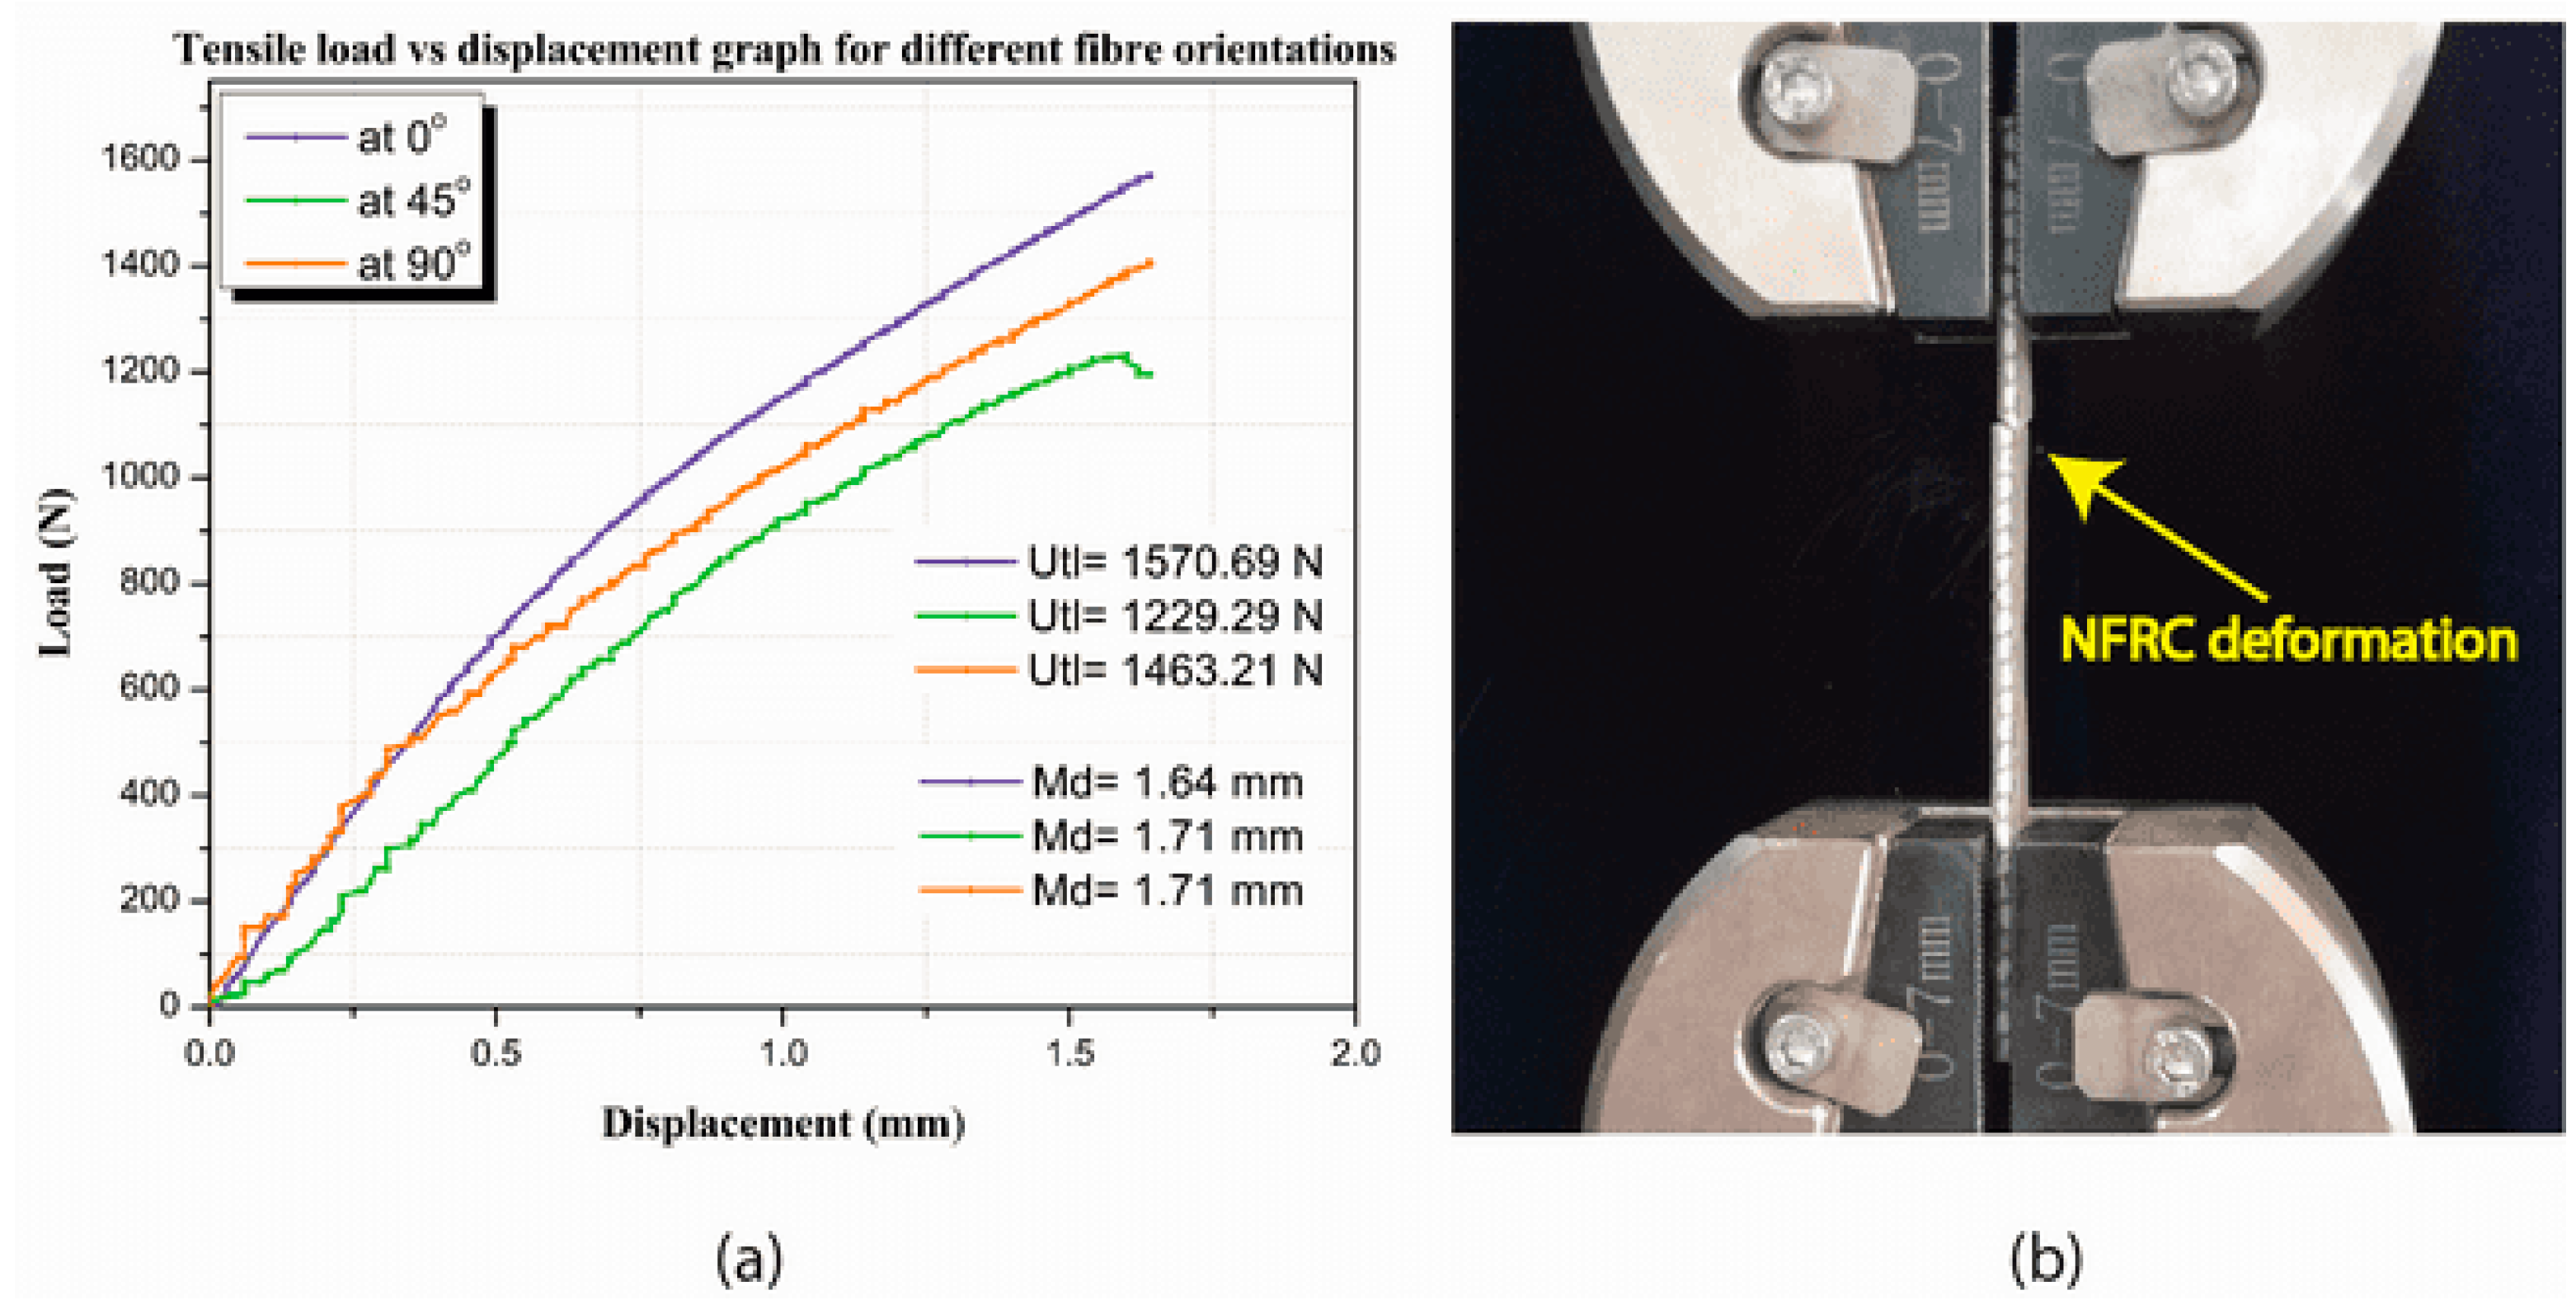
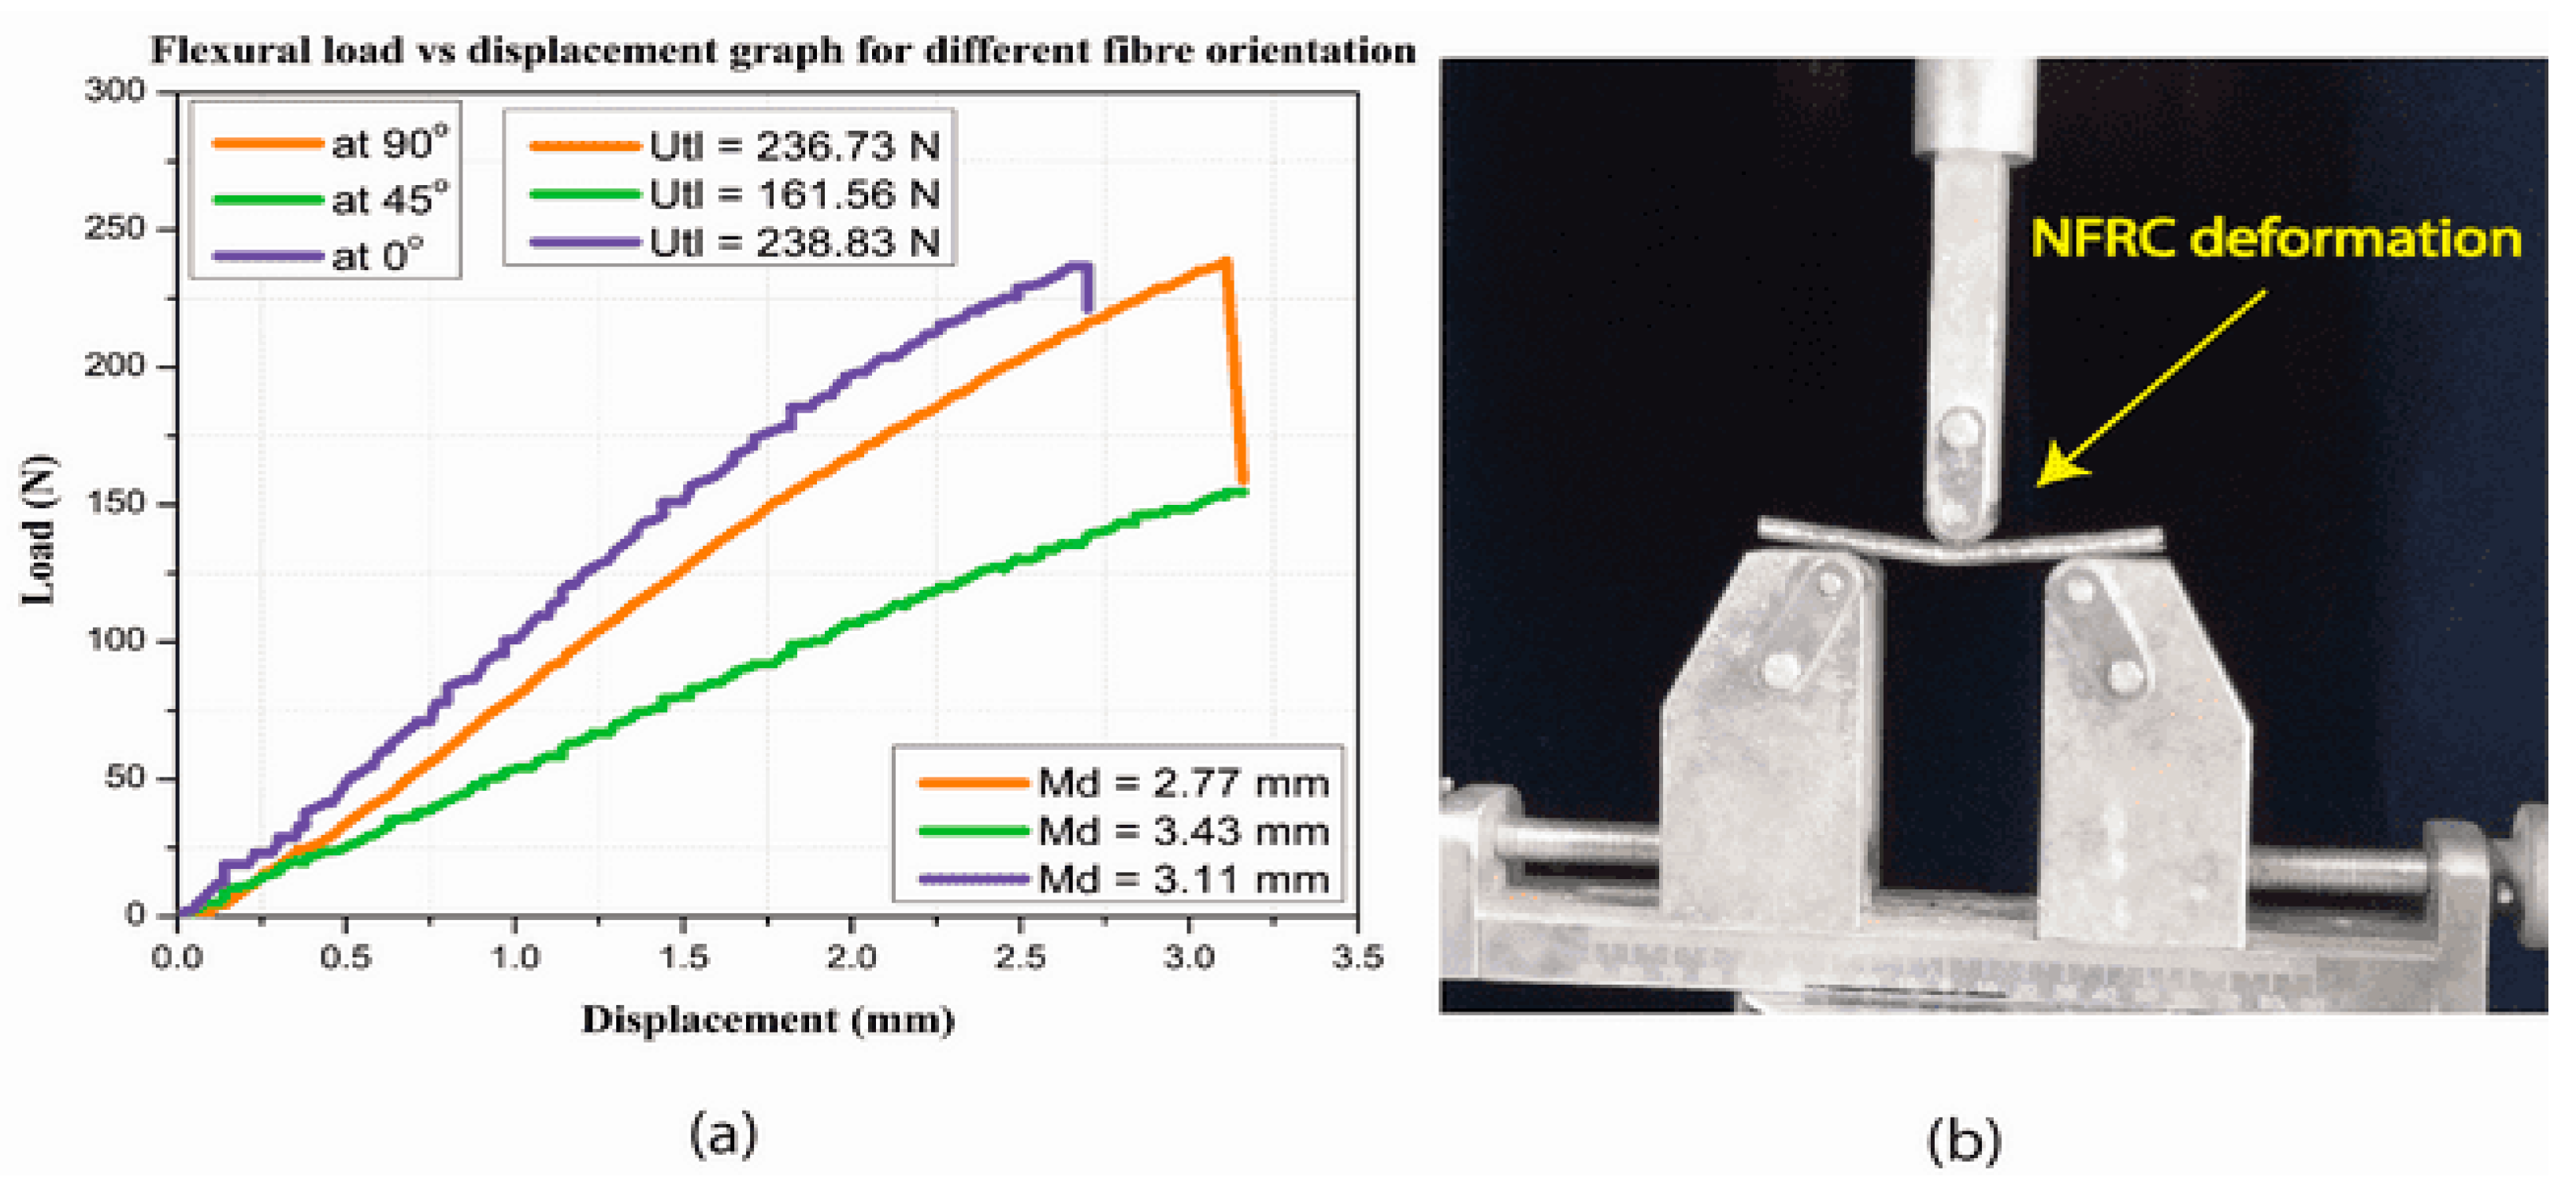
The cured NFRC sandwich structure is cut using water jet cutting to get the exact dimensions for the tensile test according to ASTM standard D638. The pieces were placed vertically in the machine and firmly attached to prevent any slipping during tension [22,23]. Force value and the cross-head speed rate (0.01 mm/min) were recorded until the rupture of the specimen was obtained, as shown in Figure 5b. In Table 2 the tensile testing was conducted on NFRC sandwich laminate with 0°, 45°, and 90° fibre orientations. The NFRC sandwich laminate with 0° fibre orientation had the greatest tensile strength, measuring 23.91 MPa, with a maximum ultimate tensile load measuring about 1570.69 N and a maximum displacement in tensile properties of 1.64 mm. The laminate with 90° fibre orientation displayed the average flexural strength, measuring 19.41 MPa, with a maximum ultimate tensile load measuring about 1463.21 N and a maximum displacement in tensile properties of 1.71 mm, and the laminate with 45° fibre orientation had the lowest tensile strength, measuring 18.31 MPa, with a maximum ultimate tensile load measuring about 1229.29 N and a maximum displacement in tensile properties of 1.71 mm, as shown in Figure 5a.

Figure 5.
(a) A load vs. displacement graph of the tensile test; (b) deformation of the NFRC during tensile test.
Table 2.
Tensile characteristics of the NFSC sandwich composite with different fibre orientations.
3.1.2. A Computational Test of an ASTM D638-03 Tensile Structure
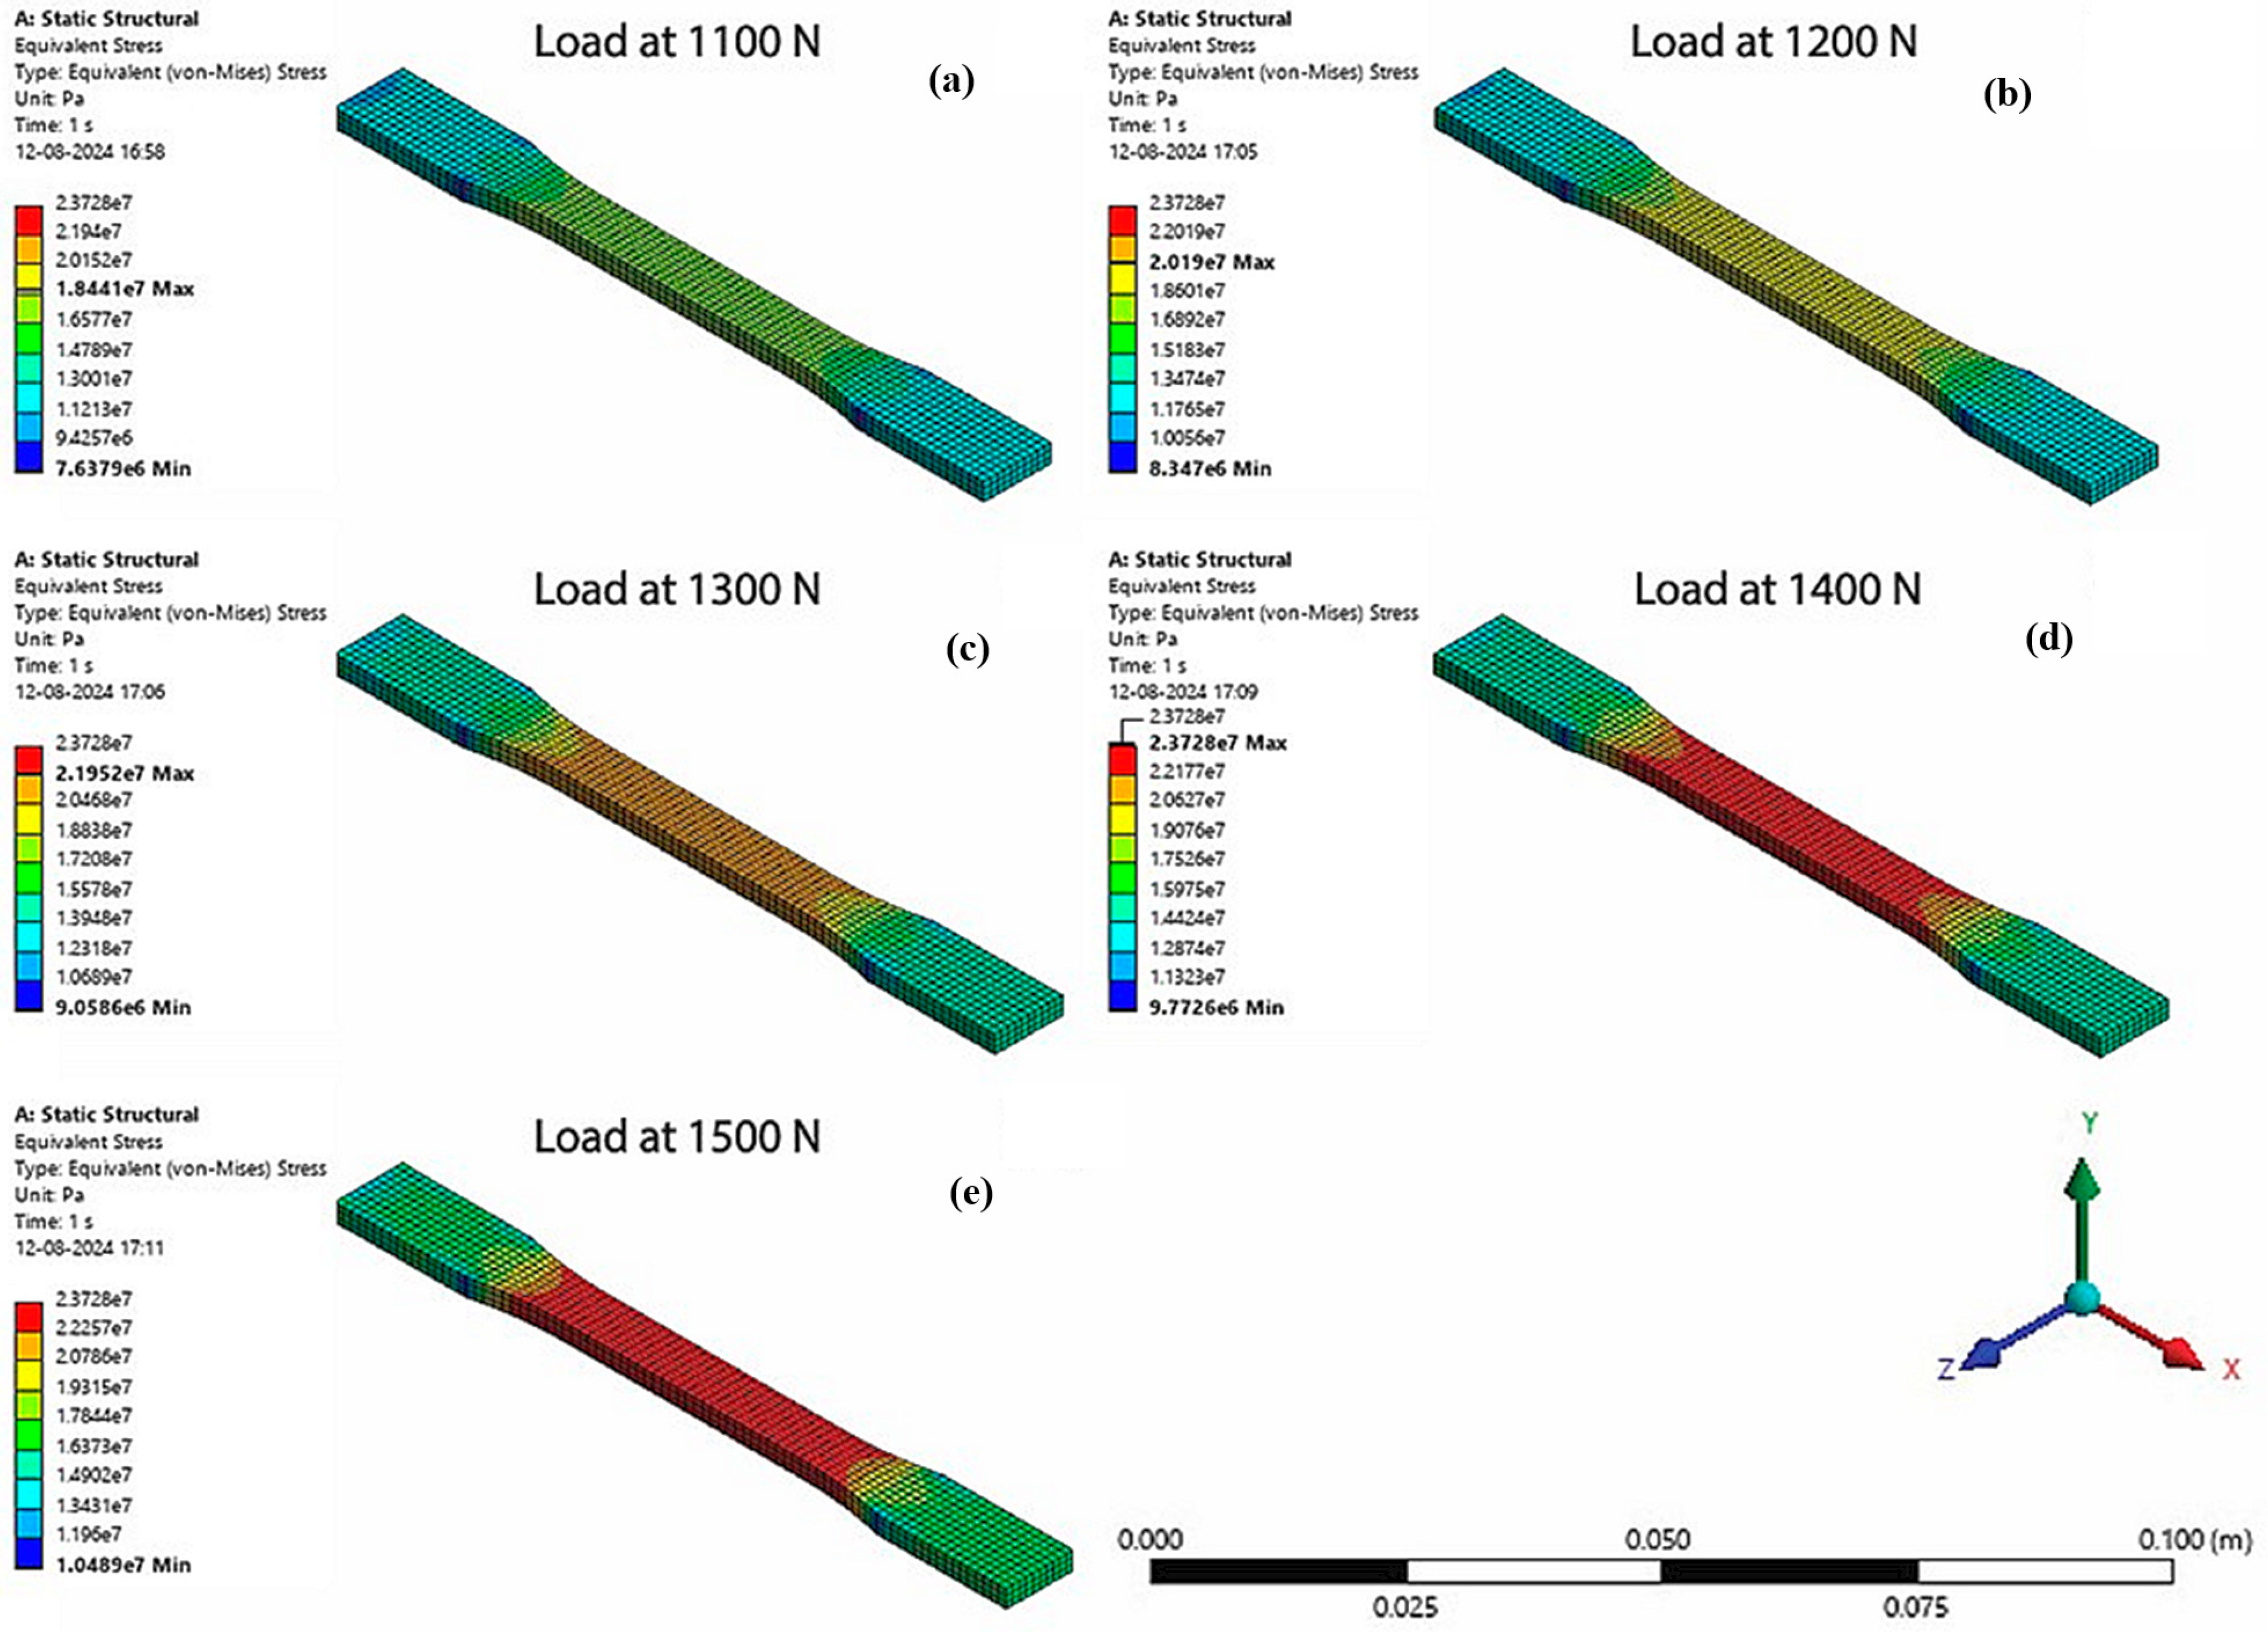
The structural analysis is carried out to determine the material’s structural properties. The tensile properties of the jute–Soric NFRC were computationally identified. These properties provide insight into the material’s performance under various operating conditions; for the sandwich layer composite of 0°, 45°, and 90° fibre orientations, stress and deformation were analysed to calculate the von Mises stress and deformation developed in the specimen. Five different loads were applied for this study (1100 N, 1200 N, 1300 N, 1400 N, and 1500 N). The tensile test results for 0° fibre orientation are tabulated as shown in Table 3.
Table 3.
Results of computational tensile test of a 0° fibre orientation sandwich layer composite.
From Figure 6, we can observe that the maximum stress occurs in the middle region of the specimen. From Table 3, it is noted that as the force being applied rises from 1100 N to 1500 N, the specimen’s maximum deformation increases from 15.09 mm to 21.267 mm, demonstrating a substantial rise in structural deformation. The deformation along the gauge length increases continuously with increasing load, beginning at 10.663 mm under 1100 N and ending at 15.052 mm under 1500 N. The minimum von Mises stress likewise increases with the load, rising from 7.6379 MPa at 1100 N to 10.489 MPa at 1500 N, indicating that the material endures more stress as the load increases. The maximum von Mises stress measured in the specimen ranges from 18.441 MPa at 1100 N to 25.517 MPa at 1500 N, indicating a higher probability of material failure at higher loads. The safety factor decreases from 1.2966 at 1100 N to 0.93704 at 1500 N, indicating that as the load increases, the specimen approaches and eventually goes below the threshold for safe operation, with values less than 1 indicating possible failure. The specimen maintains within a safe operating range for loads up to 1400 N, specified by a safety factor of 1.0077.
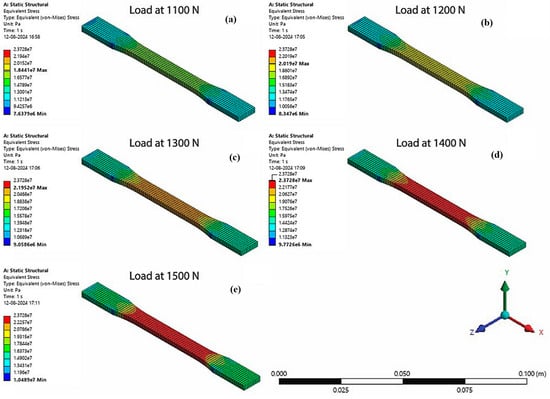
Figure 6.
Stress analysis results of the tensile test for 0° fibre orientation at (a) 1100 N, (b) 1200 N, (c) 1300 N, (d) 1400 N, and (e) 1500 N.
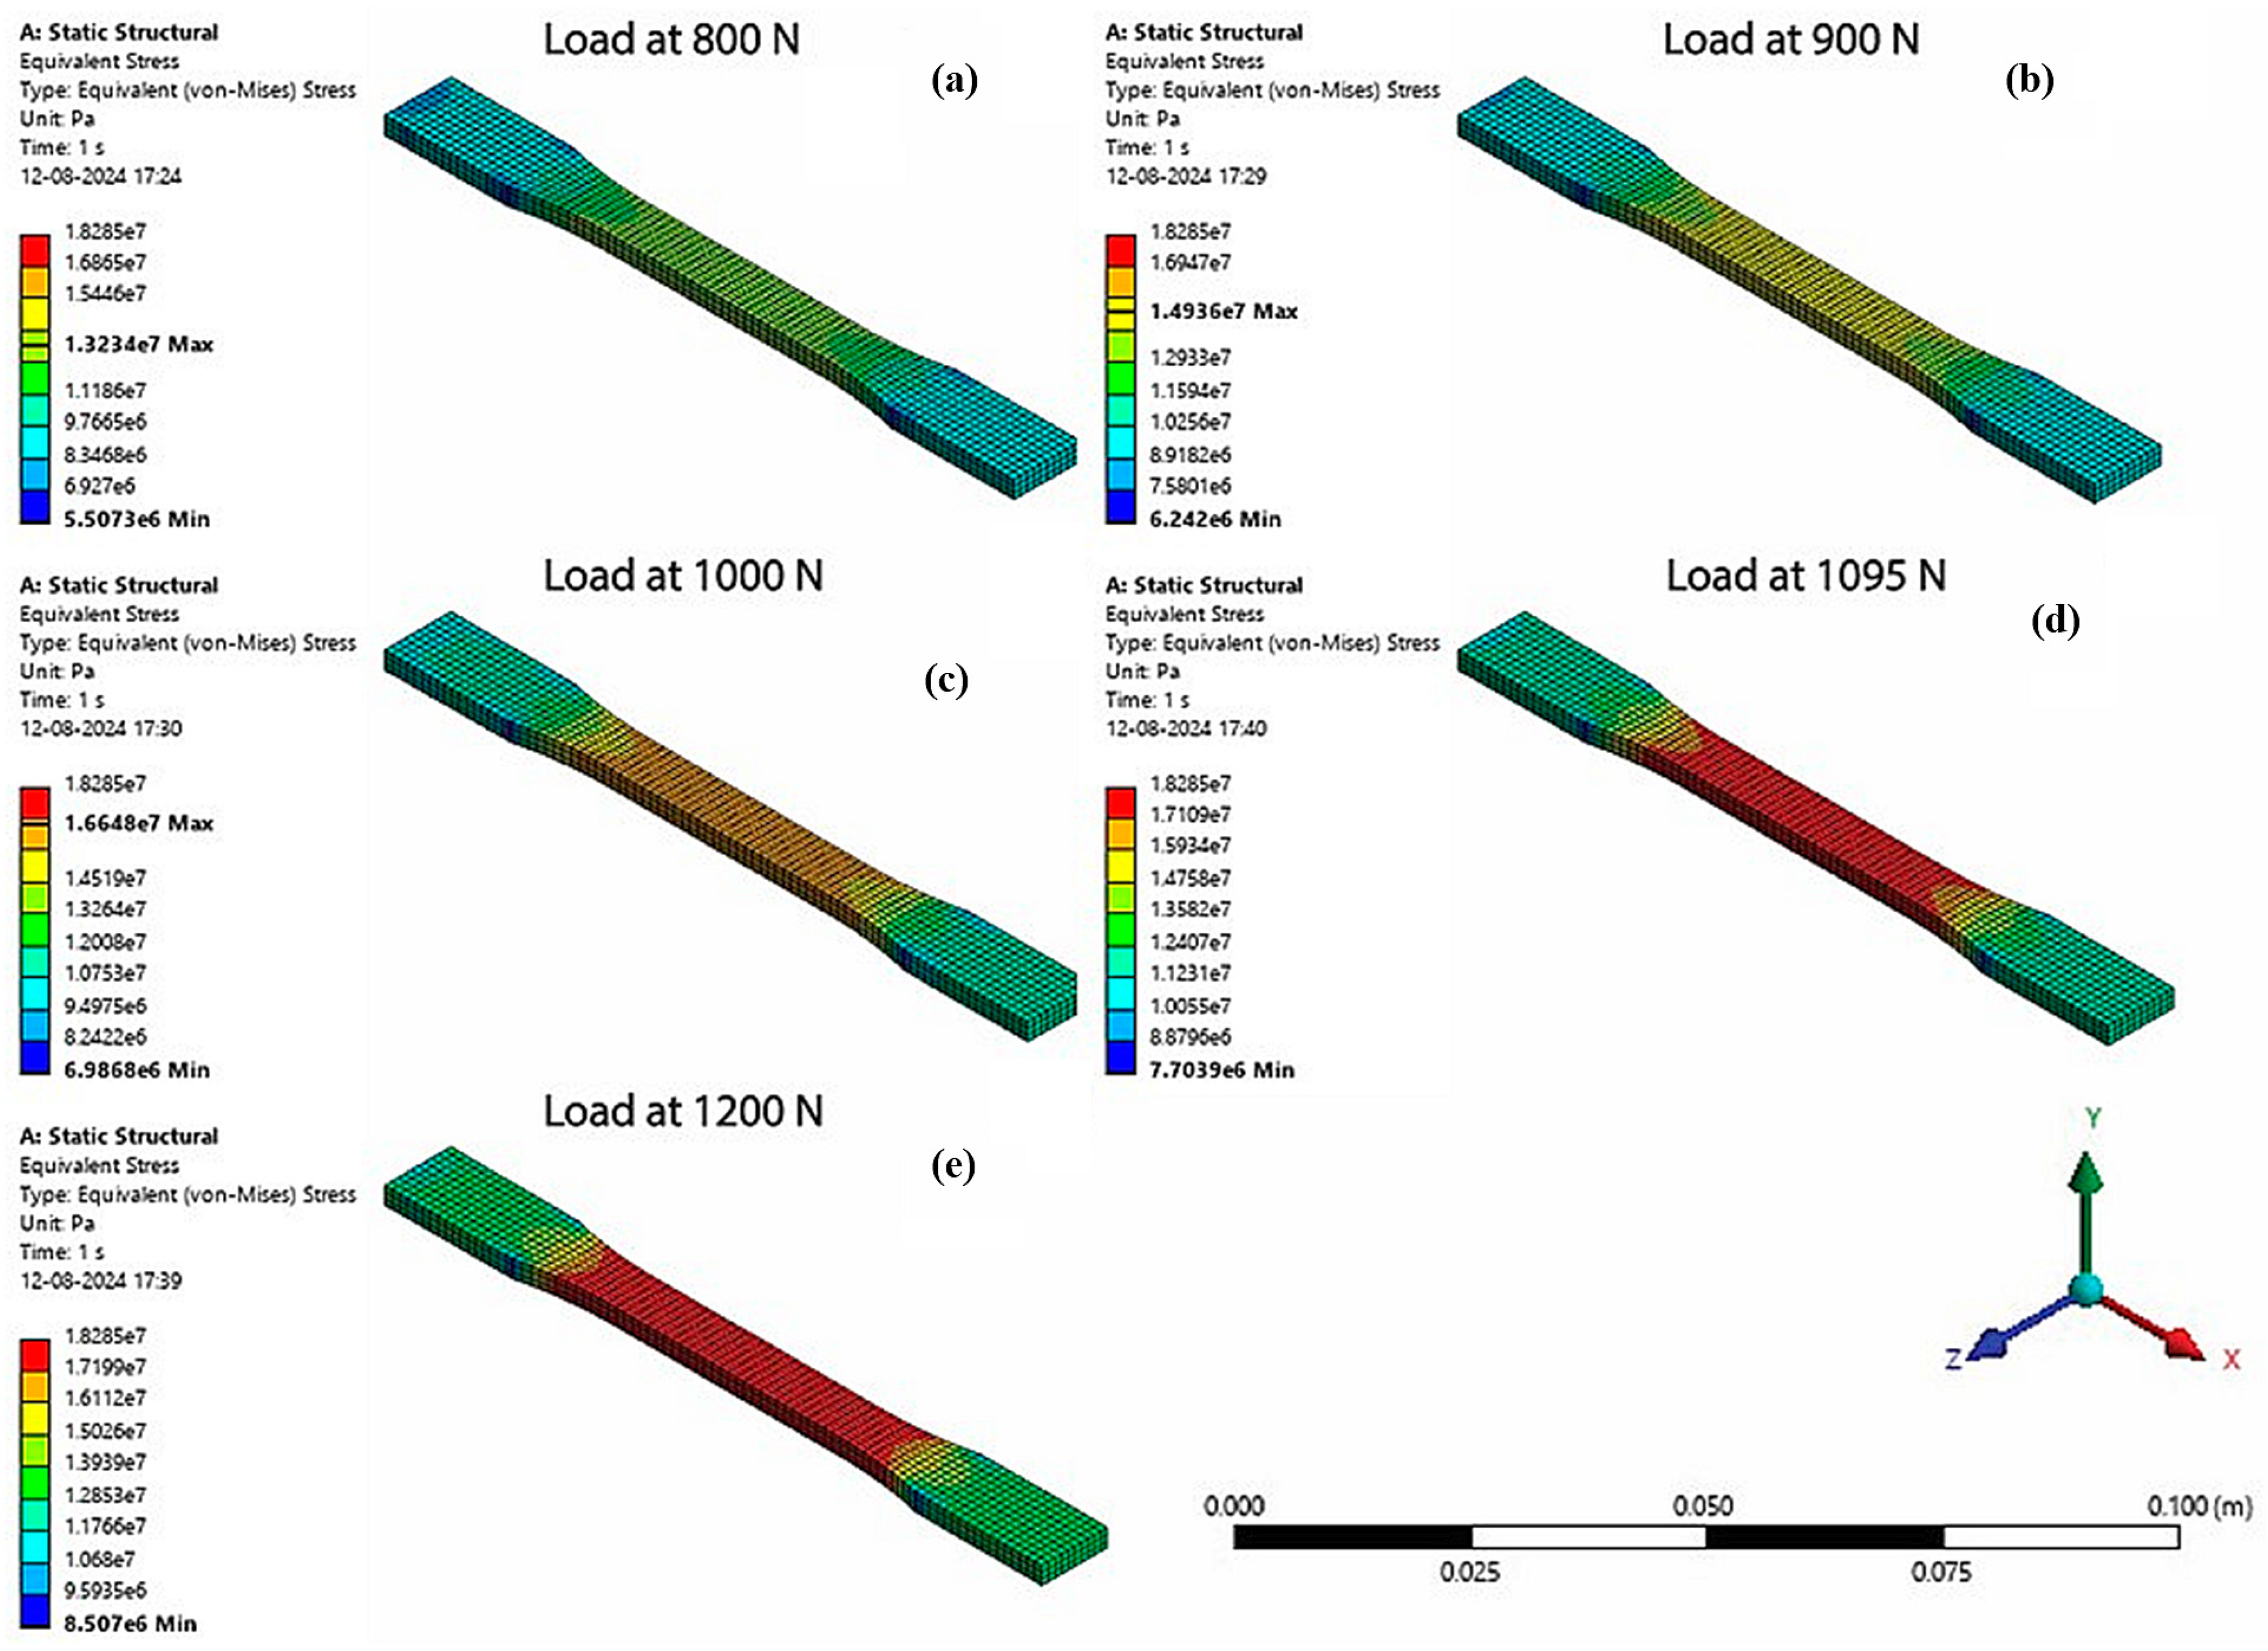
From Figure 7, we can observe that the maximum von Mises stress is generated along the gauge length region of the specimen. From Table 4, we observe that the maximum deformation gradually rises from 14.13 mm at 800 N to 21.992 mm at 1200 N, indicating the specimen’s progressive deformation as the load increases. The deformation over the gauge length follows a similar pattern, beginning at 9.9792 mm at 800 N and reaching 15.559 mm at 1200 N, suggesting a steady rise in elongation. The lowest von Mises stress increases from 5.5073 MPa at 800 N to 8.507 MPa at 1200 N. The maximum von Mises stress increases from 13.234 MPa at 800 N to 20.105 MPa at 1200 N, indicating that the material approaches its stress limits more closely as the load increases. The safety factor drops dramatically from 1.3835 at 800 N to 0.9107 at 1200 N, indicating a smaller margin of safety. At 1200 N, the safety factor falls below one, indicating that the specimen is no longer working safely and is prone to failure. The specimen can withstand loads of up to 1095 N with a safety factor of 1.0014. However, at 1200 N, the safety factor of 0.9107 indicates that the specimen fails under the given load.
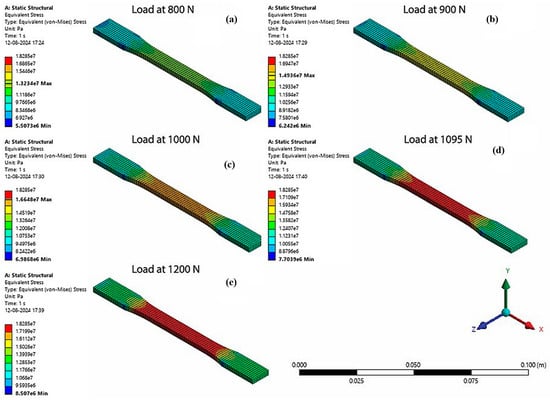
Figure 7.
Stress analysis results of the tensile test for 45° fibre orientation at (a) 1100 N, (b) 1200 N, (c) 1300 N, (d) 1400 N, and (e) 1500 N.
Table 4.
Results of the computational tensile test of a 45° fibre orientation sandwich layer composite.
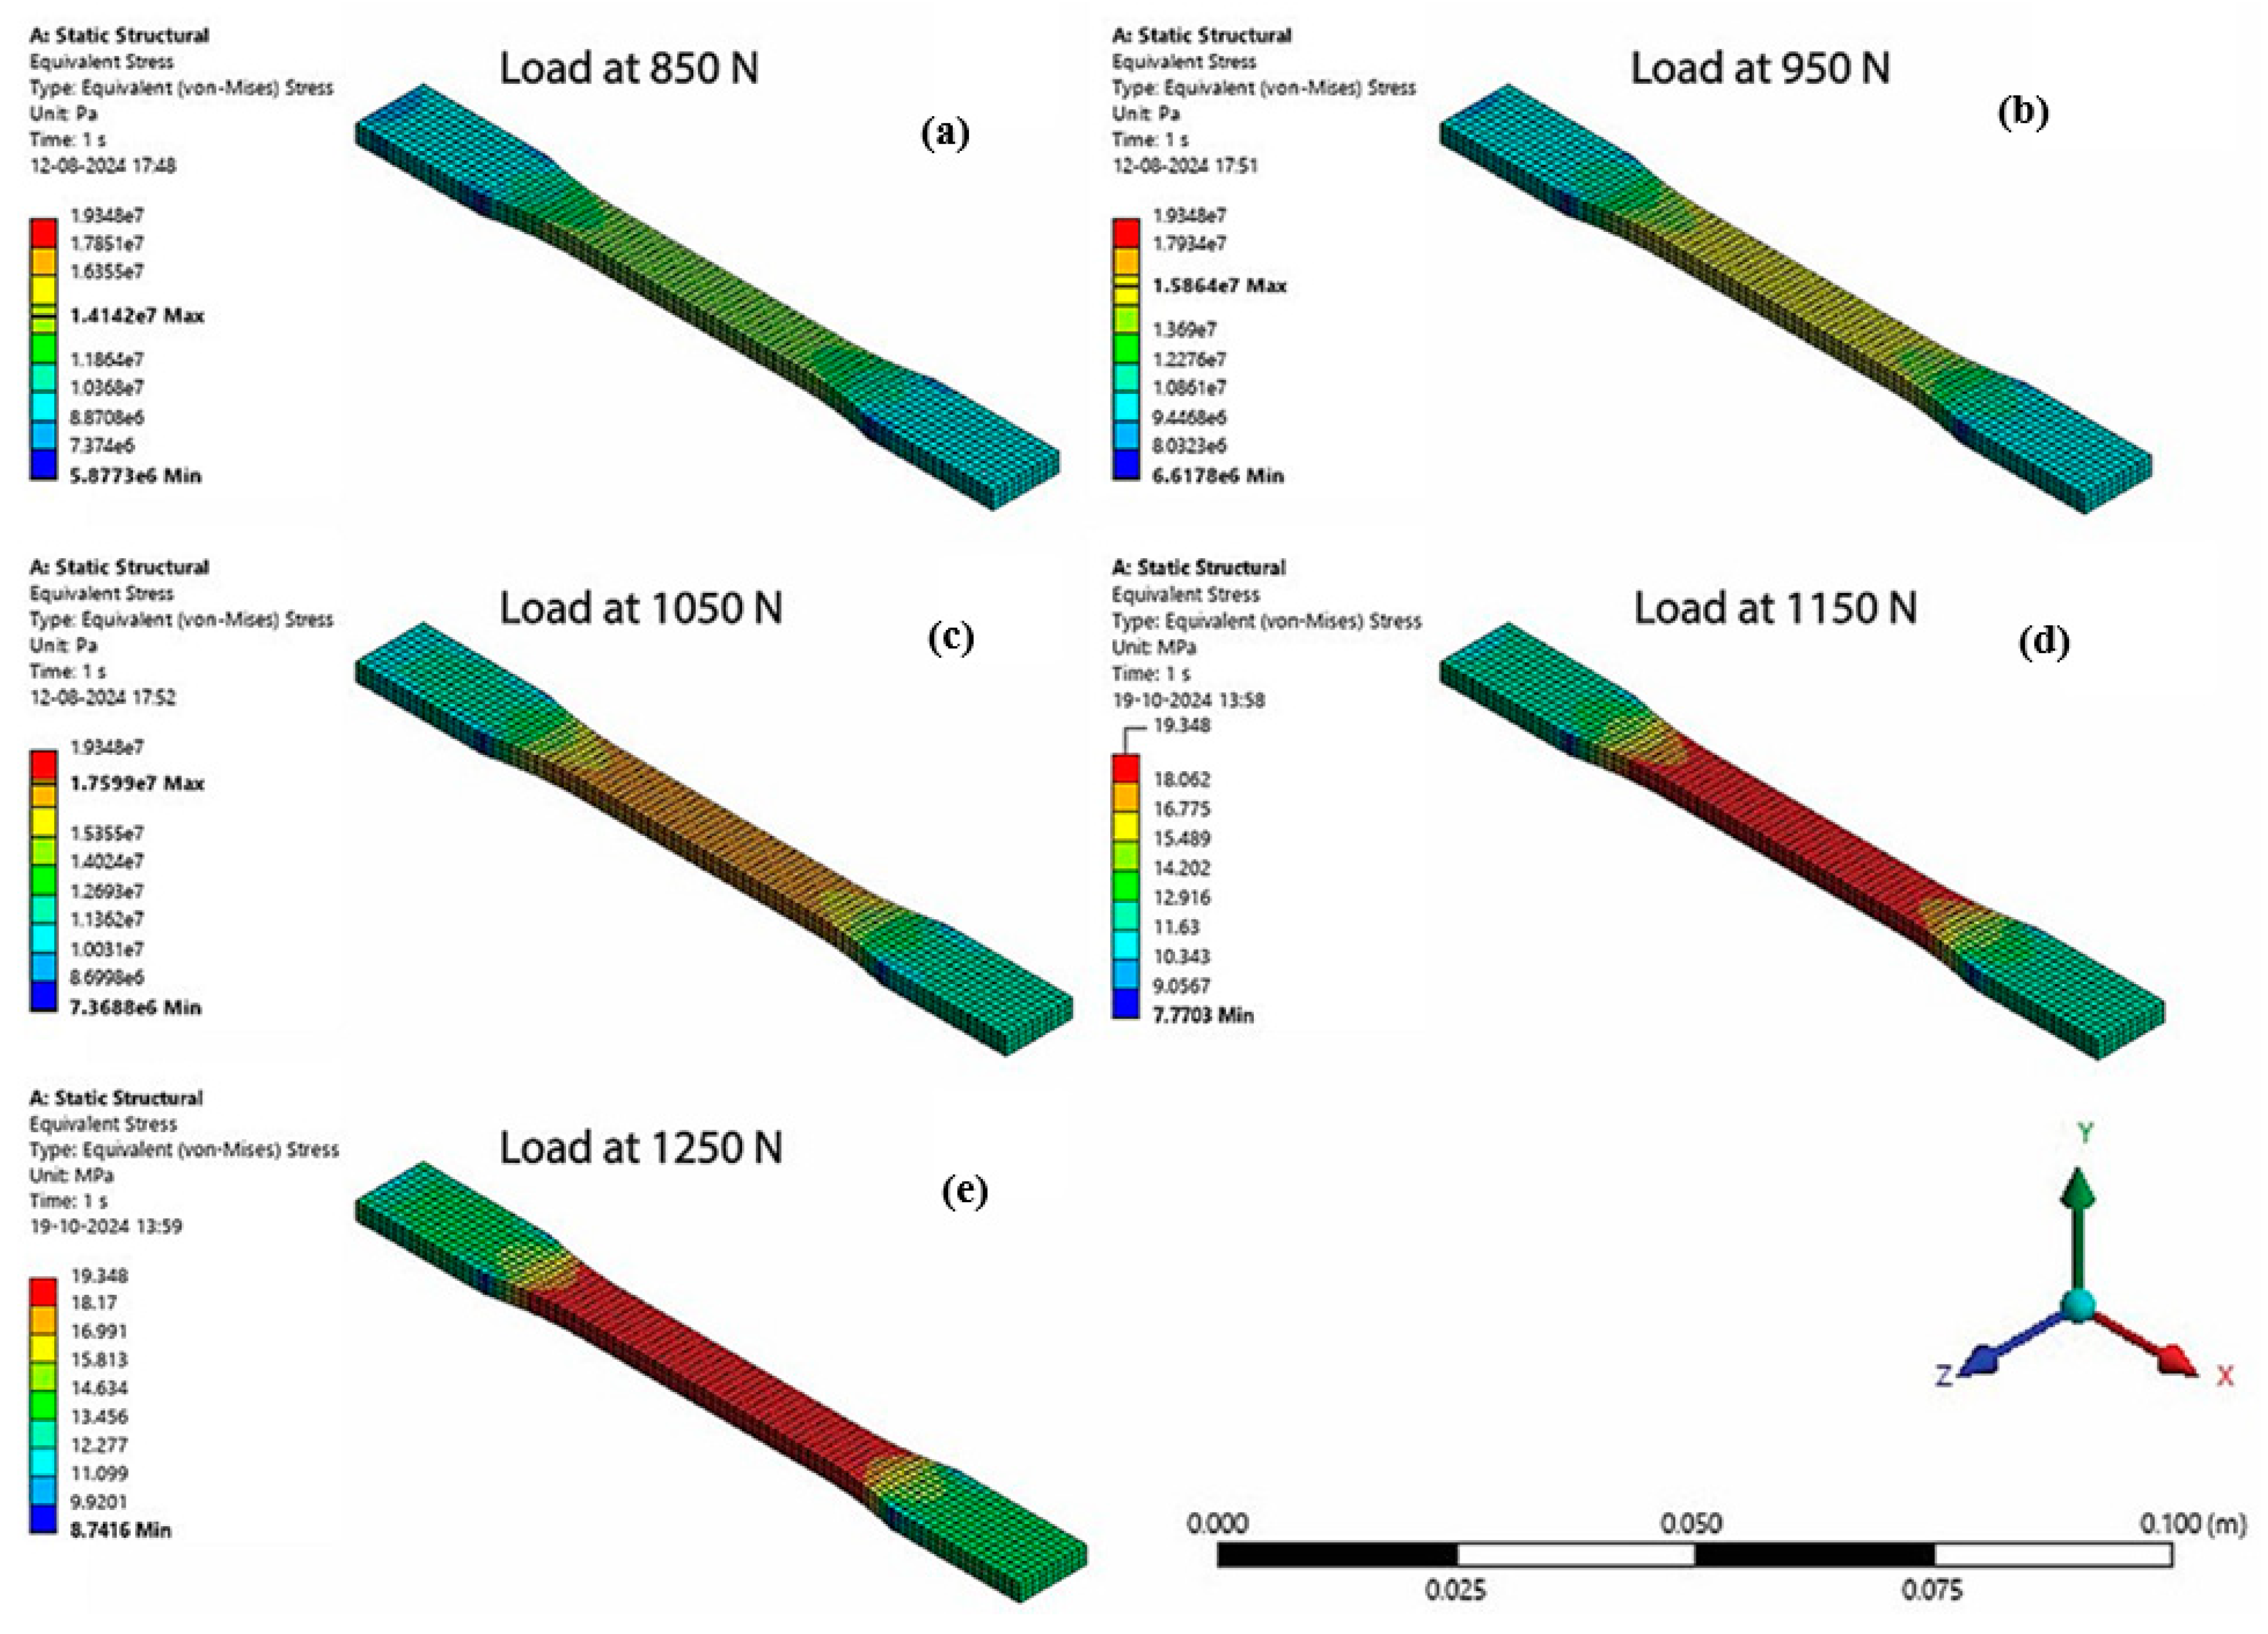
In Figure 8, the maximum deformation observed in the structure increases gradually, commencing at 14.233 mm for an 850 N load and expanding to 20.965 mm at 1350 N, illustrating the material’s greater susceptibility to tensile loading. The deformation along the gauge length follows a distinct upward trend, beginning at 10.054 mm with an 850 N load and increasing to 14.759 mm at 1350 N, demonstrating higher elongation as the applied load increases. With increasing loads, the material appears to be getting closer to its stress limit, as seen by the maximum von Mises stress increasing from 14.142 MPa at 850 N to 21.792 MPa at 1350 N. As the load increases, the safety factor significantly decreases, going from a comparatively safe 1.3726 at 850 N to only 0.8907 at 1350 N. With a factor of 1.002, this reduction shows that the structure stays within acceptable bounds until about 1200 N, at which point it enters an unsafe range, suggesting possible structural failure. A safety factor of roughly 1.002 indicates that the structure functions on the border of safety for loads up to 1200 N. However, the safety factor drops to 0.8907 at 1350 N, which denotes complete structural failure, as shown in Table 5.
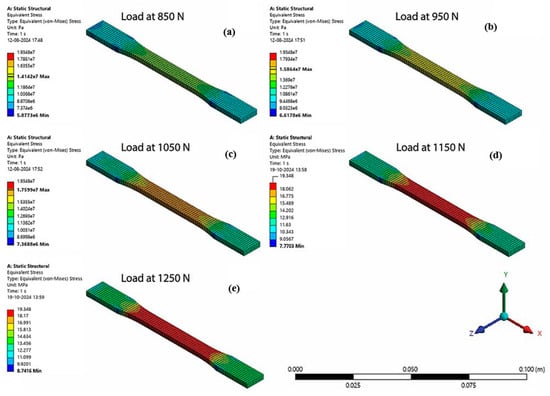
Figure 8.
Stress analysis results of the tensile test for 90° fibre orientation at (a) 1100 N, (b) 1200 N, (c) 1300 N, (d) 1400 N, and (e) 1500 N.
Table 5.
Results of the computational tensile test of a 90° fibre orientation sandwich layer composite.
3.1.3. Comparative Results of the Experimental and Computational Test on an ASTM D638-03 Tensile Structure
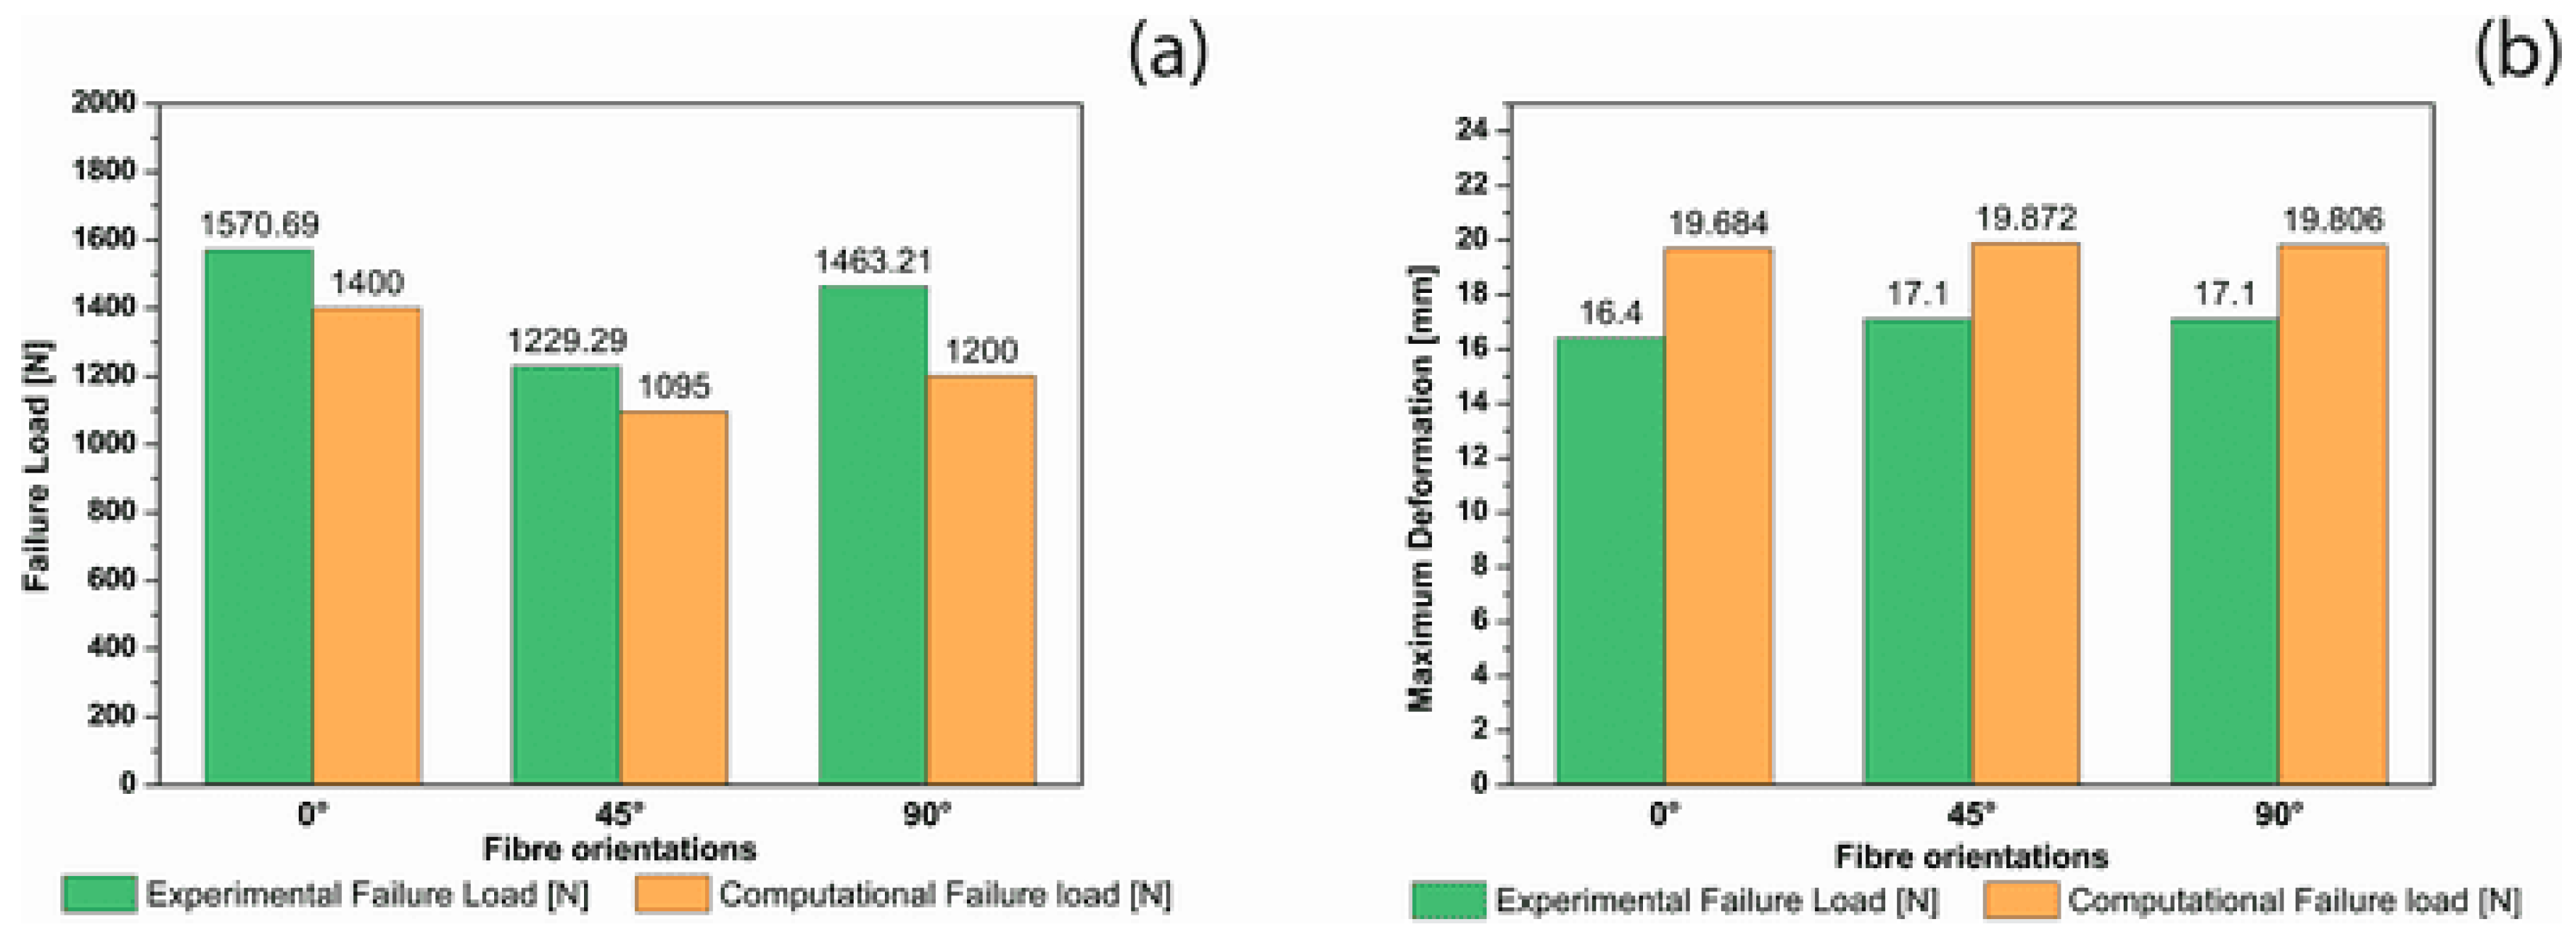
Figure 9a compares failure loads between the experimental and computational results for each fibre orientation. For 0° fibre orientation, we can see that the experimental results show the failure load as 1570.69 N, whereas the computational results show 1400 N, indicating a variation of 12.19%. For 45° fibre orientation, we can see a variation of 12.26%; for 90° fibre orientation, we can see a variation of 21.93%. These variations are due to the assumption of homogeneity of the material by the computational model, whereas, in experimental conditions, there may be defects in the composite material. Figure 9b shows the comparative study of maximum deformation developed in the material between the experimental and computational results with different fibre orientations. For 0° fibre composite, we can see a variation of 16.68%. Similarly, for 45° and 90° orientations, we see variations of 13.95% and 13.66%, respectively.
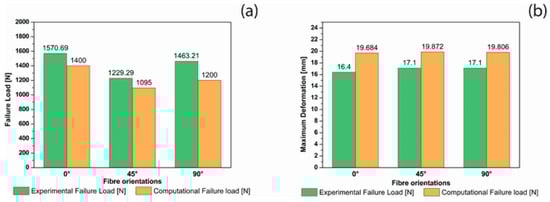
Figure 9.
(a) A comparison of tensile failure load and (b) tensile deformation for both experimental and computational results.
3.2. Flexural Test
The same cutting method is followed for the flexural test according to ASTM standard D790. The pieces are placed horizontally in a three-point bending test where the bottom of the plate remains stationary, and the load is applied to the top [24]. Force value and the cross-head speed rate (0.01 mm/min) are recorded until a rupture of the specimen is obtained, as shown in Figure 10b. In Table 6 the flexural testing is performed on an NFRC sandwich laminate with 0°, 45°, and 90° fibre orientations. The NFRC sandwich laminate with 0° fibre orientation has the greatest flexural strength, measuring 44.265 MPa. The laminate with 90° fibre orientation displays the average flexural strength, measuring 43.876 MPa, and the laminate with 45° fibre orientation has the lowest flexural strength, measuring 29.943 MPa, as shown in Figure 10a.
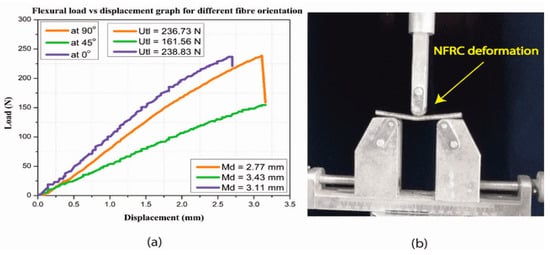
Figure 10.
(a) A load vs. displacement graph of the flexural test; (b) deformation of the NFRC during the flexural test.
Table 6.
Flexural characteristics of the NFSC sandwich composite with different fibre orientations.
3.2.1. A Computational Test of an ASTM D790 Flexural Structure
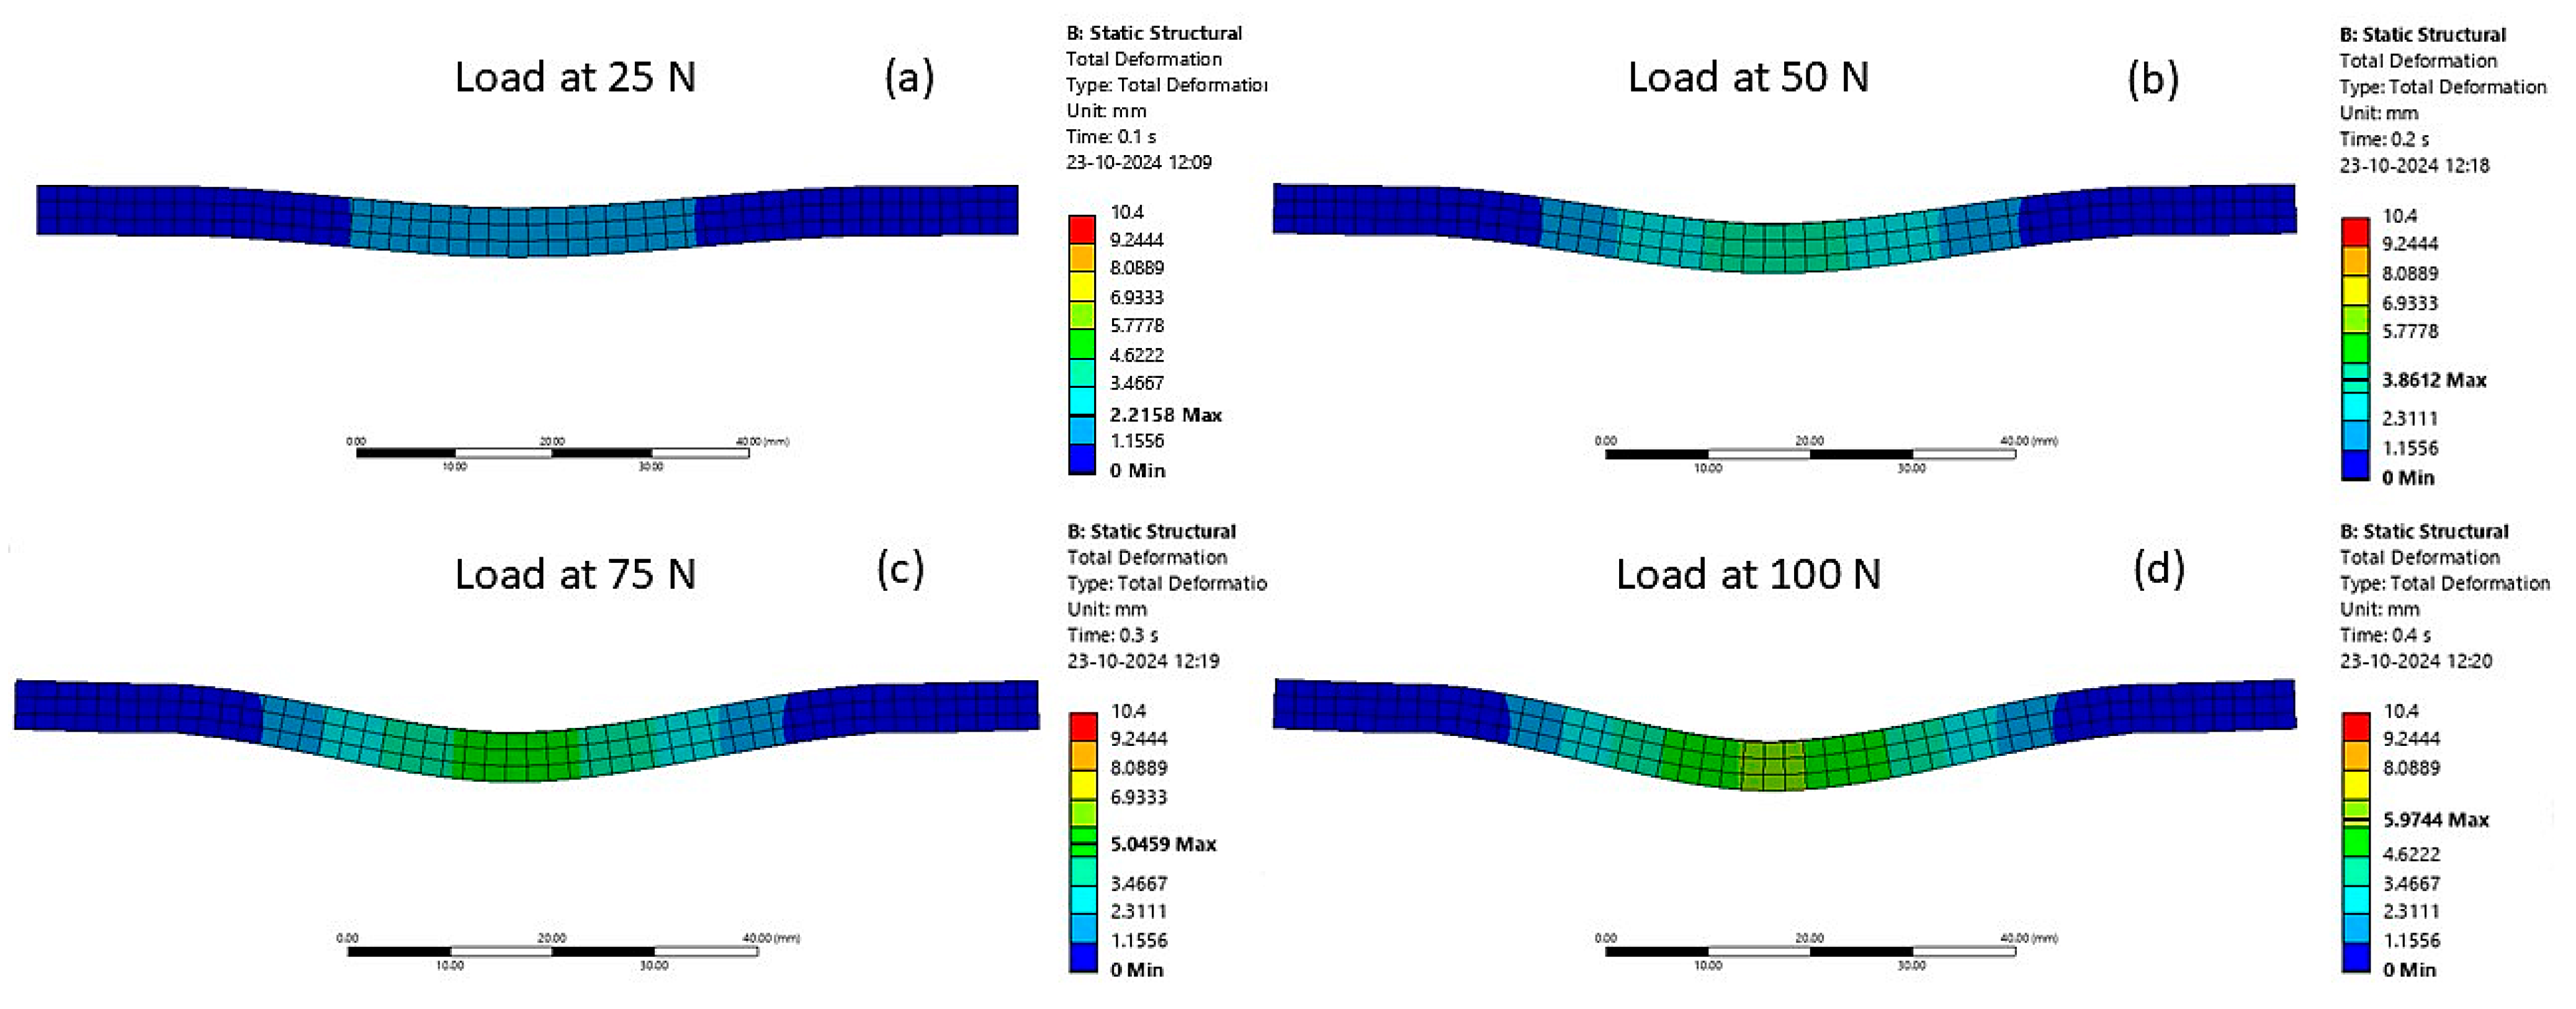
Like the tensile test, we perform stress and deformation analysis to determine the flexural properties of the NFRC at 0°, 45° and 90° fibre orientations, respectively. The simulation results of 0° fibre orientation for the NFRC are given in Table 7. From Figure 11, we can observe that as the load increases, the stress develops, and the deformation of the structure increases steadily. The continuous increase in deformation with increasing load indicates the structure’s increasing deflection under flexural stress, which starts at 2.2158 mm for a 25 N load and peaks at 10.37 mm for a 300 N load. The material approaches its stress limit as the applied load increases, with the maximum von Mises stress increasing from 4.0419 MPa under a 25 N load to 25.622 MPa at 300 N. The safety factor implies a relatively safe operating range, which starts at 5.9155 for a 25 N load. However, as the load increases, it steadily drops, reaching a crucial value of 0.93319 at 300 N, a sign that the material crosses the failure threshold. The structure functions at the edge of its safe limit when the safety factor falls to about 1.0011 at 268 N. After this, failure is likely, as shown by the factor at 300 N, which has a value of less than one.
Table 7.
Results of the computational flexural test of a 0° fibre orientation sandwich layer composite.
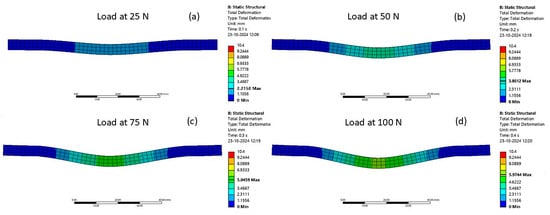
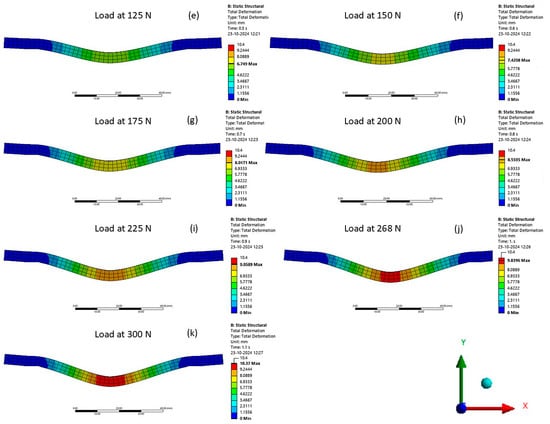
Figure 11.
Stress analysis results of the flexural test for 0° fibre orientation at (a) 25 N, (b) 50 N, (c) 75 N, (d) 100 N, (e) 125 N, (f) 150 N, (g) 175 N, (h) 200 N, (i) 225 N, (j) 268 N, and (k) 300 N.
The computational study results of the 45° fibre orientation composite. We can observe the variation of von Mises stress and deformation with changes in load conditions, as shown in Table 8.
Table 8.
Results of the computational flexural test of a 45° fibre orientation sandwich layer composite.
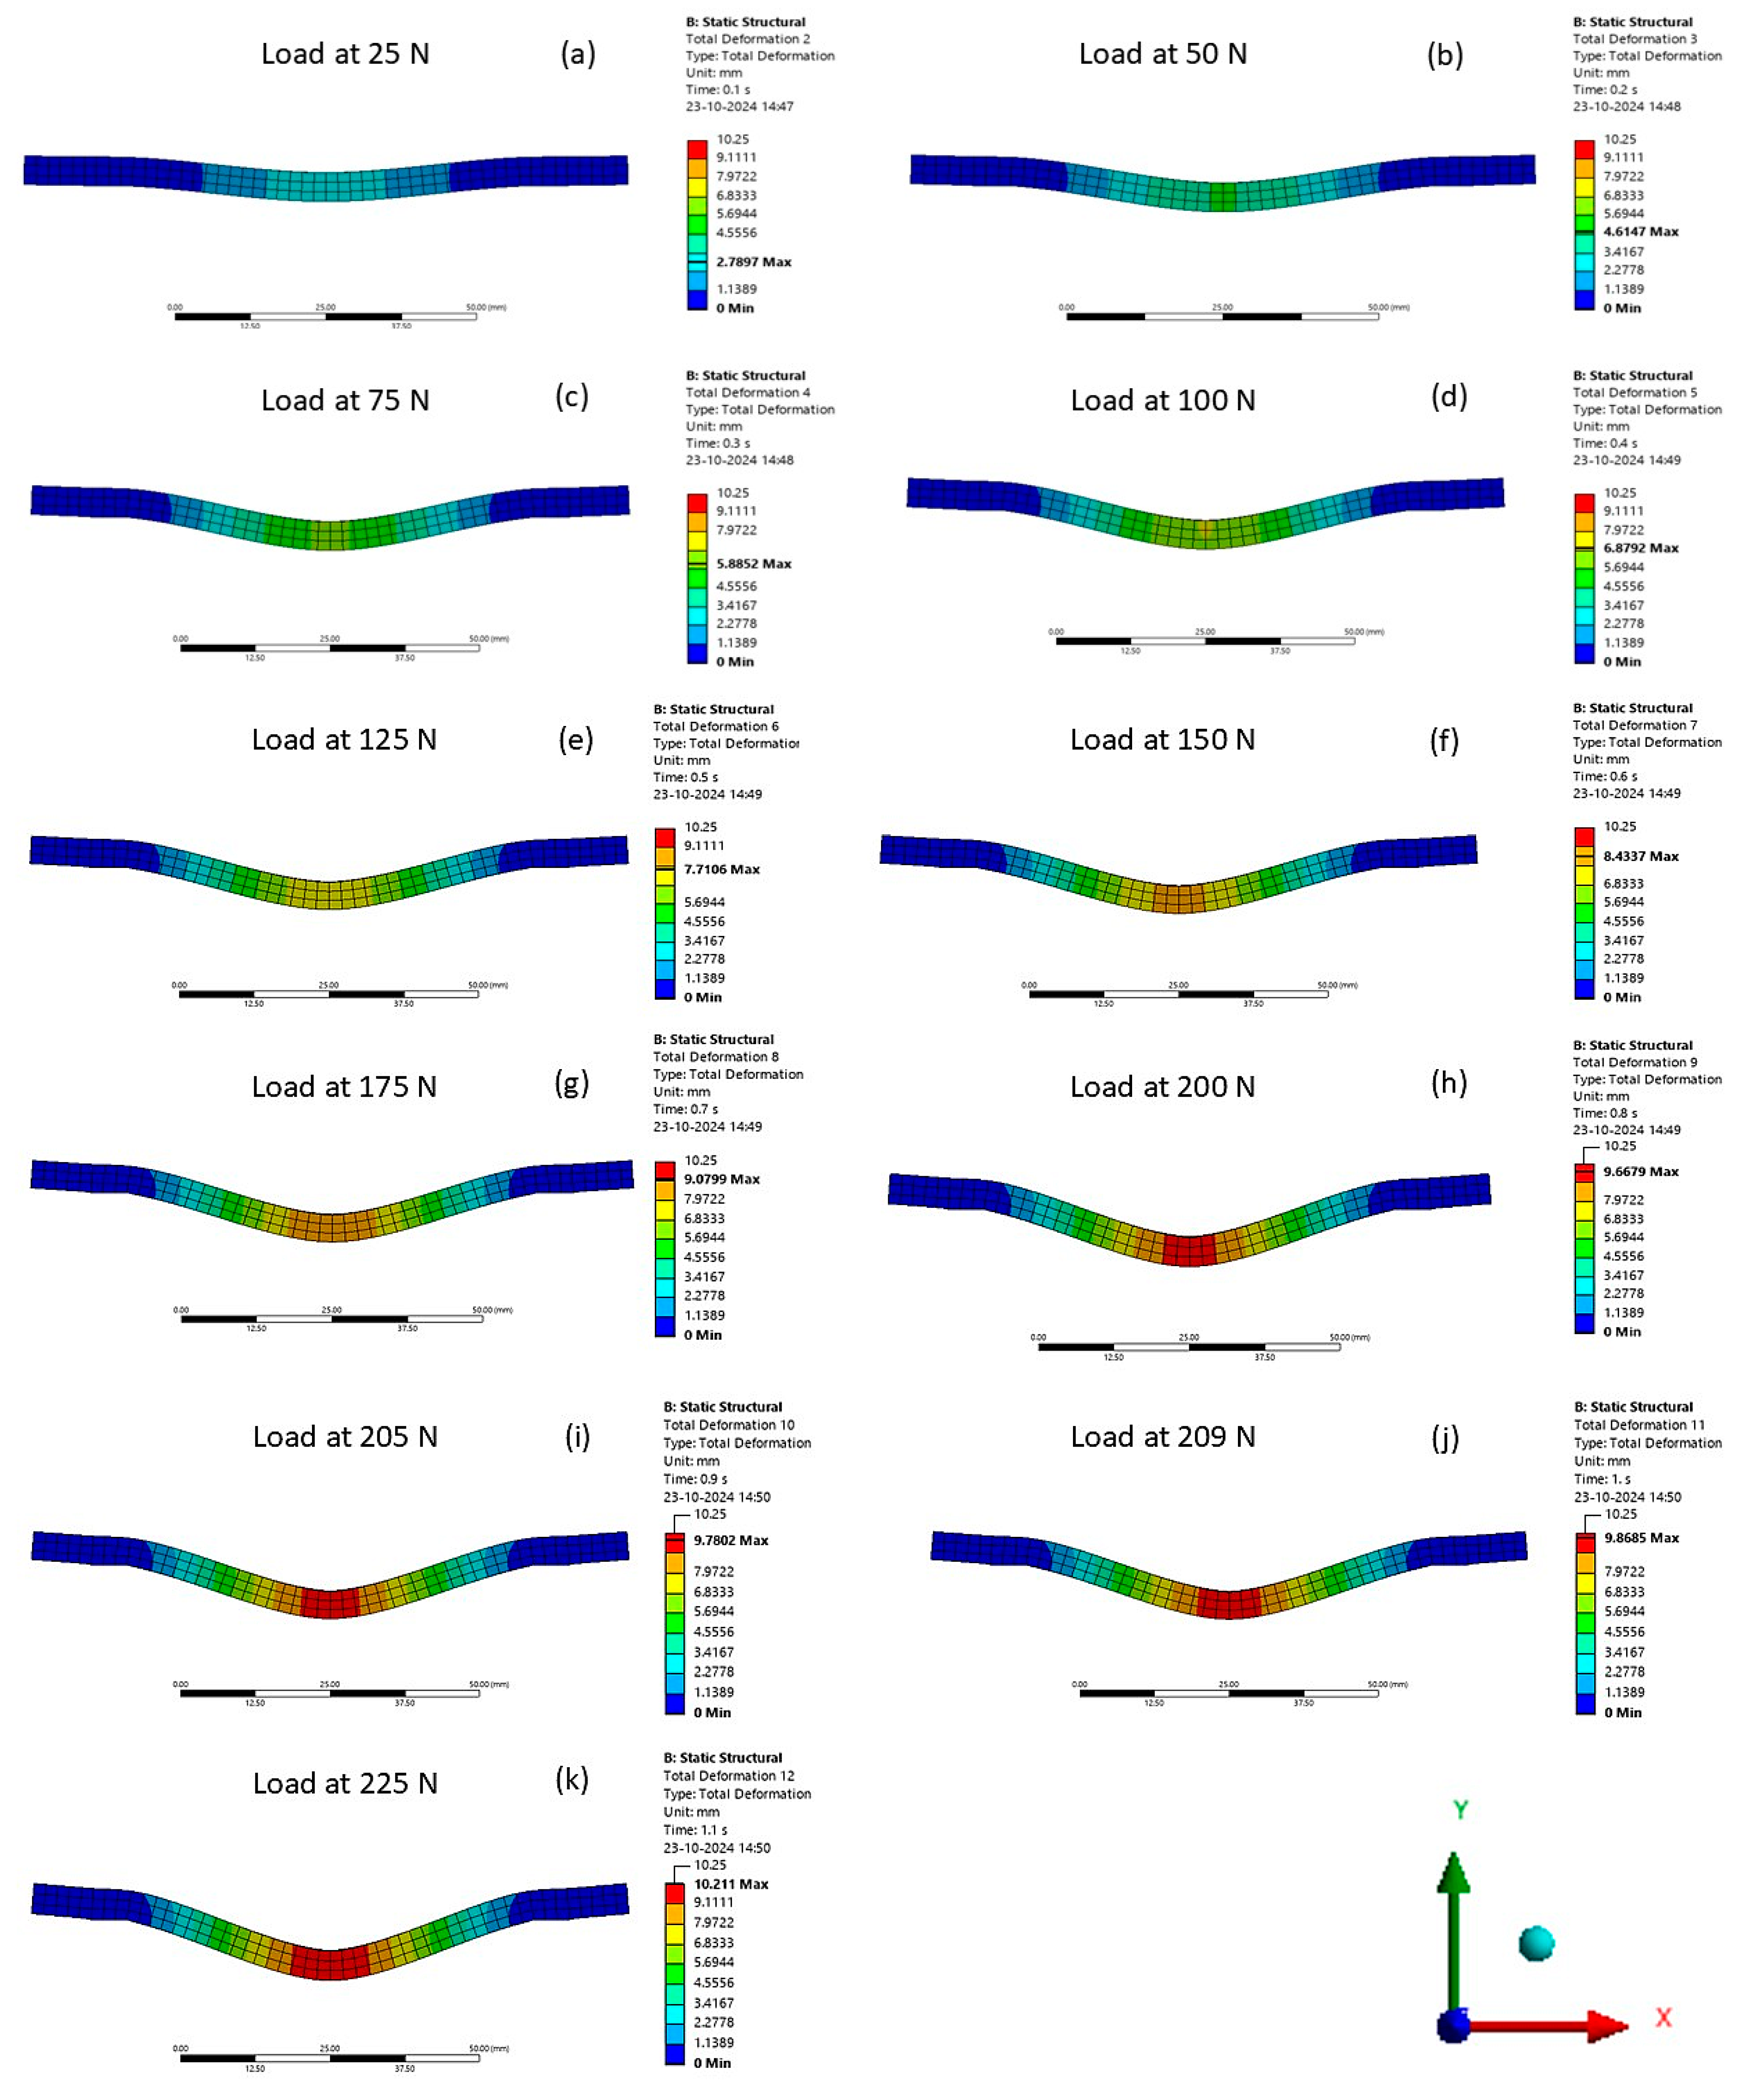
From Figure 12, we can observe the material’s gradual bending under increased stress, highlighted by the increase in deformation with load, which starts at 2.7897 mm for 25 N and reaches 10.211 mm for 225 N. From 3.982 MPa at 25 N to 19.139 MPa at 225 N, the maximum von Mises stress increases significantly with increasing load, suggesting that the material is approaching its stress capacity. A substantial margin of safety is shown by the safety factor, which starts at a comfortable 4.6083 under a 25 N load. However, it gradually decreases with increasing load, reaching a value of 1.0034 at 209 N, suggesting that any further load applied to the structure will cause failure. At 225 N, the safety factor is 0.9587, indicating that the material has already failed under the load condition.
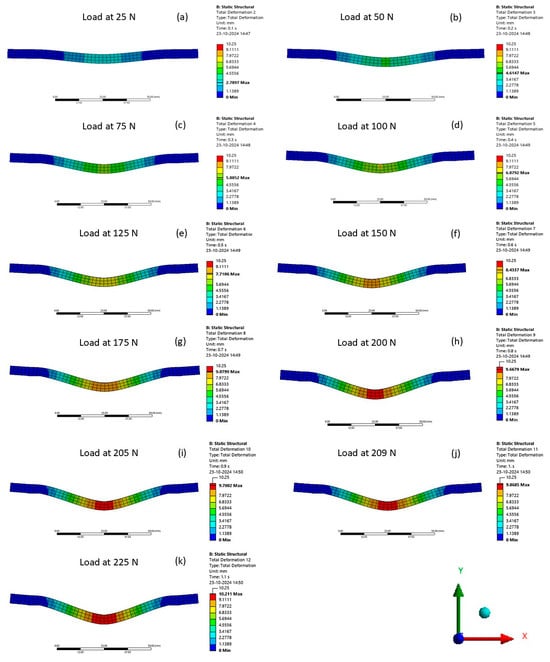
Figure 12.
Stress analysis results of the flexural test for 45° fibre orientation at (a) 25 N, (b) 50 N, (c) 75 N, (d) 100 N, (e) 125 N, (f) 150 N, (g) 175 N, (h) 200 N, (i) 205 N, (j) 209 N, and (k) 225 N.
The same procedure for the flexural test was followed for the 90° fibre orientation composite, and the stress and deformation analysis were computed. The results of the simulation are presented in Table 9.
Table 9.
Results of the computational flexural test of 90° fibre orientation sandwich layer composite.
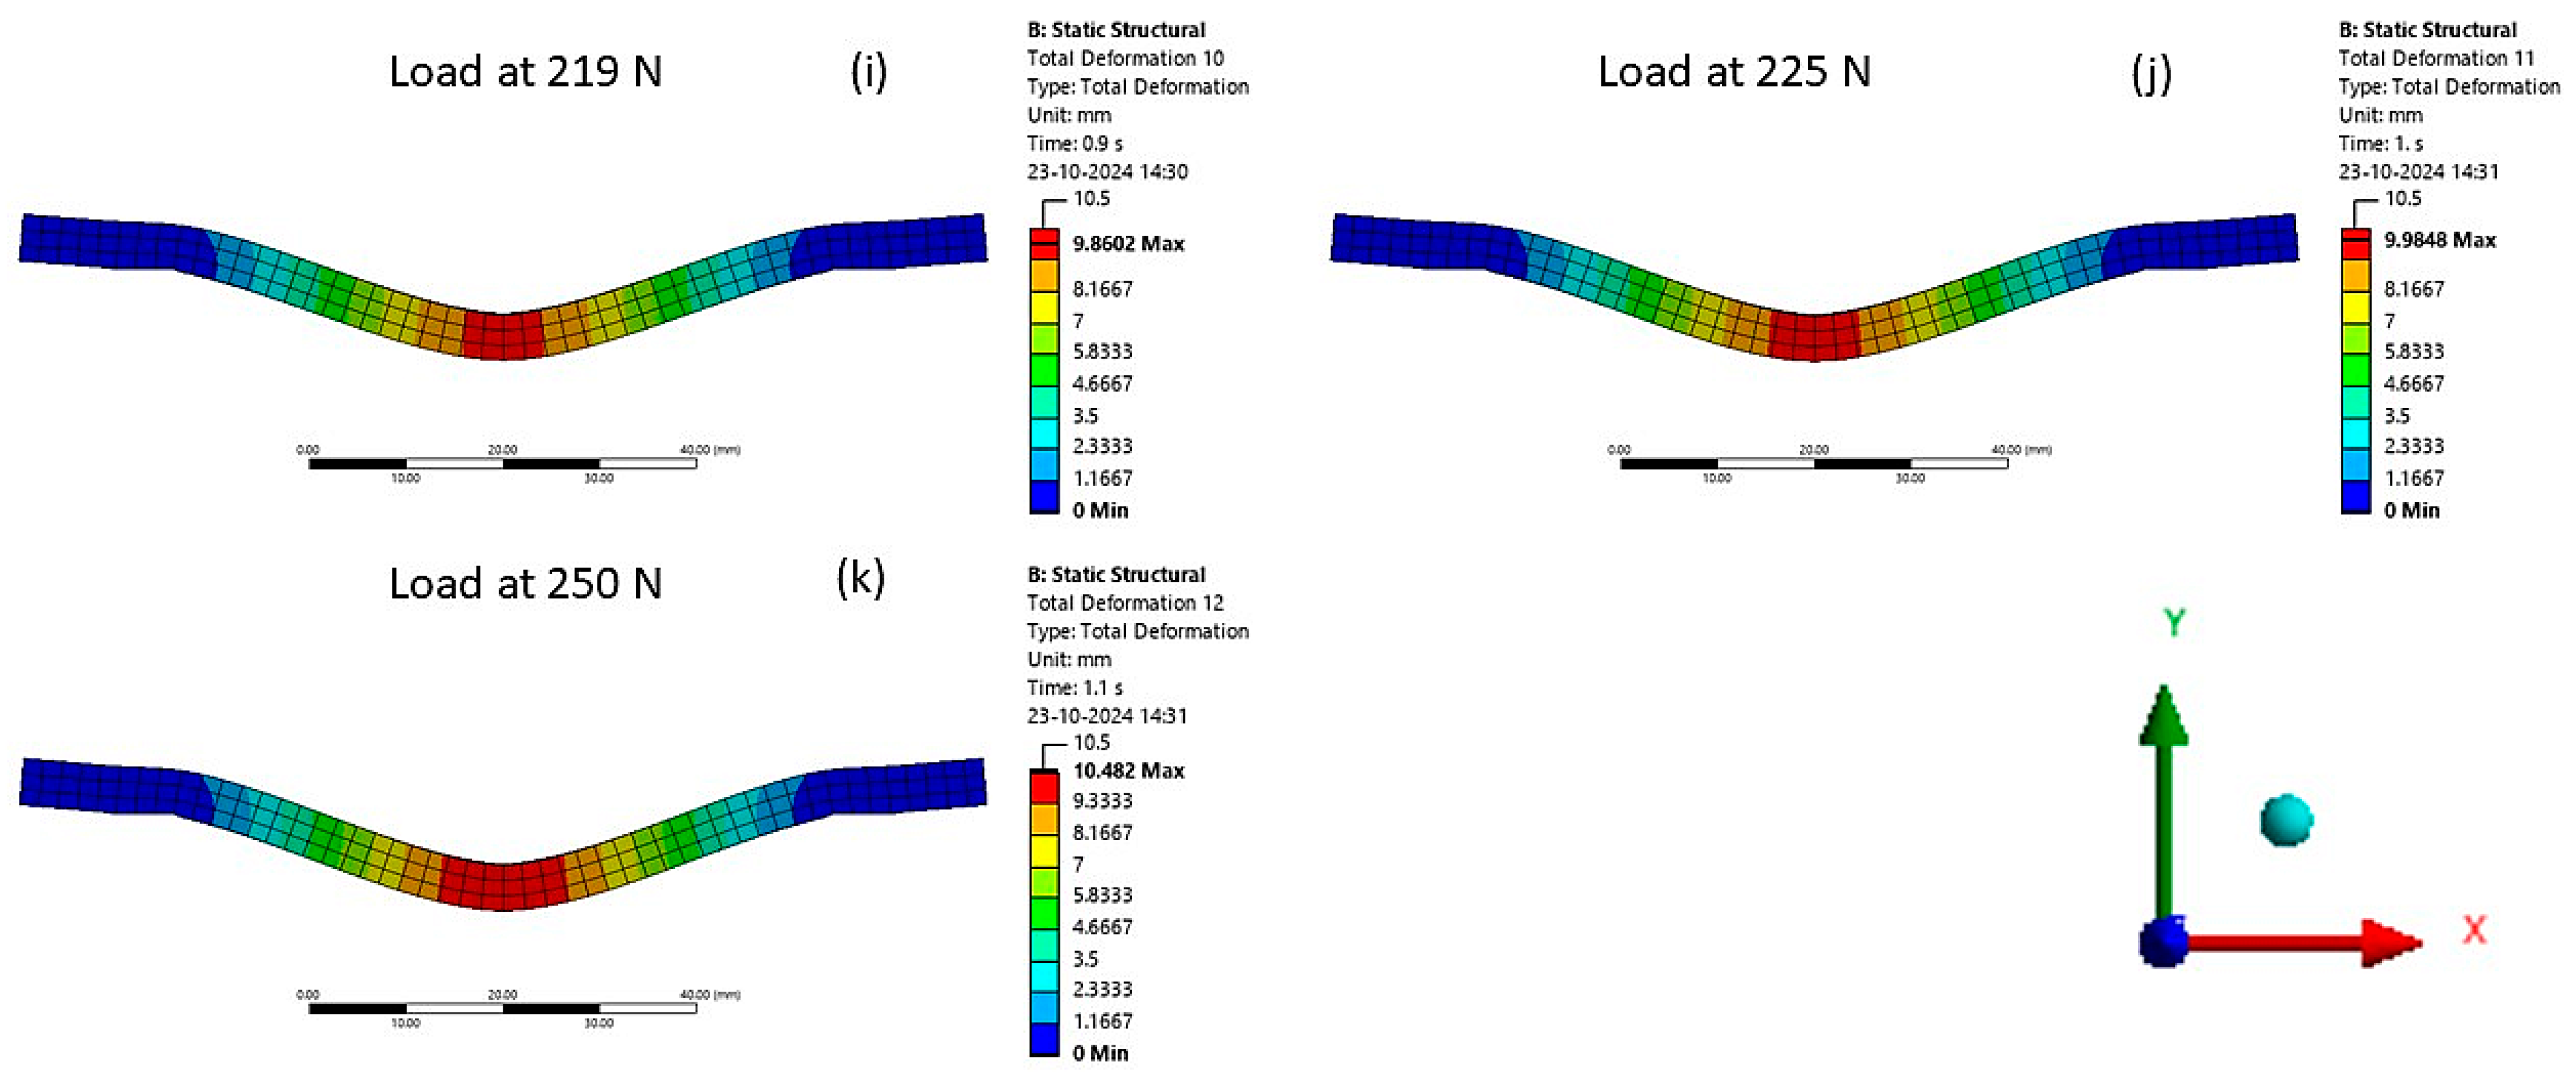
As shown in Figure 13, the material’s flexibility at larger flexural loads is demonstrated by the deformation’s steady upward trajectory as the load increases, which starts at 2.6637 mm for a 25 N load and reaches 10.482 mm for a 250 N load. The material’s critical stress level approaches its limit as the load application increases, as evidenced by the progression of the maximum von Mises stress from 4.0078 MPa at 25 N to 21.004 MPa at 250 N. The safety factor shows a substantial safety margin, which begins at a safe 4.8431 for a 25 N load. However, as the load increases, it steadily drops, reaching 0.9241 at 250 N. At 219 N, the safety factor reaches 1.0027, suggesting that any increase in load will cause failure.
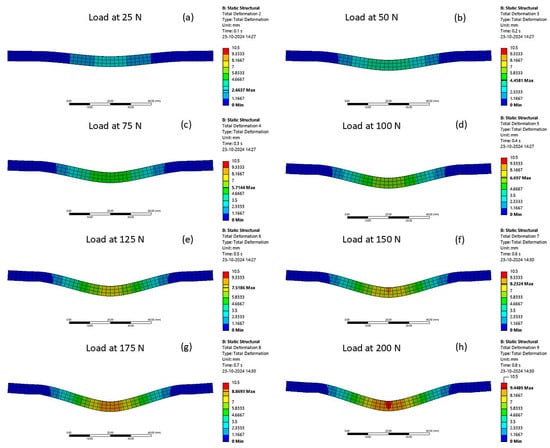
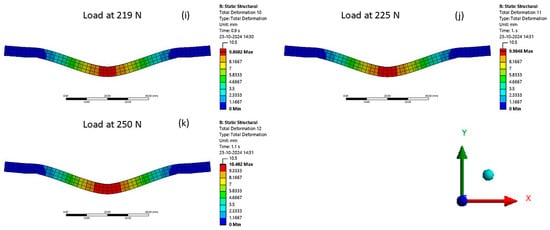
Figure 13.
Stress analysis results of the flexural test for 90° fibre orientation at (a) 25 N, (b) 50 N, (c) 75 N, (d) 100 N, (e) 125 N, (f) 150 N, (g) 175 N, (h) 200 N, (i) 219 N, (j) 225 N, and (k) 250 N.
3.2.2. Comparative Results of the Experimental and Computational Test of an ASTM D638-03 Tensile Structure
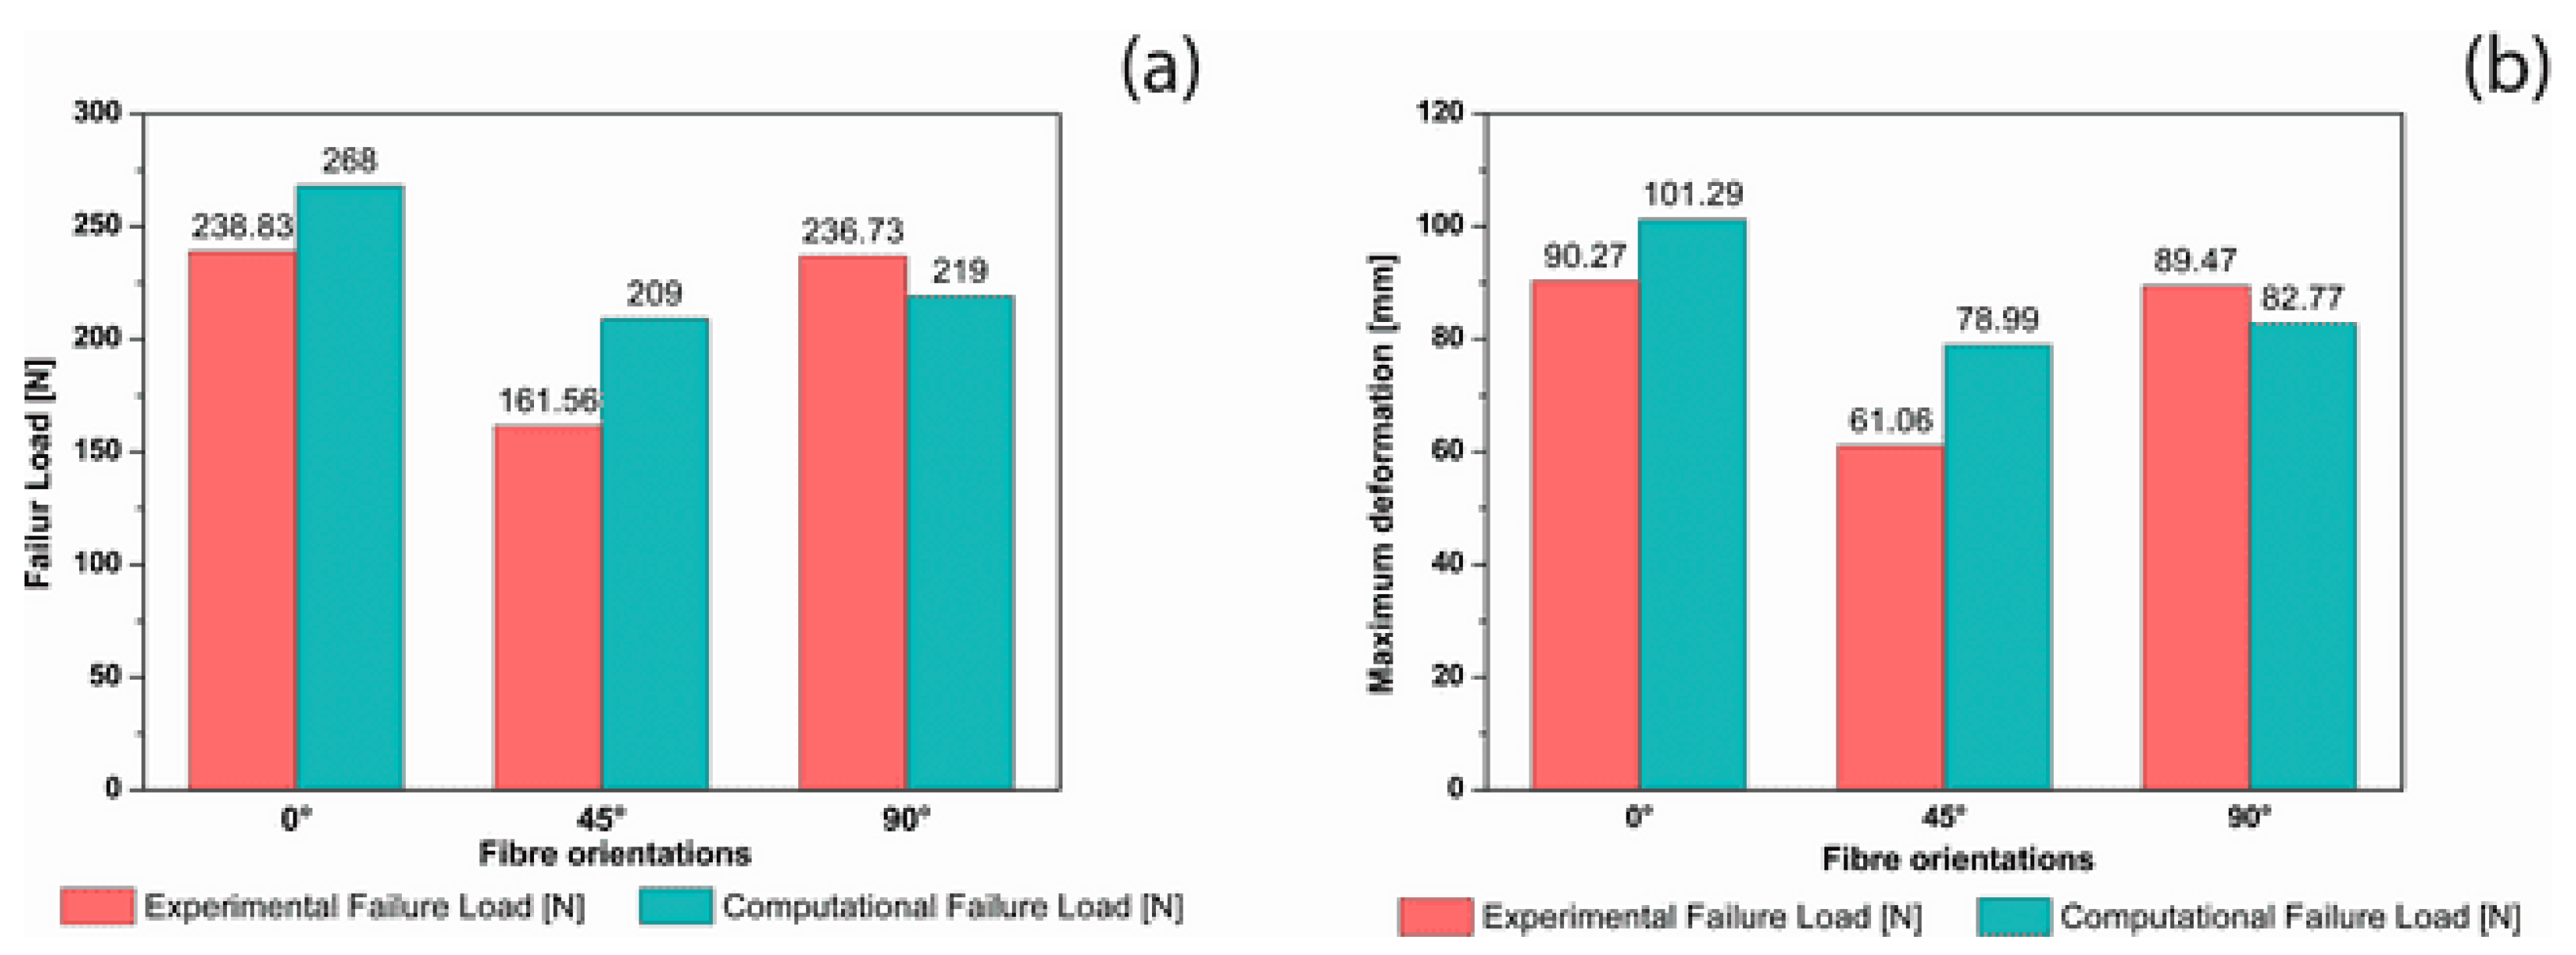
Comparing the flexural failure load of the computational results with that of the experimental results. From Figure 14a, we can see that for 0°, 45°, and 90° fibre orientations, the variation between the experimental and computational results was 12%, 29% and 7%, respectively. We can observe a high variation in 45° orientation fibre compared to the rest, which indicates that there might be a material defect in it, which influences the experimental results. The same comparison was also made for deformation analysis Figure 14b. We see 11%, 23% and 8% variations in the 0°, 45°, and 90° fibre orientations, respectively. The high variation is also consistent with the 45° orientation fibre for deformation, further suggesting the presence of a defect.
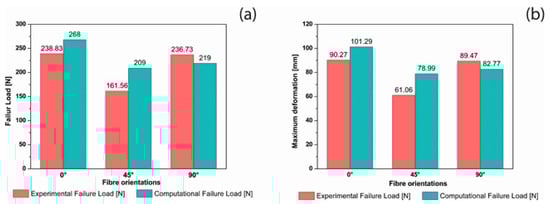
Figure 14.
(a) A comparison of the flexural failure load and (b) flexural deformation in both experimental and computational results.
4. Conclusions
The above study states that the tensile, flexural, and impact characteristics of an NFRC sandwich composite were evaluated; the jute fibre structure epoxy composite, which combined Soric XF as core material that was greatly influenced by fibre orientation. The following describes the effects of 0°, 45°, and 90° fibre orientations on various properties.
4.1. Summary of the Tensile Test
- Fibre orientation of 0°
The maximum tensile limit of 23.91 MPa strength results from fibres aligned with the tensile force. The fibres, which are substantially stronger in tension than the matrix material, carry the weight.
- Fibre orientation of 45°
In this orientation, the fibres are not aligned with the load direction, leading to a mixed response where both fibre and matrix contribute. Shear stress acts on the fibres, producing a low tensile strength of 18.31 MPa.
- Fibre orientation of 90°
The load is applied perpendicular to the fibre direction, which means the matrix bears most of the load, leading to the moderate tensile strength of 91.41 MPa. The fibres contribute very little since they are not aligned to resist the tensile force.
4.2. Summary of the Flexural Test
- Fibre orientation of 0°
The composite exhibits a high flexural strength of 44.265 MPa when the fibres are aligned along the load direction. The fibres effectively resist bending and deformation, especially on the tension side of the bending curve.
- Fibre orientation of 45°
29.943 MPa reduces flexural strength because the fibres are angled relative to the load direction. This orientation leads to more significant deformation under bending, with the matrix and fibres sharing the load unequally.
- Fibre orientation of 90°
Flexural strength is significantly moderate in this orientation at about 43.876 MPa. Since the fibres are perpendicular to the bending force, they provide average resistance to bending, and the matrix takes most of the load, resulting in a weaker response compared to 0° fibre orientation.
- Experimental and Computational study
The experimental and computational results for each fibre orientation are as follows. For 0° fibre orientation, we can see that the experimental results show the failure load of 1570.69 N, whereas the computational results show 1400 N, indicating a variation of 12.19%. For 45° fibre orientation, we can see a variation of 12.26%; for 90° fibre orientation, we can see a variation of 21.93% in the tensile structure.
The variations between the experimental and computational results for 0°, 45°, and 90° fibre orientations were identified to be 12%, 29%, and 7%, respectively. We can observe a high variation in 45° orientation fibre compared to the rest, which indicates that there might be a material defect in it, which influences the experimental results.
Author Contributions
K.S.K. [Supervision, Project administration, Conceptualization; Methodology; Software Analysis; Data curation, Validation; Writing—Original Draft Preparation funding acquisition]; K.C. [Project administration, Conceptualization; Methodology; Software Analysis; Data curation, Validation; Writing—Original Draft Preparation]; D.J., D.B. [Software Analysis; Data curation, Validation; Writing—Original Draft Preparation]; K.K.J., R.K.S., R.S. [Methodology; Validation, Data curation]. All authors have read and agreed to the published version of the manuscript.
Funding
This research was funded by IIT Guwahati—Technology Innovation HUB, grant number (Project no. TIH-TD/0421).
Institutional Review Board Statement
Not Applicable.
Informed Consent Statement
Not Applicable.
Data Availability Statement
The data presented in this study are available upon request from the corresponding author.
Acknowledgments
We are sincerely thanking the Materials and Wave Propagation Lab in the Department of Mechanical Engineering at NIT Rourkela for assisting in the Modeling and Simulation aspects, also grateful to Wind Wave and Computational Energy Lab in the Department of Green Energy Technology at Pondicherry University for the invaluable support and for providing a better research environment throughout this research.
Conflicts of Interest
The authors declare no conflicts of interest.
References
- Ekundayo, G.; Gong, H.; Abeykoon, C. Jute Fibre Reinforced Polymer Composites in Structural Applications: A Review. J. Mater. Polym. Sci. 2024, 4, 1–13. [Google Scholar] [CrossRef]
- Sarker, F.; Karim, N.; Afroj, S.; Koncherry, V.; Novoselov, K.S.; Potluri, P. High-Performance Graphene-Based Natural Fiber Composites. ACS Appl. Mater. Interfaces 2018, 10, 34502–34512. [Google Scholar] [CrossRef] [PubMed]
- Sangmesh, B.; Patil, N.; Jaiswal, K.K.; Gowrishankar, T.; Selvakumar, K.K.; Jyothi, M.; Jyothilakshmi, R.; Kumar, S. Development of sustainable alternative materials for the construction of green buildings using agricultural residues: A review. Constr. Build. Mater. 2023, 368, 130457. [Google Scholar] [CrossRef]
- Jaiswal, K.K.; Chowdhury, C.R.; Yadav, D.; Verma, R.; Dutta, S.; Jaiswal, K.S.; B, S.; Karuppasamy, K.S.K. Renewable and sustainable clean energy development and impact on social, economic, and environmental health. Energy Nexus 2022, 7, 100118. [Google Scholar] [CrossRef]
- Karaçor, B.; Özcanlı, M.; Serin, H. The influence of hybridization and different manufacturing methods on the mechanical properties of the composites reinforced with basalt, jute, and flax fibers. Iran. Polym. J. 2024, 33, 289–304. [Google Scholar] [CrossRef]
- Arya, M.; Malmek, E.-M.; Ecoist, T.K.; Pettersson, J.; Skrifvars, M.; Khalili, P. Enhancing Sustainability: Jute Fiber-Reinforced Bio-Based Sandwich Composites for Use in Battery Boxes. Polymers 2023, 15, 3842. [Google Scholar] [CrossRef]
- Mahesh, V.; Mahesh, V. Development and Mechanical Characterization of Light Weight Fiber Metal Laminate using Jute, Kenaf and Aluminium. Mech. Adv. Compos. Struct. 2024, 11, 259–270. [Google Scholar] [CrossRef]
- Farooq, U.; Ahmad, M.S.; Rakha, S.A.; Ali, N.; Khurram, A.A.; Subhani, T. Interfacial Mechanical Performance of Composite Honeycomb Sandwich Panels for Aerospace Applications. Arab. J. Sci. Eng. 2017, 42, 1775–1782. [Google Scholar] [CrossRef]
- Tamakuwala, V.R. Manufacturing of fiber reinforced polymer by using VARTM process: A review. Mater. Today Proc. 2021, 44, 987–993. [Google Scholar] [CrossRef]
- Kurien, R.A.; Arshad, A.; Joseph, A.; Sunil, A.; Cherian, B.T.; Rangappa, S.M.; Suttiruengwong, S.; Kannan, G.; Siengchin, S. Agave-jute fiber–reinforced hybrid composite for lightweight applications: Effect of hybridization. Biomass Convers. Biorefinery 2025, 15, 12241–12254. [Google Scholar] [CrossRef]
- Srikanth, R.; Vali, S.K.; Saraswathamma, K.; Sadaq, S.I. Investigation of optimum stacking sequence of pineapple leaf fiber composite laminate using numerical approach. Interactions 2024, 245, 188. [Google Scholar] [CrossRef]
- Suman, S.; Balaji, P.S.; Selvakumar, K.; Kumaraswamidhas, L.A. Nonlinear Vibration Control Device for a Vehicle Suspension Using Negative Stiffness Mechanism. J. Vib. Eng. Technol. 2021, 9, 957–966. [Google Scholar] [CrossRef]
- Sinha, A.K.; Narang, H.K.; Bhattacharya, S. Mechanical properties of natural fibre polymer composites. J. Polym. Eng. 2017, 37, 879–895. [Google Scholar] [CrossRef]
- Mostafa, N.H.; Hunain, M.B.; Jassim, A. Mechanical properties of the Jute fibers-activated carbon filled reinforced polyester composites. Mater. Res. Express 2019, 6, 125104. [Google Scholar] [CrossRef]
- Sanivada, U.K.; Mármol, G.; Brito, F.P.; Fangueiro, R. PLA Composites Reinforced with Flax and Jute Fibers—A Review of Recent Trends, Processing Parameters and Mechanical Properties. Polymers 2020, 12, 2373. [Google Scholar] [CrossRef]
- Al-Shammri, M.A.; Abdullah, S.E. Experimental and Numerical Investigation of Hyper Composite Plate Structure Under Thermal and Mechanical Loadings. J. Eng. 2017, 23, 56–69. [Google Scholar] [CrossRef]
- Trindade, D.; Habiba, R.; Fernandes, C.; Costa, A.A.; Silva, R.; Alves, N.; Martins, R.; Malça, C.; Branco, R.; Moura, C. Material Performance Evaluation for Customized Orthoses: Compression, Flexural, and Tensile Tests Combined with Finite Element Analysis. Polymers 2024, 16, 2553. [Google Scholar] [CrossRef]
- Venkatesan, K.; Bhaskar, G.B. Evaluation and Comparison of Mechanical Properties of Natural Fiber Abaca-sisal Composite. Fibers Polym. 2020, 21, 1523–1534. [Google Scholar] [CrossRef]
- Feng, L.; Wang, D.; Yan, J. Reliability Study of Wood–Plastic Composites Based on Probabilistic Finite Elements. Polymers 2023, 15, 312. [Google Scholar] [CrossRef]
- G, P.C.; Reddy, M.S.; Rajendrachari, S.; Mahale, R.S.; Mahesh, V.; Pandith, A. The Behavior of Banyan (B)/Banana (Ba) Fibers Reinforced Hybrid Composites Influenced by Chemical Treatment on Tensile, Bending and Water Absorption Behavior: An Experimental and FEA Investigation. J. Compos. Sci. 2024, 8, 31. [Google Scholar] [CrossRef]
- Kumar, K.K.S.; Kumaraswamidhas, L.A. Investigation on Stability of an Elastically Mounted Circular Tube under Cross-Flow in Inline Square Arrangement. Iran. J. Sci. Technol. Trans. Mech. Eng. 2020, 44, 313–325. [Google Scholar] [CrossRef]
- Sujita, S.; Sutanto, R. Influence of drying methods on tensile strength of polyester composites reinforced apus bamboo. World J. Adv. Eng. Technol. Sci. 2024, 12, 245–249. [Google Scholar] [CrossRef]
- Nagarajaiah, M.; Mahadevaiah, R.R.; Parshuram, K.R.B.; Hiremath, P. A Numerical Study on Coconut Inflorescence Stem-Fiber-Reinforced Panels Subjected to Tensile Load, Compressive Load, and Flexural Load. Eng. Proc. 2024, 59, 233. [Google Scholar] [CrossRef]
- Habib, A.; Rajoni, H.; Sayeed, A.; Islam, M.; Sajedujjaman, A.T.M.; Saifullah, A.; Sarker, F. Sustainable Jute Fiber Sandwich Composites with Hybridization of Short Fiber and Woven Fabric Structures in Core and Skin Layers. Macromol. Mater. Eng. 2024, 309, 2400138. [Google Scholar] [CrossRef]


Disclaimer/Publisher’s Note: The statements, opinions and data contained in all publications are solely those of the individual author(s) and contributor(s) and not of MDPI and/or the editor(s). MDPI and/or the editor(s) disclaim responsibility for any injury to people or property resulting from any ideas, methods, instructions or products referred to in the content. |
© 2025 by the authors. Licensee MDPI, Basel, Switzerland. This article is an open access article distributed under the terms and conditions of the Creative Commons Attribution (CC BY) license (https://creativecommons.org/licenses/by/4.0/).