Abstract
Using the OLS model with different quantiles of GPR, we aim to examine the impact of GPR, EPU, and VIX on monthly international crude oil prices, including WTI, BRENT, and DUBAI prices, while differentiating the impact on different levels of risks. Afterwards, we use the GARCH and MGARCH models to assess the impact of these metrics on the volatility of oil prices, and the spillover effects between oil prices with these three metrics as exogenous shocks. Our result indicates (i) global oil price is negatively affected by GPRT at a moderate level of risks in longer time intervals; (ii) GPR, EPU, and VIX affect oil price’s volatility, and (iii) there exists a stronger long-persistent spillover effect between BRENT and DUBAI, with these metrics as exogenous shocks, while WTI is not affected.
1. Introduction
In an increasingly integrated world economy, globalized markets reverberate major political events such as elections, coups, civil strife, as well as intra- and interstate conflict and war, mega terrorist attacks, etc. Among other economic effects, political conflicts can bring about noteworthy changes and shifts in oil prices, especially when one of the countries involved is a major player in the market. This led to what is known as “external shocks” in the energy market, which is because of a disruption in supply or a rise in preventive demand. It also led to greater volatility during the conflict, resulting from the uncertainty and instability that affected the market.
Therefore, the aim of this paper is to review the impact of international martial conflicts, identified by the Geopolitical Risk Index (GPR) as well as the Economic Policy Uncertainty (EPU) Index and Volatility Index (VIX) of energy prices, with the deeper insights into how different level of risk would impact the international crude oil prices benchmarks. Furthermore, we would investigate the influence of these metrics on the volatility of crude oil prices. Finally, we would establish the dynamics between different crude oil prices and how geopolitical events and economic policy affect those dynamics.
2. Literature Review
2.1. Geopolitics and Geopolitical Risks
Geopolitical risk (GPR) would identify situations in which power struggles over territories cannot be resolved peacefully. Thus, GPR would be defined as the risks associated with geopolitical events that possess detrimental impacts on the global context and peaceful course of international relations, such as wars, terrorist attacks, and political tension between states [1]. The authors collected GPR data via news articles around the world with specific wordings and terminology, as observed in Table A1.
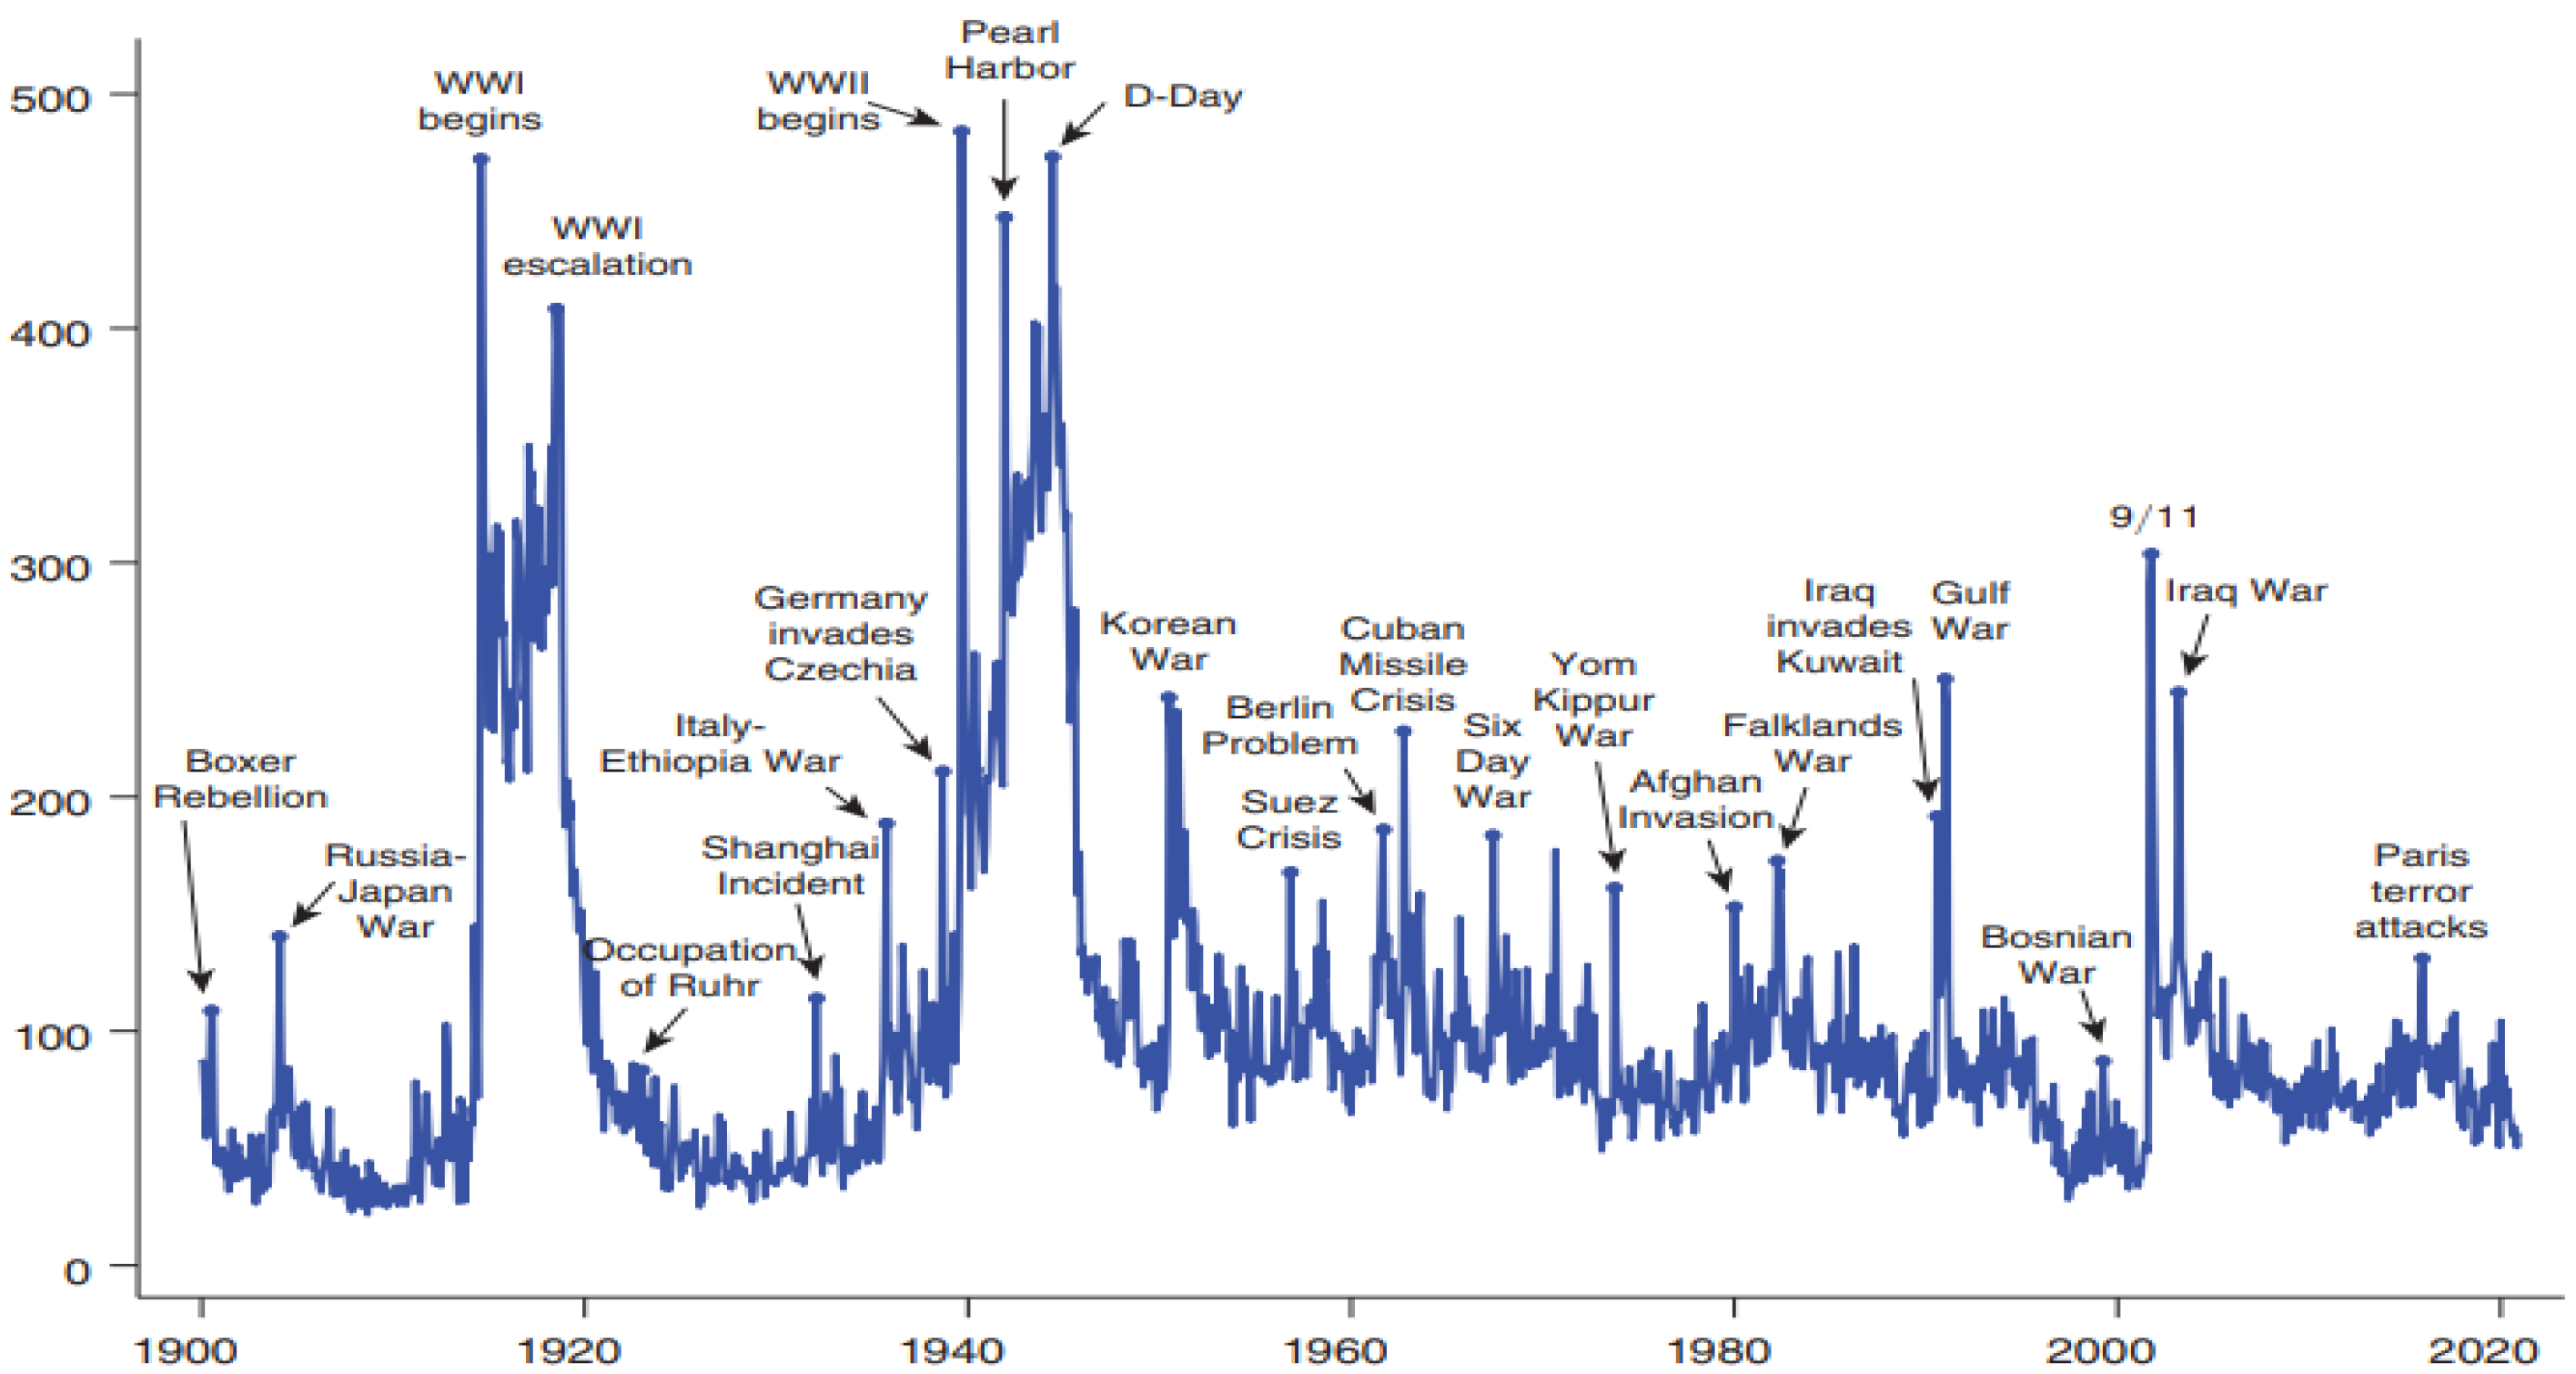
Figure 1 illustrates the correlation between GPR and world events. As observed, GPR would spike up in correlation with significant world events that garner a lot of attention in the newspaper.
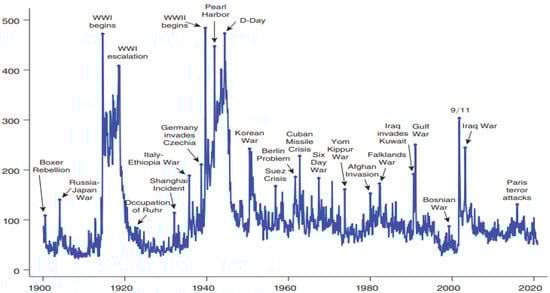
Figure 1.
Correlation between GPR and global events [1].
Importantly, Caldara and Iacoviello subdivide the GPR index further into two indices: geopolitical acts and geopolitical threats. Thus, GPR Threat consists of articles about threats of conflicts, while GPR Act corresponds to the actual occurrence or escalation of negative events. As observed in the Figure 2 below, GRPA would correspond with war, conflicts, and terrorist attacks, while GPRT would pick up during periods of crisis and tension.
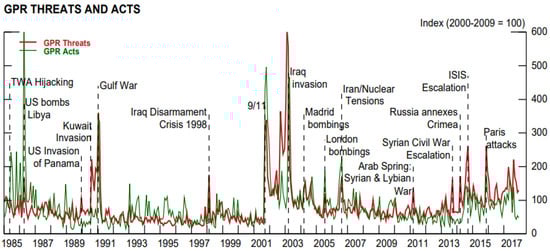
Figure 2.
GRPA and GPRT and global events [1].
2.2. Economic Policy Uncertainty
The Economic Policy Uncertainty index (EPU) measures the degree of economic uncertainty resulting from changes in economic policies [2]. It is computed by analyzing news articles that discuss policy uncertainty and calculating their occurrence frequency. When economic policies are uncertain, businesses and investors hesitate to make long-term investments, which can reduce energy demand. In addition, economic uncertainty can result in a decline in economic activity, which can further reduce energy demand as well as prices. In contrast, when economic policies are stable and predictable, businesses and investors are more likely to make long-term investments, which can increase energy demand and prices.
2.3. Votilatiy Index
The VIX (Volatility Index) is a well-known indicator of market sentiment, particularly reflecting the investors’ expectations about future volatility of the S&P500 in the next 30 days. The index was designed to quantify market volatility in their paper. They proposed using options pricing to create a real-time Volatility Index, which led to the launch of the VIX in 1993 by the Chicago Board Options Exchange (CBOE) [3].
3. Methodology and Data
3.1. Empirical Models
3.1.1. Ordinary Least Squares (OLS)
The model of Kannadhasan, M., and Das, D. (2019) [4] used a quantile regression based on quantile auto-regression methodology, and the results of Qian et al. (2022) [5] stated the asymmetric and non-linear nature of the GPR and oil prices. Thus, we have devised our OLS model and adapted the quantile of different levels of GPR to estimate the impact of GPR, even GPRT and GPRA, as well as EPU, on different international oil prices:
In this model of ours, R stands for the first log difference in the oil price index i at time t. We also include the first log difference in respective oil price indexes with lag p, with p being lag calculated based on the Bayesian Information Criterion (BIC). After, we include a dummy variable of I, which is 1 when the oil price return exceeds the 95th percentile, and 0 otherwise. are the coefficients of U, being the absolute value of GPR, GPRT, and GPRT subsequently, when is at percentile. We segment into 10 quantiles to account for different impacts of GPR, GPRA, and GPRT at different quantiles to account for the non-linear relationship between geopolitical risk and international crude oil prices. Next, we also include the impact of changes in EPU to examine its influence on international oil prices.
3.1.2. Univariate GARCH Model
After using the OLS model to identify the impact of geopolitical risk, with both sub-indexes of Threat and Acts, and Economic Policy Uncertainty, we would then utilize the GARCH model to estimate the effect on volatility with GARCH specifications including GARCH (1,1). We adopt these specifications with GARCH (1,1) of Bollerslev (1986) [6].
The ARCH (p,q) model is as follows:
Bollerslev (1986) [6] continued to extend the ARCH into generalized autoregressive conditional heteroskedasticity (GARCH). The GARCH (p,q) model is as follows:
In this paper, we will use GARCH (1,1) to explore the effect of GPR, EPU, and VIX on the volatility of international crude oil prices, following the models of Smales (2021) [7]:
3.1.3. Multivariate GARCH Model
Last, we use a multivariate GARCH (MGARCH) model to examine the volatility dynamics between different global oil price indexes, with GPR, EPU, and VIX as the exogenous shocks. The specifications used, as presented in the result of the previous paper, are the dynamic conditional correlation (DCC). The MGARCH model also lets us account for the volatility spillover between oil prices, with the GPR, EPU, and VIX as influencing factors.
3.2. Descriptive Statistics
For this research, the authors first collected the monthly Geopolitical Risk Index (GPR), as well as the sub-index of Geopolitical Risk Threat (GPRT) and Geopolitical Risk Act (GPRA). Differentiating between GPRA and GPRT can support in as an effective indicator of the specific sources for the impact on the dependent variables, in this studying being global oil prices, which can help companies and governments to assess accurately the risk components or global events that lead to the impact on energy cost, as well as to effectively devise suitable strategy and policy to adapt to the impending adverse situations. Furthermore, we also collected the monthly values of both the EPU and the VIX.
Regarding the crude oil price for the analysis of this study, we utilize the average global oil price, the West Texas Intermediate (WTI), BRENT, and DUBAI (Dubai Futeh) crude oil prices. The choice of these prices is made since these are the main oil benchmarks worldwide, utilized as guidelines for the pricing of crude oil across nations. Referring to the Figures in Appendix A, it is observed that the log difference and the returns of these oil prices are right-skewed, indicating the tendency to reach higher prices compared to the mean, given the right circumstances, best reflected in the early months of the Russo-Ukraine conflict. Table 1 below summarized the descriptive statistics of these data.

Table 1.
Descriptive statistics.
4. Empirical Result
4.1. Ordinary Least Squares
Table 2 compiled the results of the OLS of the impact of the GPR, EPU, and VIX on the WTI, BRENT, and DUBAI.
Table 2.
GPR impact on oil prices.
From the result, we observed that the changes in EPU would have statistically significant results, yet only minimal effects on the oil price. On the other hand, VIX would have a stronger negative impacts compared to EPU. However, GPR and GPRA are observed to have a statistically insignificant impact on all three oil prices. However, GPRT is observed to have a significant impact at the 40th and 50th quantiles on WTI, BRENT, and DUBAI, at 5–10% significance. This result aligns with that of Smales (2021) [7].
4.2. Univariate GARCH Model
After examining the impact of GPR, EPU, and VIX, as well as GPRT and GPRA, on different international oil price benchmarks, we now employ the univariate GARCH model to estimate the impact of the change in GPR, EPU, and VIX as exogenous shocks on the returns of different oil price volatilities, with the specification of GARCH (1,1). Table 3 below shows the result of the GARCH model.
Table 3.
GARCH model result.
From the results above for the GARCH (1,1) specification, we can conclude that GPR would have a positive impact on the returns of BRENT and DUBAI. On the other hand, the EPU index would have a statistically negative impact on the return of oil prices for all three price benchmarks. Additionally, using the conditional variance equations, it is clear that monthly changes in GPR would have a statistically insignificant minimal impact on the volatility of oil prices. EPU and VIX are shown to have a significant positive impact on the volatility of oil prices. Moreover, with both ARCH and GARCH terms being significant, it is implied that the impact on the volatility of oil prices is both long-run and short-run persistence. However, it is apparent that GARCH is statistically more significant compared to ARCH, indicating a stronger long-term effect compared to a short-term one.
Compared to the effect of GPR, EPU, and VIX on oil price in the conditional mean, we observe that the impact of EPU and VIX would be greater, while GPR has no impact in this model.
4.3. Multivariate GARCH Model
To finish the empirical analysis of this study, we utilized the DCC specifications of the multivariate GARCH (MGARCH) model to examine the volatility dynamics between international crude oil prices, with GPR, EPU, and VIX as exogenous shocks. In Table 4 below, the following identifications would be applied for each return of global crude oil prices indexes: i = 1: Western Texas Intermediate Crude oil price, i = 2: BRENT Crude oil price, i = 3: DUBAI, i = 4: GPR, i = 5: EPU index, i = 6: VIX.
Table 4.
MGARCH model result.
Using the Dynamic Constant Correlation (DCC) specifications, we observe the spillover effect between each oil price benchmark. Firstly, DUBAI seems to have a bi-directional effect with BRENT, with BRENT having a negative effect on DUBAI, while DUBAI would have a positive effect on BRENT. Previous months’ return of DUBAI would also drive up the value of DUBAI, while BRENT experiences the opposite, indicating the mean-reverting tendency. WTI experienced little to no effect from DUBAI or BRENT, or even its previous value.
On the other hand, GPR would have a weak negative spillover effect on WTI and DUBAI, at 1% and 5% significance, respectively. Meanwhile, EPU and VIX would have a positive effect on oil prices, with high statistical significance.
Turning towards the conditional variance equations, we observe that almost all oil prices possess both long-run and short-run persistence. GARCH terms are observed to be greater than ARCH terms, all at 1% confidence. This indicates that the spillover effect would have a long-term volatility tendency rather than short-term variance persistence.
5. Conclusions
Using the OLS and GARCH approach to examine the influence of GPR, EPU, and VIX on global energy price from January 2001 to December 2024, we find the following conclusion. First, global oil prices are positively susceptible to GPRT at the moderate level of threats of risk in a monthly interval, while EPU would have a very weak, although statistically significant, impact on the returns of oil prices. Meanwhile, VIX would have a negative effect on oil prices with high statistical significance. Second, GPR, EPU, and VIX affect the volatility of oil prices, with a stronger long-term tendency compared to short-term persistence. Last, there exists a short-persistent bi-directional spillover effect between BRENT and DUBAI. Lastly, GPR would have a weak negative spillover effect on WTI and DUBAI, while EPU and VIX would have a strong positive effect.
Initially, using quantile-related and regime-switching methods confirmed that GPR has a nonlinear impact on oil prices. With our results, we were able to identify at what level of GPRT is there a statistically significant relationship with oil prices. Next, we can illustrate the impact on different quantiles, monitoring the impact on oil prices at different levels of risk. Finally, with the GARCH model, we can explore that GPR, EPU, and VIX affect oil price volatility, which is greater than their effect on oil price returns. Furthermore, the influence of oil prices on volatility has both long-term and short-run variance persistence; however, the long-term effect proves to be more significant compared to short-term variance, as GARCH is observed to have both stronger and statistically more significant effects compared to ARCH.
On the other hand, investigating the dynamics between different oil prices with the DCC MGARCH Model, we also observe interesting interactions between oil prices that few other research papers have shown. The result shows that there is a long-term bi-directional spillover impact between the global average oil prices of BRENT and DUBAI. In addition, the model illustrates the mean-reverting nature of BRENT. Meanwhile, WTI would have no spillover effect on other oil prices. However, regarding the role of GPR, EPU, and VIX in this spillover relationship, they are found to have a statistically significant influence on these spillover relationships.
Author Contributions
Conceptualization, M.T.L. and H.M.H.L.; methodology, M.T.L.; formal analysis, M.T.L. and H.Q.N.; investigation, L.N.N.P.; writing—original draft preparation, M.T.L.; writing—review and editing, H.M.H.L.; supervision, H.Q.N. All authors have read and agreed to the published version of the manuscript.
Funding
This research received no external funding.
Institutional Review Board Statement
Not applicable.
Informed Consent Statement
Not applicable.
Data Availability Statement
The data presented in this study are available in: https://www.matteoiacoviello.com/gpr.htm (accessed on 18 Febuary 2025) [8]; https://www.policyuncertainty.com/ (accessed on 18 Febuary 2025) [9] and https://www.worldbank.org/en/research/commodity-markets (accessed on 18 Febuary 2025) [10].
Conflicts of Interest
The authors declare no conflict of interest.
Abbreviations
The following abbreviations are used in this manuscript:
| GPR | Geopolitical Risk Index |
| GPRA | Geopolitical Risk Act Index |
| GPRT | Geopolitical Risk Threat Index |
| MSCI | Morgan Stanley Capital International |
| EPU | Economic Policy Uncertainty |
| WTI | Western Texas Intermediate Crude oil price |
| VIX | Chicago Board Options Exchange Volatility Index |
| OLS | Ordinary Least Square model |
| ARCH | Autoregressive conditional heteroskedasticity |
| GARCH | Generalized autoregressive conditional-heteroskedasticity |
| MGARCH | Multivariate generalized autoregressive conditional-heteroskedasticity |
| AR | Autoregressive |
Appendix A
Table A1.
Search term for GPR, GPRA, and GPRT. (Caldara and Iacoviello (2018)) [1].
Table A1.
Search term for GPR, GPRA, and GPRT. (Caldara and Iacoviello (2018)) [1].
| Search Category | Search Terms |
|---|---|
| Geopolitical Threats | Geopolitical AND (risk* OR concern* OR tension* OR uncertainty*) “United States” AND tensions AND (military OR war OR geopolitical OR coup OR guerrilla OR warfare) AND (“Latin America” OR “Central America” OR “South America” OR Europe OR Africa OR “Middle East” OR “Far East” OR Asia) |
| Nuclear Threats | (“nuclear war” OR “atomic war” OR “nuclear conflict” OR “atomic conflict” OR “nuclear missile*”) AND (fear* OR threat* OR risk* OR peril* OR menace*) |
| War Threats | “war risk*” OR “risk* of war” OR “fear of war” OR “war fear*” OR “military threat*” OR “war threat*” OR “threat of war” (“military action” OR “military operation” OR “military force”) AND (risk* OR threat*) |
| Terrorist Threats | “Terrorist threat*” OR “threat of terrorism” OR “terrorism menace” OR “menace of terrorism” OR “terrorist risk” OR “terror risk” OR “risk of terrorism” OR “terror threat*” |
| War Acts | “Beginning of the war” OR “outbreak of the war” OR “onset of the war” OR “escalation of the war” OR “start of the war”(war OR military) AND “air strike”(war OR battle) AND “heavy casualties” |
| Terrorist Acts | “Terrorist act” OR “terrorist acts” |
*Note: The truncation character (*) denotes a search including all possible endings of a word, e.g. “threat*” includes “threat” or “threats” or “threatening”.
References
- Caldara, D.; Iacoviello, M. Measuring Geopolitical Risk. Am. Econ. Rev. 2018, 112, 1194–1225. [Google Scholar] [CrossRef]
- Baker, S.R.; Bloom, N.; Davis, S.J. Measuring Economic Policy Uncertainty. Q. J. Econ. 2016, 131, 1593–1636. [Google Scholar] [CrossRef]
- Brenner, M.; Galai, D. New Financial Instruments for Hedge Changes in Volatility. Financ. Anal. J. 1989, 45, 61–65. [Google Scholar] [CrossRef]
- Kannadhasan, M.; Das, D. Do Asian emerging stock markets react to international economic policy uncertainty and geopolitical risk alike? A quantile regression approach. Financ. Res. Lett. 2020, 34, 101276. [Google Scholar] [CrossRef]
- Qian, L.; Zeng, Q.; Li, T. Geopolitical risk and oil price volatility: Evidence from Markov-switching model. Int. Rev. Econ. Financ. 2022, 81, 29–38. [Google Scholar] [CrossRef]
- Bollerslev, T. Generalized autoregressive conditional heteroskedasticity. J. Econom. 1986, 31, 307–327. [Google Scholar] [CrossRef]
- Smales, L.A. Geopolitical risk and volatility spillovers in oil and stock markets. Q. Rev. Econ. Financ. 2021, 80, 358–366. [Google Scholar] [CrossRef]
- Geopolitical Risk (GpR) Index. Available online: https://www.matteoiacoviello.com/gpr.htm (accessed on 18 February 2025).
- Economic Policy Uncertainty. Available online: https://www.policyuncertainty.com/ (accessed on 18 February 2025).
- World Bank Group. Available online: https://www.worldbank.org/en/research/commodity-markets (accessed on 18 February 2025).

Disclaimer/Publisher’s Note: The statements, opinions and data contained in all publications are solely those of the individual author(s) and contributor(s) and not of MDPI and/or the editor(s). MDPI and/or the editor(s) disclaim responsibility for any injury to people or property resulting from any ideas, methods, instructions or products referred to in the content. |
© 2025 by the authors. Licensee MDPI, Basel, Switzerland. This article is an open access article distributed under the terms and conditions of the Creative Commons Attribution (CC BY) license (https://creativecommons.org/licenses/by/4.0/).