Abstract
The present work presents a new approach to studying the structural integrity of a Ti-6Al-4V alloy obtained by Selective Laser Melting (SLM). This approach is based on the intrinsic addictive manufacturing defects analysis obtained by nanotomography, the experimental S-N curve, and the small crack growth Murakami and Endo model. Also, two counting methods of 3D manufacturing intrinsic defects were considered. The simulation of S-N curves and the small crack propagation curves were successfully obtained. New models for predicted fatigue limit were developed, one using the (3D) variable area of the defects observed as the total area and the other using the total project area. The 3D total surface area counting method presents more conservative values on crack propagation studies, so it is recommended for integrity studies of Ti6Al4V alloy obtained by SLM.
1. Introduction
The increased interest in additive manufacturing (AM) has been evidenced by the economic growth of this set of processes [1], which has gained strong acceptance in various industries, particularly in the aeronautical sector [2]. This new three-dimensional (3D) manufacturing paradigm makes it possible to obtain highly complex geometries capable of optimising components’ weight, structural integrity, and functionality while reducing lead time and waste [3,4]. The aeronautical industry has been developing new solutions to improve the performance of their aircraft, where the results showed weight reductions in the manufactured components (Leading Edge Aviation Propulsion (LEAP) dual nozzle and hinge bracket) by more than 20%, followed by an increase in structural integrity [2,5].
However, with the progressive paradigm shift, the new mechanical and fatigue behaviours from advanced materials, such as Ti-6Al-4V, are being intensively researched [6,7]. Ti-6AL-4V alloy, manufactured by Selective Laser Melting (SLM), maintains a combination of characteristics that make it desirable for applications where optimal performance under extreme conditions is needed. These characteristics include high fatigue strength, good creep behaviour, low density, and excellent corrosion resistance. Nevertheless, the new manufacturing processes imply new types of intrinsic defects that must be studied [8,9].
Defects have a strong influence on the fatigue behaviour of the materials and authors, as Alves et al. [6], Matsunaga et al. [7], Tajiri et al. [10], Ueno et al. [11], and Morgado et al. [12] developed new models to predict fatigue limit of light metallic alloys. These models were based on the area of the defect and the first formulations proposed by Murakami [13,14] and presented in Equation (1).
where σw is the fatigue limit in MPa, Hv is the Vickers hardness in kgf/mm2, and area is the defect projected onto the plane perpendicular to the maximum tensile stress obtained considering the extreme value μm2.
Alves et al. [6] developed two new models of life prediction for a Ti-6Al-4V alloy manufactured by SLM based on the Murakami model and on experimental work. Nevertheless, the approach of Alves et al. [6] used nanotomography to acquire the defects’ shape, size, and quantity. The methodology used was based on SLM intrinsic defect analysis through three dimensions, and the total project volume area and the total volume of the defects were quantified.
Li et al. [15], on the other hand, validated the equations proposed by Murakami by adopting the area of the biggest defect as responsible for the fatigue failure of TC21 titanium alloy additively manufactured by Electron Beam Melting.
In 2023, Murakami and Endo [16] proposed a model to predict S-N curves without experimental fatigue tests based on a small crack growth model, represented in Equation (2), of various metallic materials and considering their influence on fatigue behaviour.
where da/dN is the crack propagation rate; C*, m*, and n* are constant universal values (C* = 10−4, m* = 2, n* = 1) [15]; σ is the applied stress amplitude; σw is the fatigue limit which decreases cycle by cycle with crack growth stress; and a is the crack size in terms of defect in μm.
The main objective of this research work was to develop simulation models to predict the S-N curve and fatigue limit of Ti-6Al-4V (TC4) manufactured by Selective Laser Melting (SLM) and analyse the influence of the intrinsic manufacturing defects counting methods in the predicted models. These simulation models were based on an intensive analysis of intrinsic manufacturing defects (using nanotomography) and the Murakami and Endo model. Two new fatigue limit prediction models have been developed and analysed. The new fatigue limit prediction models for the TC4 use the Murakami nomenclature and are uniquely based on Vickers’s hardness and the 3D intrinsic manufacturing defects obtained experimentally. Two new approaches of prediction crack propagation versus the number of cycles using the intrinsic SLM manufacturing defects and the two counting methods have also been obtained and analysed.
2. Methodology and Material
2.1. Research Methodology
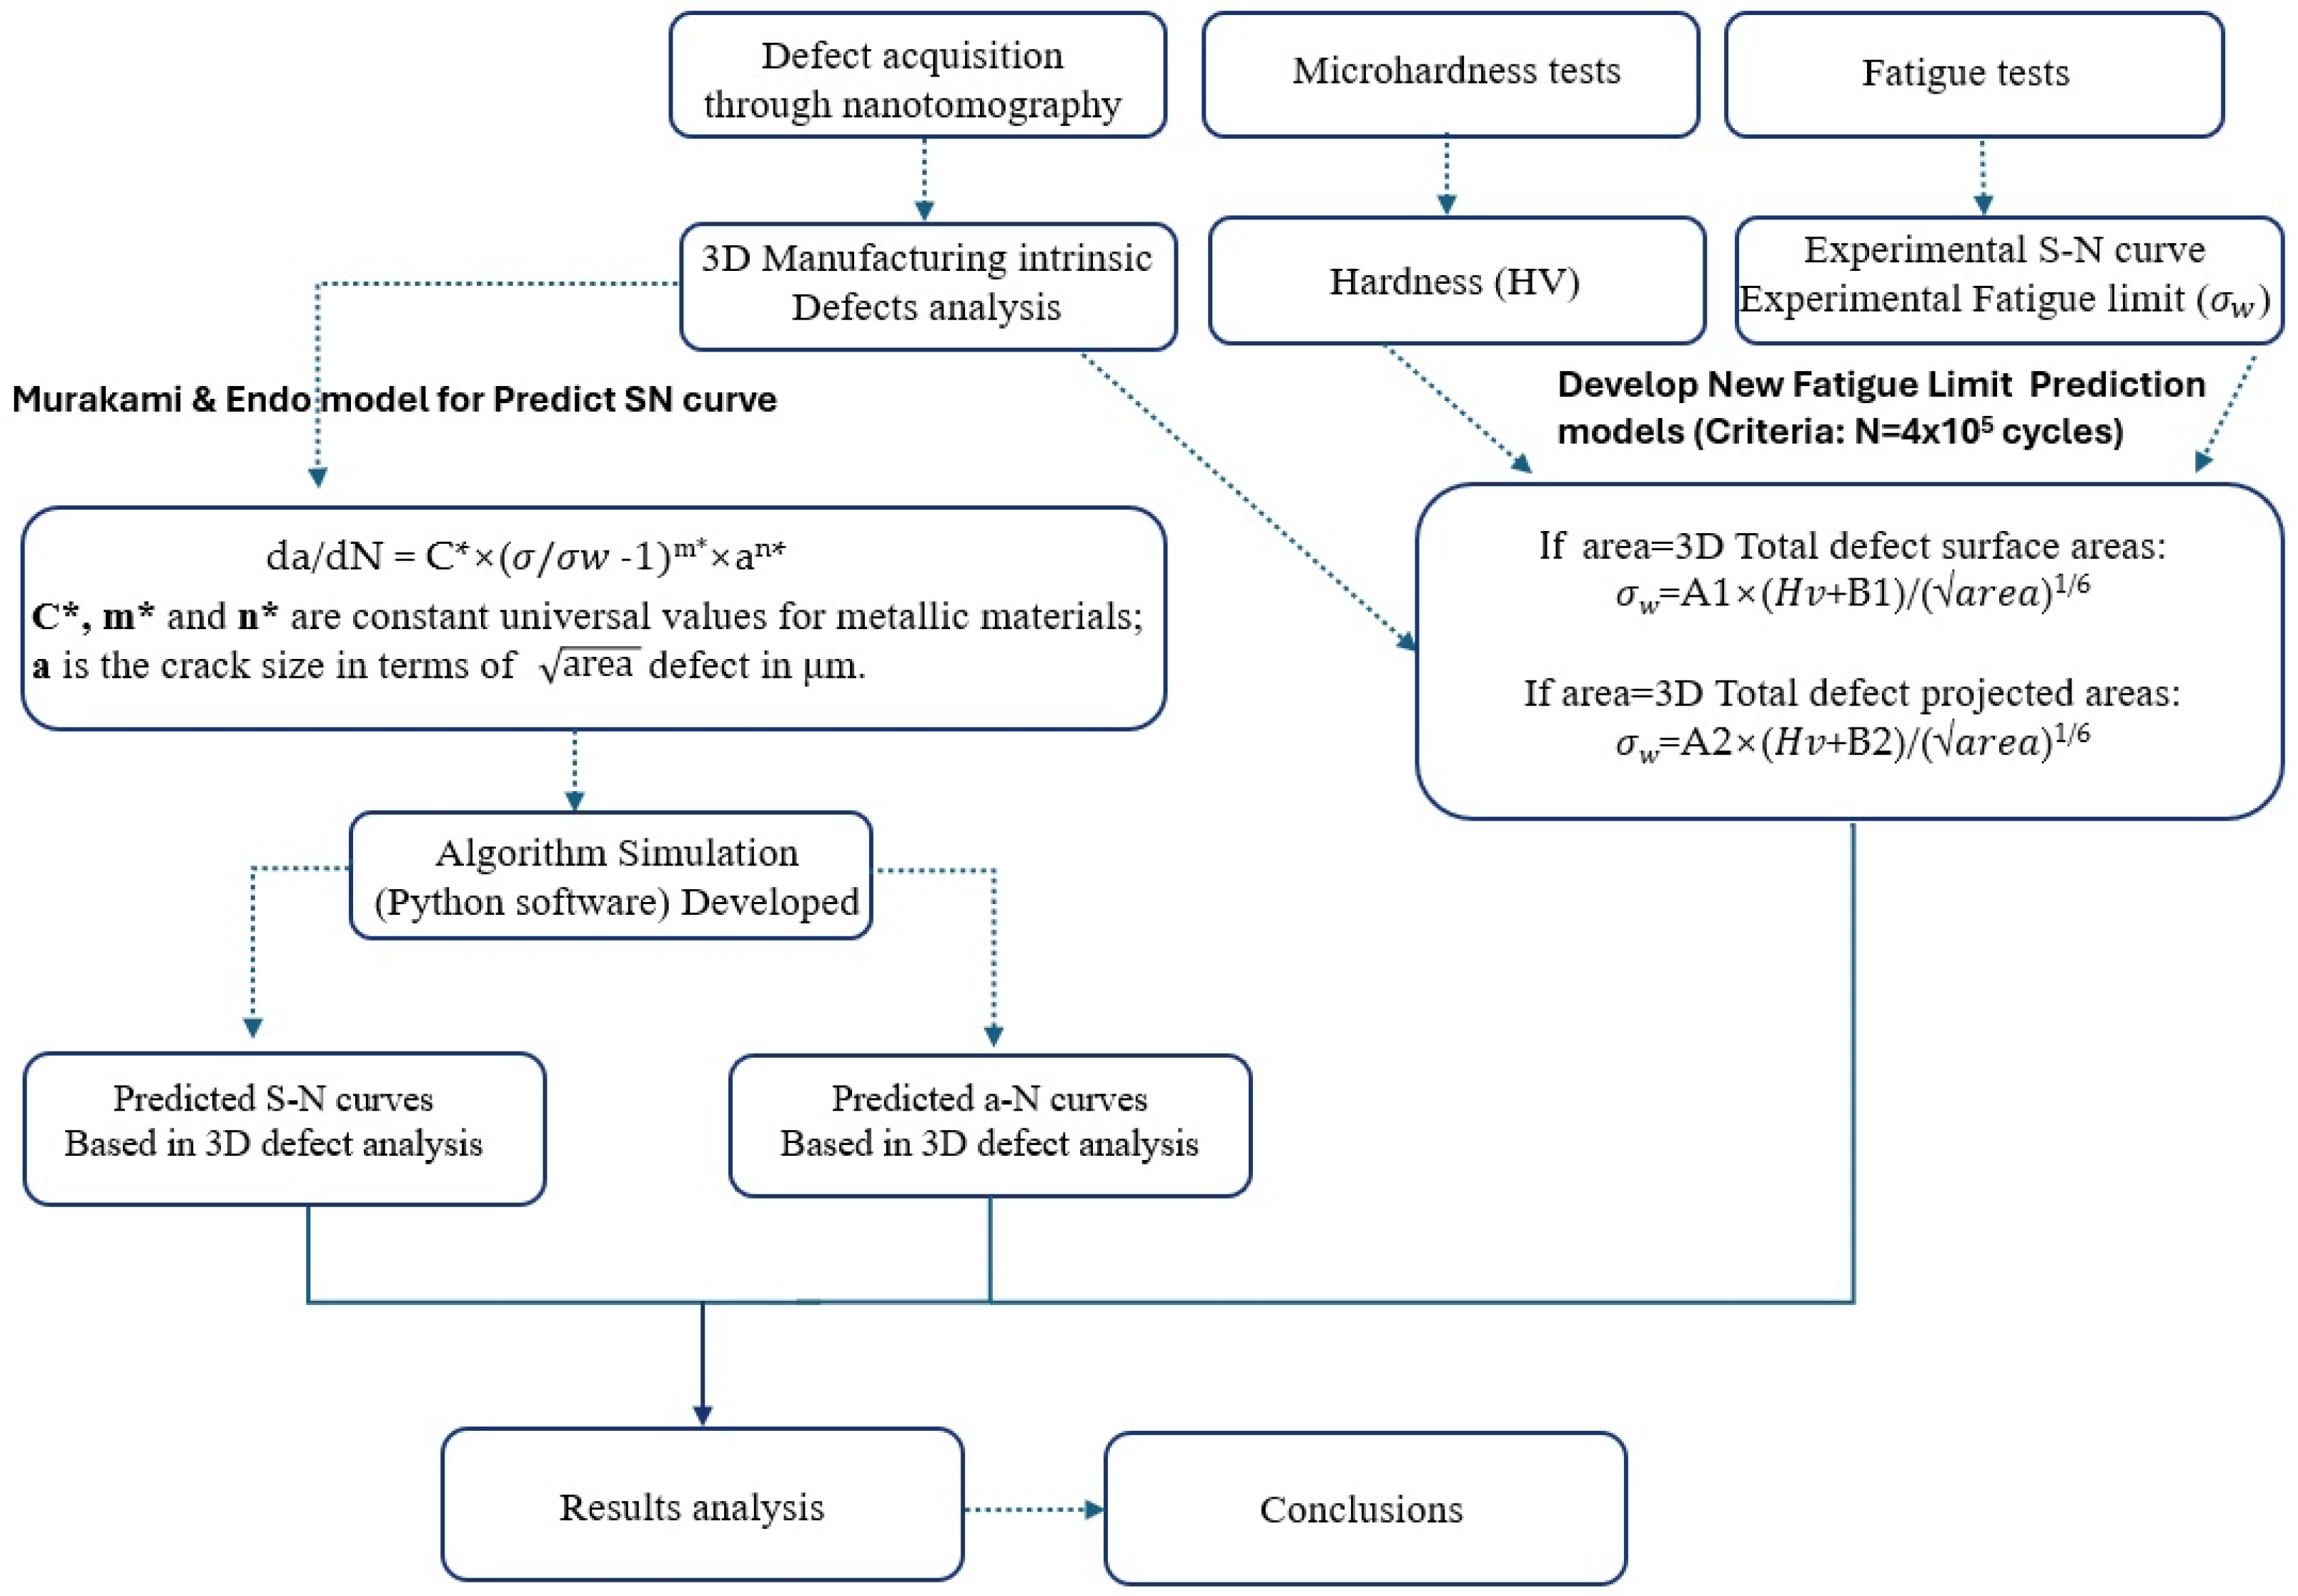
Figure 1 presents the research methodology used in this work. The research was divided into experimental and simulation work. With the experimental work obtained, Vicker’s hardness followed ASTM E3-11: 2017 [17] and ASTM E384-22 [18], S-N curves by fatigue tests followed ASTME8/8M-22 [19], and, respectively, the fatigue limit considering criteria of the N = 4 × 10⁵ cycles to failure, and a quantitative and qualitative study of the 3D SLM intrinsic defects through nanotomography analyses.
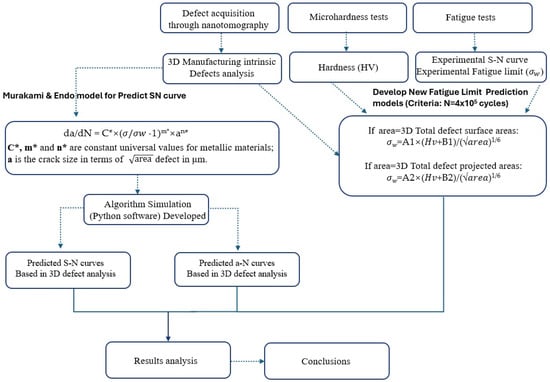
Figure 1.
The research methodology used to study the influence of the SLM manufacturing intrinsic defect in the fatigue behaviour and crack propagation of Ti6Al4V.
The experimental data and Murakami nomenclature [13,14,16] were the inputs in the development of the new simulation algorithm. The Python software version 3.10 was used to perform the innovative algorithm based on two counting methods of the 3D intrinsic manufacturing defects (3D total surface area and total defect projected area) and developed two new fatigue limit prediction models, predicted S-N curves and predicted a-N curves, as presented in Figure 1. Finally, the analysis of the results and conclusions were presented.
2.2. Material
In this research, titanium alloy powder, Ti-6Al-4V, was used (Table 1). This powder was spherical, with diameters ranging from 20 to 53 μm.

Table 1.
Ti6Al4V grade 23 chemical composition.
The manufacturing process used for specimens’ production was Selective Laser Melting (SLM) in an inert atmosphere. The equipment E-PLUS EP-M150 of SHINING 3D, made in Beijing, China, was used. The principal SLM parameters (hatched vector) used were Laser Power of 180 W, Scan Speed of 1000 mm/s, Layer Thickness of 0.03 mm, and Up-Skin Energy Density of 75 J/mm3.
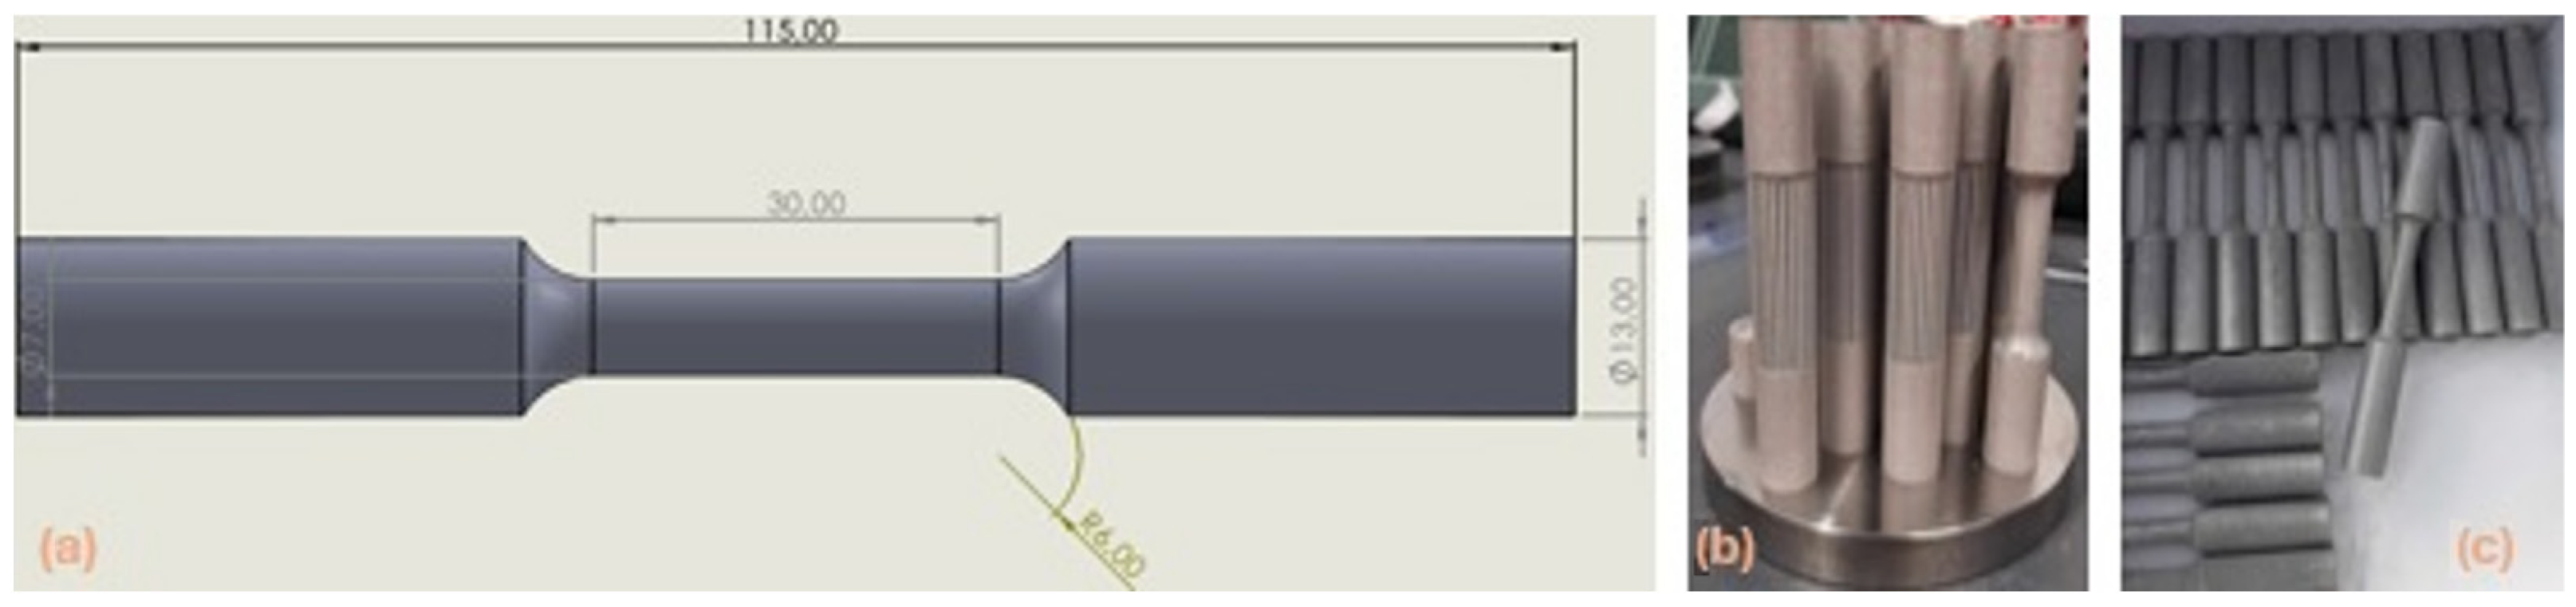
The specimens manufactured followed the ASTM E8/E8M-22 [19] geometry recommendations (Figure 2) and were used to obtain Vickers’ hardness value, tensile and fatigue proprieties and study the intrinsic, manufacturing defects by nanotomography, as described in Section 3.
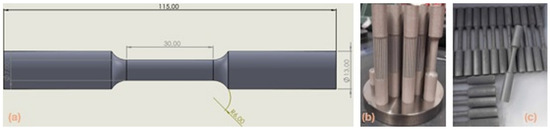
Figure 2.
Ti6Al4V specimens’ geometry, obtained by SLM: (a) dimension in mm; (b) specimens obtained by SLM during the cutting process; (c) final SLM specimens.
3. Experimental Proceeding
The Vickers’ hardness tests were performed according to ASTM E3-11: 2017 [17] and ASTM E384-22 [18], and the value obtained is HV = HV 0.5.
Young Modulus E = 106 GPa, Yield Strength σy = 1009 MPa, Ultimate Tensile Strength σr = 1129 MPa, Frature Strength σf = 853 MPa, Yield Strain εy = 0.0112, elongation ε = 0.1456, Strain hardening exponent n = 0.0446, and Strength coefficient H = 1358 MPa were determined by mechanical tests according ASTME8/8M-22 [19].
From the fatigue tests, we obtained the S-N curve, expressed by Equation (3) (S is the strength and N is the number of cycles), and the fatigue limit, σw = 143.825 MPa, for criteria of N = 4 × 10⁵ cycles.
S = 6298.5 N−0.293
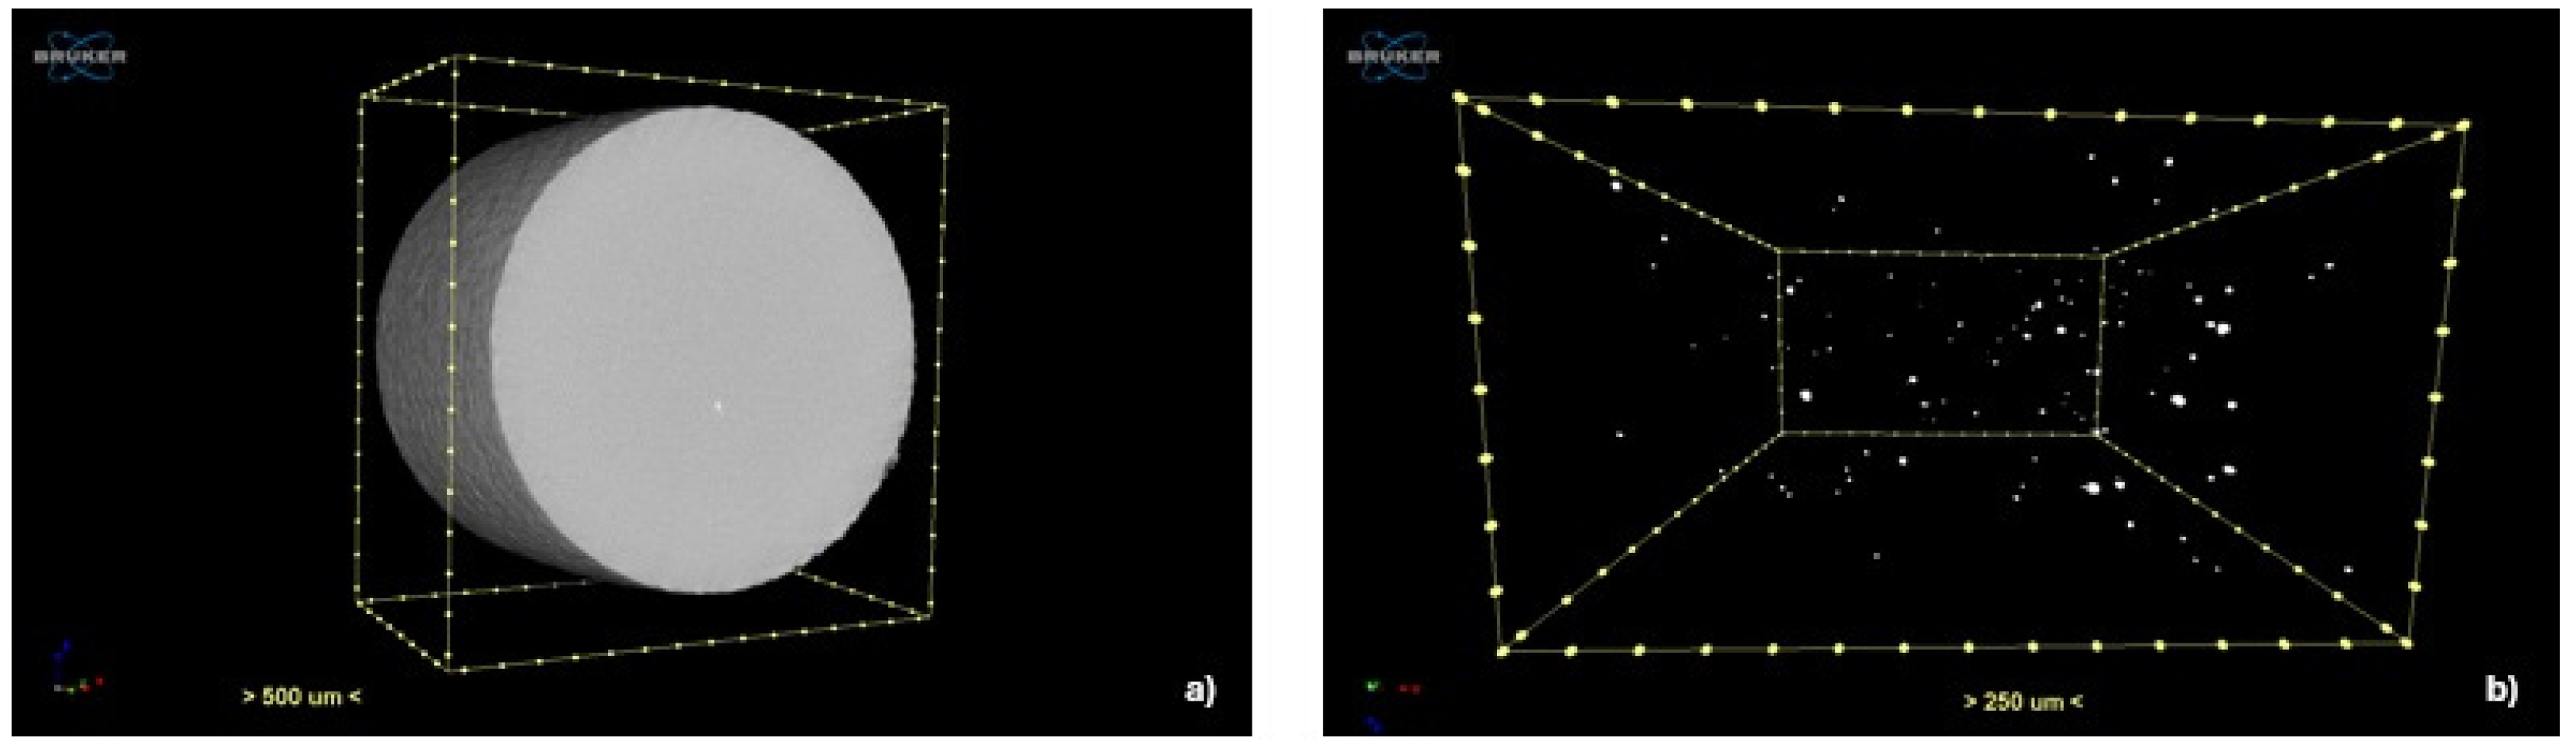
Brucker’s SKYSCAN2214 nanotomography, manufactured in Coventry, UK, captured three-dimensional (3D) defect characteristics. A FlatPanel camera was used, with a voltage of 130 kV, a current intensity of 66 μA, and a Cu filter. The resolution was 3.37 μm, with an exposure of 3200 ms and 360° rotation with a step of 0.4°. The images were processed using NRecon reconstruction version 1.6.10.4, CTvox visualisation version, 3.1, and CTAn analysis software version 1.12, which Brucker also supplied (Figure 3).

Figure 3.
Intrinsic defects analysis of the Ti6Al4V specimens through nanotomography: (a) object image by NRecon reconstruction; (b) pores image by Brucker.
The results of the nanotomography analysis showed only pores with a spherical shape, and two counting methods were performed, the projected and the surface area of the total 3D defects observed (Table 2).
Table 2.
Quantitative results of the manufacturing defects counting methods observed through nanotomography.
4. Simulation
4.1. Fatigue Life Prediction Models Based on 3D Intrinsic Manufacturing Defects
Throughout Equation (1) and the experimental data of the SN curve (Equation (3)), Vickers’ hardness (Hv), and the two counting methods of the total SLM manufacturing defects, as shown in Section 2, two models for fatigue limit were developed (Table 3); first model is presented by the Equation (4), and apply the variable area as the total surface area in μm2 of the defects observed in nanotomography; and the second model developed the Equation (5) and use the total projected area in μm2 of the intrinsic manufacturing defects observed by nanotomography as variable area. For both 3D manufacturing intrinsic defects counting methods, the new models presented errors, referring to experimental data of less than 1%, and the 3D total surface area method of counting defects gave better results with an error of less than 0.37%.
Table 3.
New prediction fatigue limit models of Ti6Al4V, considering the failure criteria for N = 4 × 10⁵ cycles.
4.2. S-N Curves Prediction Based on 3D Intrinsic Manufacturing Defects
In order to analyse the effects of the defects in the S-N curve, the two counting methods presented in Table 2 were taken into consideration in the prediction model presented in Equation (2), as shown in Figure 1.
The simulation models were developed in Python language using numerical integration, more precisely the Euler method, with 50 points. For the integration, the initial crack length, ai, was defined as the project and surface total area of the manufacturing defects obtained by nanotomography (Table 2), and the final crack length value, af, was defined as the highest admissible crack length, with a proposed value of 1 mm.
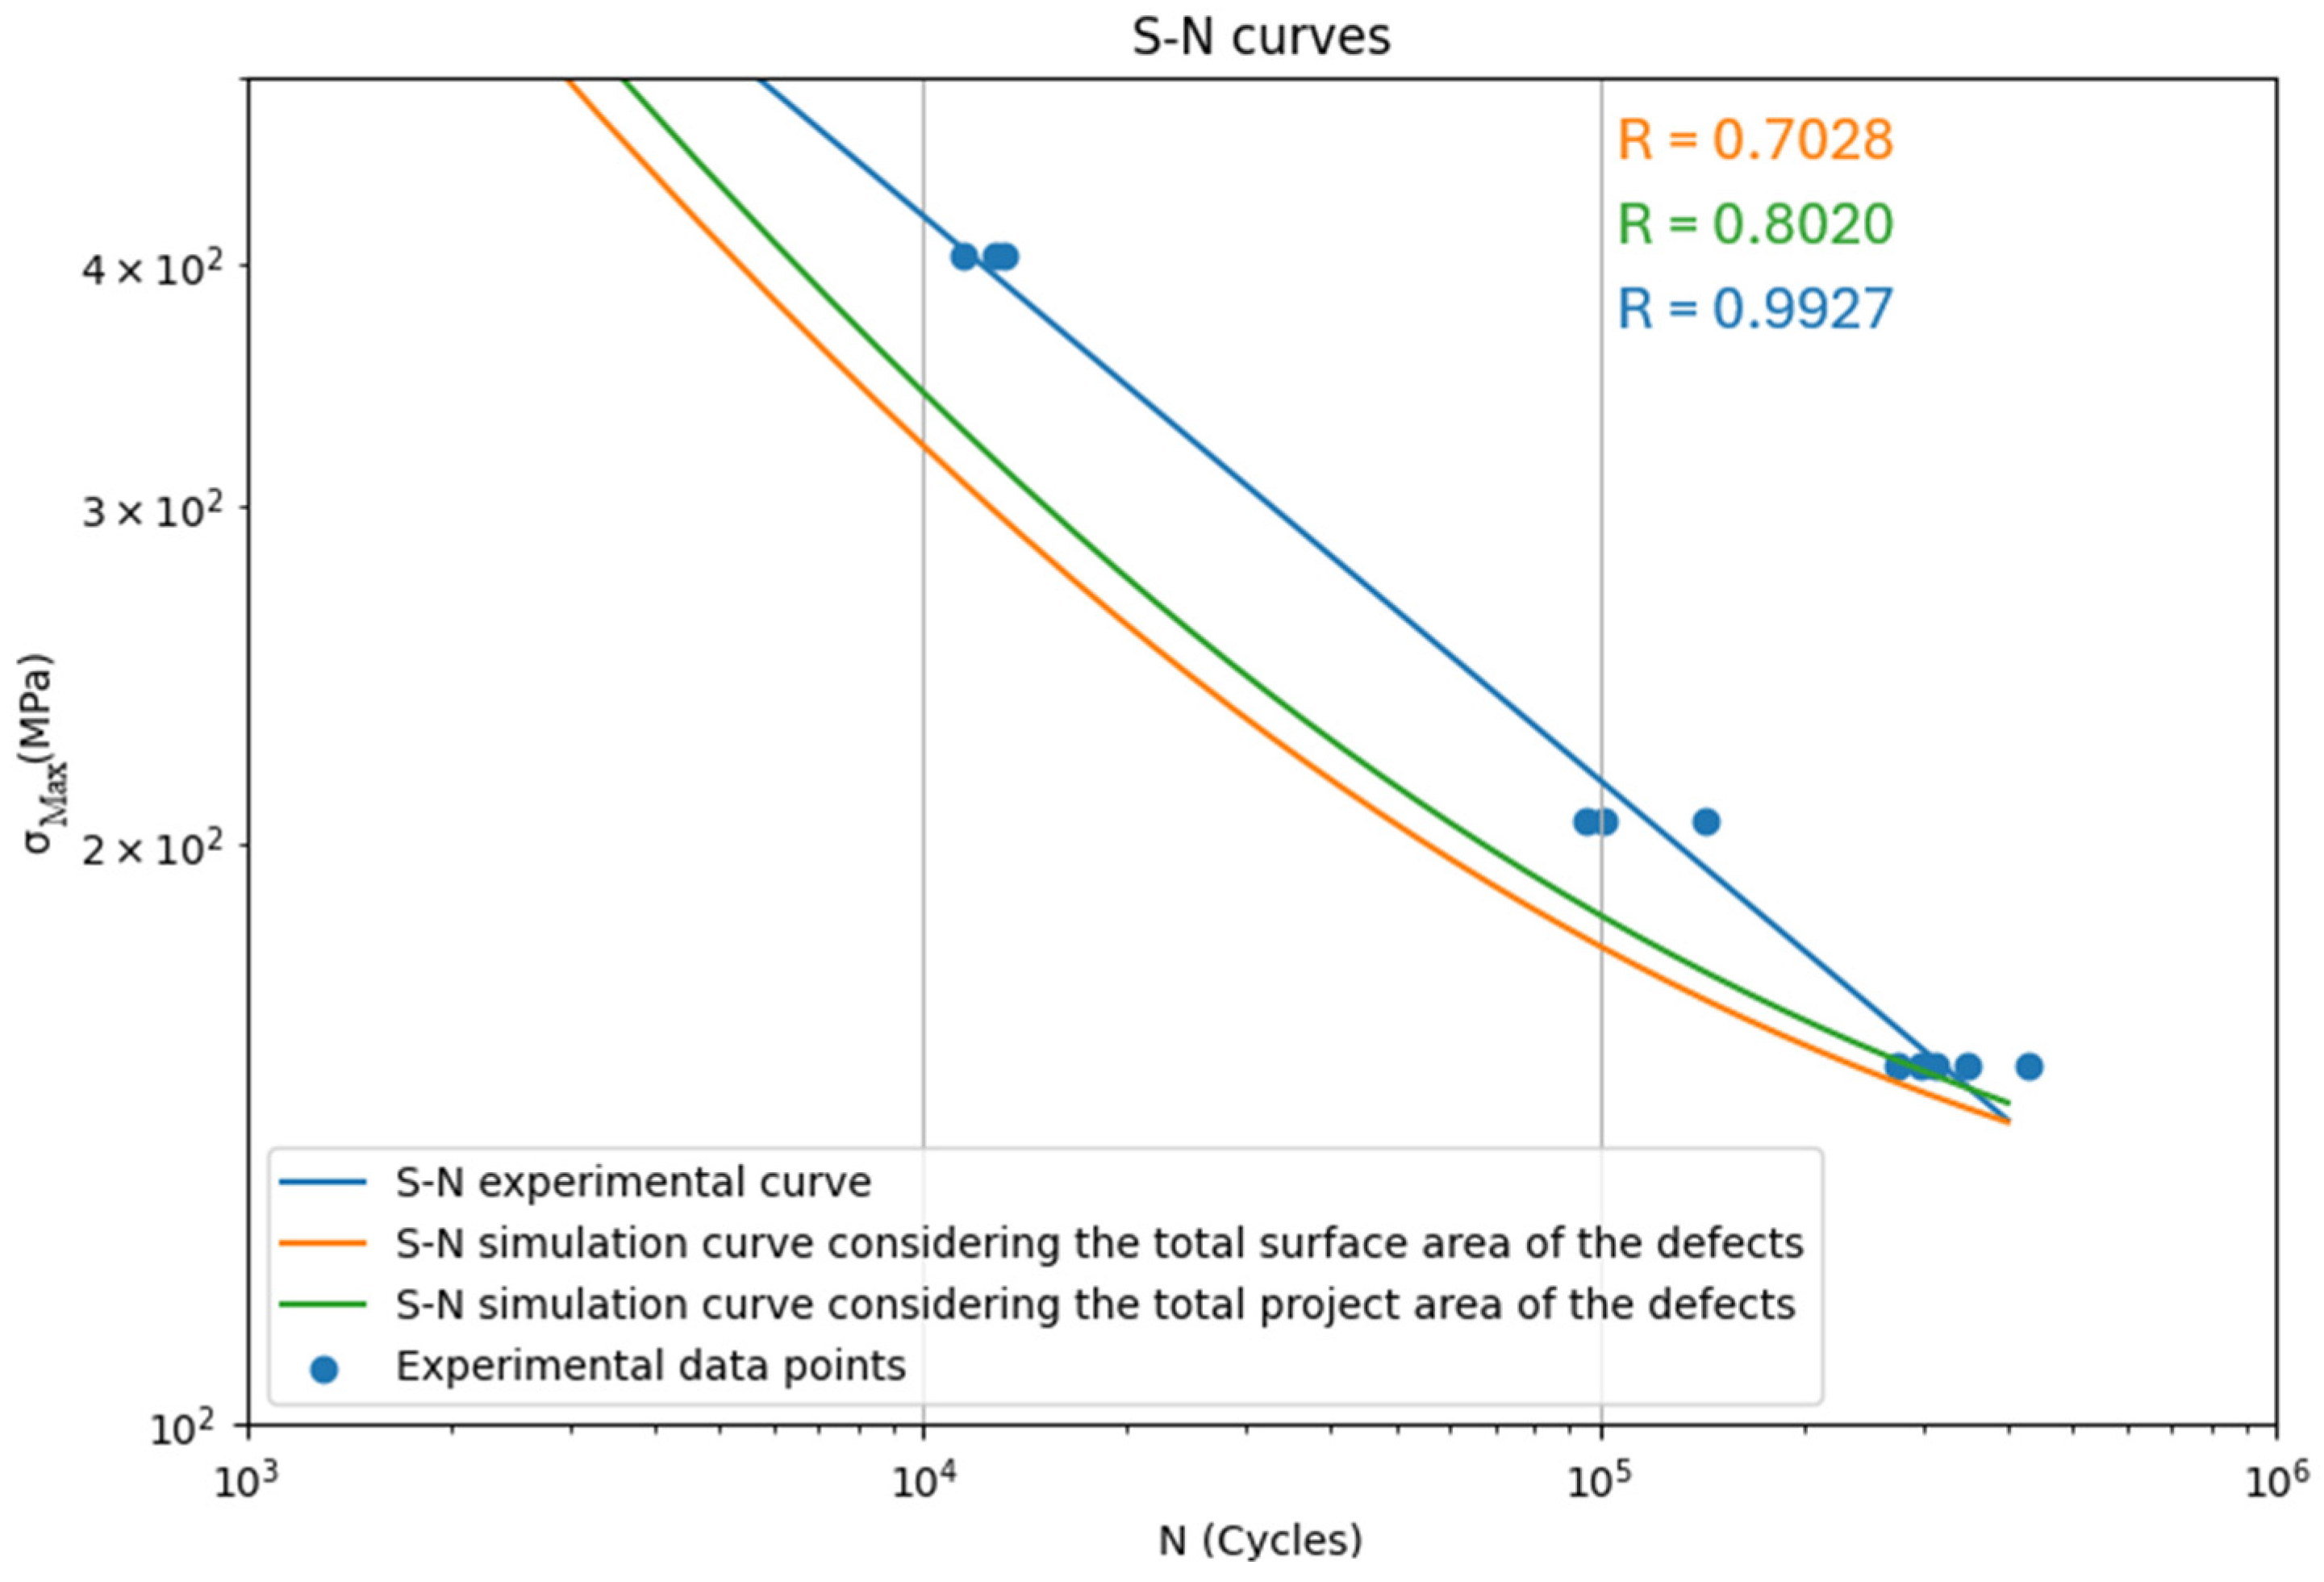
Figure 4 shows the S-N curves obtained by experimental procedure and simulation.
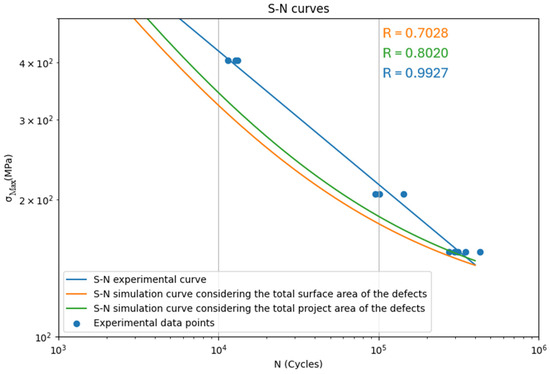
Figure 4.
Comparison of experimental and predicted S-N curves for a Ti-6Al-4V alloy manufactured by SLM.
The error analysis between the experimental and predicted S-N curves is presented in Table 4. The criteria for validating the errors between the experimental and prediction SN curves due to different counting methods for 3D surface and projected areas was the maximum error of 13%.
Table 4.
Errors analysis between experimental and predicted S-N curves.
From Table 4, it can be concluded that the fatigue limit value for both counting methods and, consequently, the two simulation models are valid, and the predicted S-N curves are valid only for cycle fatigue lower than N = 103 cycles and higher than N = 2 × 10⁵ cycles. The predicted fatigue limit presents an error of less than 2% for both 3D counting methods in relation to experimental data, considering the failure criteria of N = 4 × 10⁵ cycles. The errors between the two S-N curve predictions due to different counting methods for 3D surface and projected areas have a minimum error of 2.28% at N = 4 × 10⁵ cycles and a maximum error of 7.23% at N = 3 × 10³ cycles.
4.3. Crack Propagation Curves Prediction Based on 3D Intrinsic Manufacturing Defects
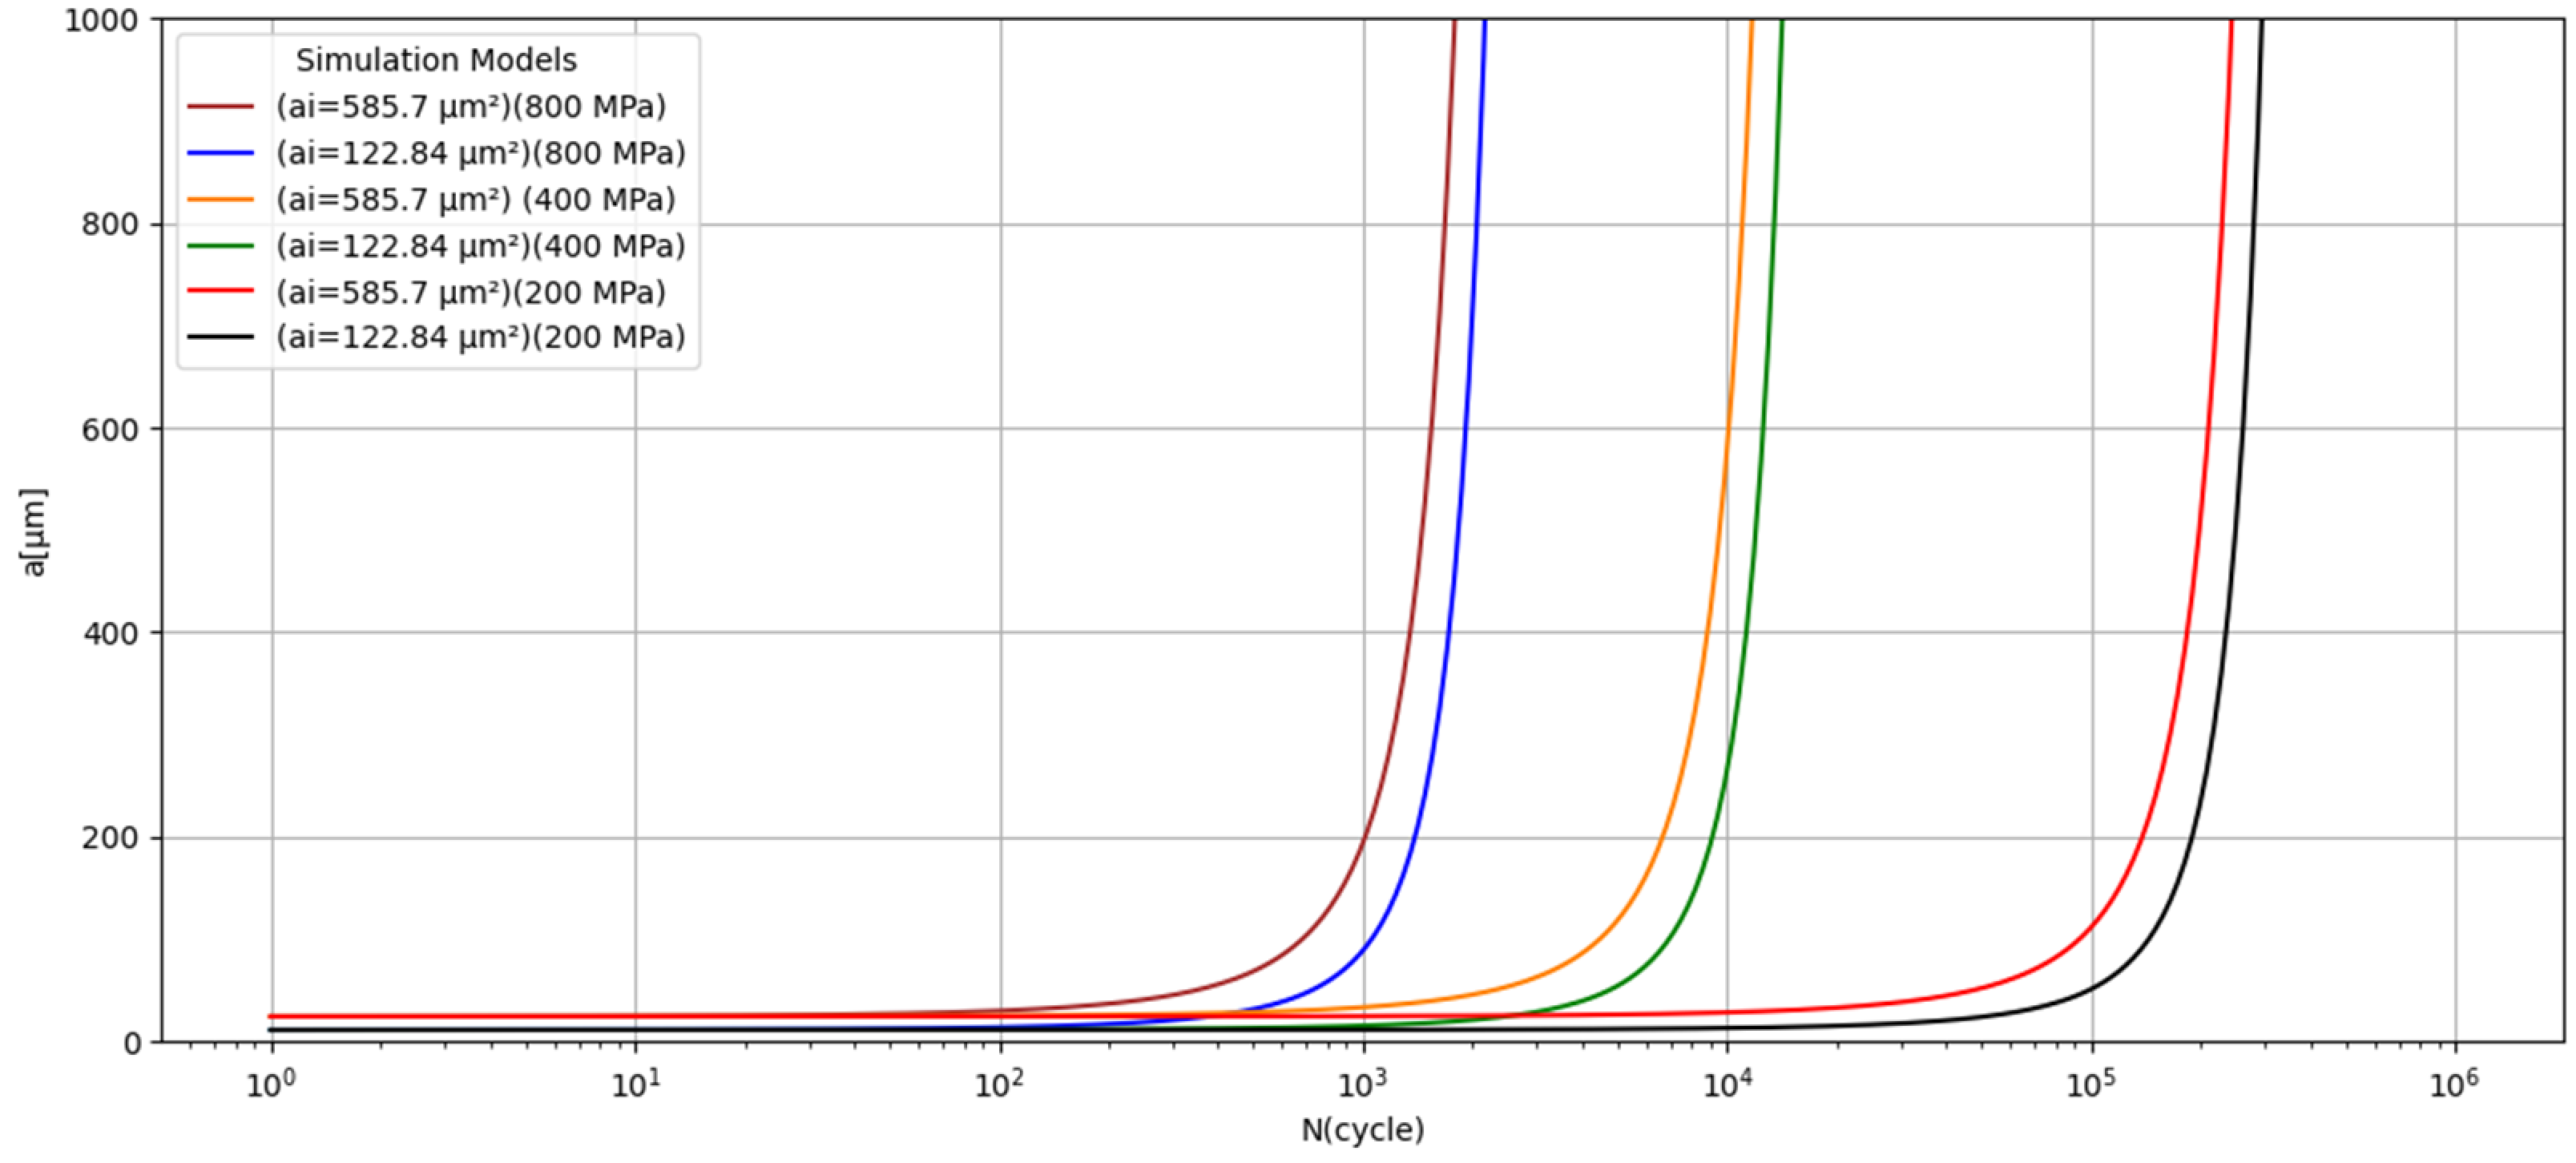
The simulations of the crack propagation starting on manufacturing defects considering the 3D counting methods (surface and projected area) and finish for a crack length of af = 1 mm were developed (Figure 5).

Figure 5.
Crack propagation simulation for applied strength of 200 MPa, 400 MPa and 800 MPa for a Ti-6Al-4V alloy manufactured by SLM.
The predicted a-N curves (Figure 5) show that the method of defect analysis is an important parameter. The 3D total surface area counting method presents more conservative values. As can be observed in Figure 5, the crack propagation starting on a manufacturing defect and ending on af = 1 mm for high stresses (800 MPa), medium stresses (400 MPa), and low stresses (200 MPa) have an expected duration of N = 1 × 10³ cycles, N = 1 × 10⁴ cycles, and N = 1 × 10⁵ cycles, respectively.
5. Results and Discussion
From this research work, it is concluded that the 3D total surface area method of counting defects intrinsic to the SLM manufacturing process gives better results than the 3D total projected area in the predicted fatigue limit models. Nevertheless, for both 3D manufacturing defects counting methods, the two new models developed are valid with errors of less than 0.7%. In conclusion, two new predicted fatigue limit models for the Ti6Al4V manufactured by SLM were created for the criteria of failure of N = 4 × 10⁵ cycles successfully. These two innovative models are expressed by Equation (4) if the variable, area, is the (3D) total surface area of the defects observed in [μm2], and by Equation (5) if the variable, area, is the (3D) total projected area of the defects observed in [μm2], and both models consider the variable, Hv, as the Vickers’ hardness.
From the simulation results, it was concluded that the predicted S-N curves and crack propagation versus the number of cycles curves for both counting methods were determined with success. Moreover, when comparing the predicted SN curves of the Ti6Al4V using the two types of manufacturing defects counting, the error values were between 2% and 7%. Nevertheless, the 3D total surface area counting method presented the best results and more conservative values.
The a-N predicted curves show that the counting method of the intrinsic SLM defect is an important parameter. The 3D total surface area counting method presents more conservative values.
6. Conclusions
The methodology proposed in this research work for predicted fatigue behaviour and crack propagation, with nanotomography as an experimental technique to quantify and characterise the 3D intrinsic SLM manufacturing defects, was revealed to be a success.
The tomography, namely the nanotomography, was revealed to be appropriate and essential in characterising intrinsic manufacturing defects.
Two models for predicted fatigue life were obtained with success, considering the 3D total surface and project area of the intrinsic SLM defects. Both models can prevent the structural failure of the Ti6Al4V mechanical components produced by SLM.
With the crack propagation study, it was possible to estimate the structural durability of the component for different applied stresses.
In conclusion, the counting method for the intrinsic SLM defect is an important parameter. The 3D total surface area counting method presents more conservative values on crack propagation studies, so it is recommended for integrity studies of Ti6Al4V alloy obtained by SLM.
Author Contributions
Conceptualization, J.A. and T.M.; Methodology, J.A. and T.M.; Experimental Work, A.P., J.A., T.M. and M.P.; Formal Analysis, A.P., J.A., M.P. and T.M.; Investigation, A.P., J.A., T.M., M.P. and R.F.M.; Data Curation, A.P., J.A., T.M., M.P. and R.F.M.; Writing—Original Draft Preparation, A.P., J.A., T.M., M.P. and R.F.M.; Writing—Review and Editing, J.A. and T.M.; Supervision, T.M. All authors have read and agreed to the published version of the manuscript.
Funding
This research received no external funding.
Institutional Review Board Statement
Not applicable.
Informed Consent Statement
Not applicable.
Data Availability Statement
The data gathered in this study is available from the authors upon reasonable request for the following emails: teresa.morgado@isel.pt, tmorgado@dem.isel.ipl.pt, tlrcmm@gmail.com, jfg.alves@campus.fct.unl.pt.
Acknowledgments
The authors would like to thank the Polytechnic University of Lisbon, the Faculty of Science and Technology—Universidade NOVA de Lisboa, the Instituto Superior Técnico—Universidade de Lisboa, and the Polytechnic University of Leiria for the work carried out in the framework of the research centres UNIRE, UNIDEMI, CERENA and CDRSP respectively.
Conflicts of Interest
The authors declare no conflicts of interest.
References
- Blakey-Milner, B.; Gradl, P.; Snedden, G.; Brooks, M.; Pitot, J.; Lopez, E.; Leary, M.; Berto, F.; du Plessis, A. Metal additive manufacturing in aerospace: A review. Mater. Des. 2021, 209, 110008. [Google Scholar] [CrossRef]
- Vafadar, A.; Guzzomi, F.; Rassau, A.; Hayward, K. Advances in metal additive manufacturing: A review of common processes, industrial applications, and current challenges. Appl. Sci. 2021, 11, 1213. [Google Scholar] [CrossRef]
- Kumar, G.R.; Sathishkumar, M.; Vignesh, M.; Manikandan, M.; Rajyalakshmi, G.; Ramanujam, R.; Arivazhagan, N. Metal additive manufacturing of commercial aerospace components—A comprehensive review. Proc. Inst. Mech. Eng. Part E J. Process. Mech. Eng. 2022, 237, 441–454. [Google Scholar] [CrossRef]
- Fruggiero, F.; Lambiase, A.; Bonito, R.; Fera, M. The load of sustainability for Additive Manufacturing processes. Procedia Manuf. 2020, 41, 375–382. [Google Scholar] [CrossRef]
- Tomlin, M.; Meyer, J. Topology Optimization of an Additive Layer Manufactured (ALM) Aerospace Part. In Proceedings of the 7th Altair CAE Technology Conference, Altair Engineering, Gaydon, UK, 10 May 2011. [Google Scholar]
- Alves, J.; Morgado, T.; Galvão, I.; Pereira, A.; Pereira, M. Development of a Life Prediction Model of Ti-6Al-4V obtained by Additive Manufacturing. Procedia Struct. Integr. 2024, 53, 236–245. [Google Scholar] [CrossRef]
- Matsunaga, H.; Murakami, Y.; Kubota, M.; Lee, J.-H. Fatigue Strength of Ti-6 Al-4V Alloys Containing Small Artificial Defects. Mater. Sci. Res. Int. 2003, 9, 263–269. [Google Scholar]
- Gong, H.; Nadimpalli, V.K.; Rafi, K.; Starr, T.; Stucker, B. Micro-CT Evaluation of Defects in Ti-6Al-4V Parts Fabricated by Metal Additive Manufacturing. Technologies 2019, 7, 44. [Google Scholar] [CrossRef]
- George, A.; Trevisan Mota, M.; Maguire, C.; O’Callaghan, C.; Roche, K.; Papakostas, N. Using Voxelisation-Based Data Analysis Techniques for Porosity Prediction in Metal Additive Manufacturing. Appl. Sci. 2024, 14, 4367. [Google Scholar] [CrossRef]
- Tajiri, A.; Nozaki, T.; Uematsu, Y.; Kakiuchi, T.; Nakajima, M.; Nakamura, Y.; Tanaka, H. Fatigue Limit Prediction of Large Scale Cast Aluminum Alloy A356. Procedia Mater. Sci. 2014, 3, 924–929. [Google Scholar] [CrossRef]
- Ueno, A.; Nishida, M.; Miyakawa, S.; Yamada, K.; Kikuchi, S. Fatigue Limit Estimation of Aluminium Die-Casting Alloy by Means of √area Method. J. Soc. Mater. Sci. Jpn. 2014, 63, 844–849. [Google Scholar] [CrossRef]
- Morgado, T.; Paulo, D.; Velhinho, A.; Pereira, M.; Mourão, A. Fatigue Limit Prediction Models of 6060 Aluminium Extruded Alloy. Procedia Struct. Integr. 2022, 42, 1545–1551. [Google Scholar] [CrossRef]
- Murakami, Y.; Kodama Konuma, S. Quantitative evaluation of effects of non-metallic inclusions on fatigue strength of high strength steels. I: Basic fatigue mechanism and evaluation of correlation between the fatigue fracture stress and the size and location of non-metallic inclusions. Int. J. Fatigue 1989, 11, 291–298. [Google Scholar] [CrossRef]
- Murakami, Y.; Usuki, H. Quantitative evaluation of effects of non-metallic inclusions on fatigue strength of high strength steels. II: Fatigue limit evaluation based on statistics for extreme values of inclusion size. Int. J. Fatigue 1989, 11, 299–307. [Google Scholar] [CrossRef]
- Li, Q.; Liu, S.; Liao, B.; Nie, B.; Shi, B.; Qi, H.; Chen, D.; Liu, F. Effect of Pore Defects on Very High Cycle Fatigue Behavior of TC21 Titanium Alloy Additively Manufactured by Electron Beam Melting. Crystals 2023, 13, 1327. [Google Scholar] [CrossRef]
- Murakami, Y.; Endo, M. Prediction model of S-N curve without fatigue test or with a minimum number of fatigue tests. Eng. Fail. Anal. 2023, 154, 107647. [Google Scholar] [CrossRef]
- ASTM E3-11:2017; Standard Guide for Preparation of Metallographic Specimens. American Association State-ASTM International: West Conshohocken, PA, USA, 2017.
- ASTM E384-22; Standard Test Method for Microindentation Hardness of Materials. American Association State-ASTM International: West Conshohocken, PA, USA, 2022.
- ASTM E8/E8M-22; Standard Test Methods for Tension Testing of Metallic Materials. American Association State-ASTM International: West Conshohocken, PA, USA, 2022.
Disclaimer/Publisher’s Note: The statements, opinions and data contained in all publications are solely those of the individual author(s) and contributor(s) and not of MDPI and/or the editor(s). MDPI and/or the editor(s) disclaim responsibility for any injury to people or property resulting from any ideas, methods, instructions or products referred to in the content. |
© 2025 by the authors. Licensee MDPI, Basel, Switzerland. This article is an open access article distributed under the terms and conditions of the Creative Commons Attribution (CC BY) license (https://creativecommons.org/licenses/by/4.0/).