1. Introduction
The introduction of the more-electric aircraft (MEA) platform will cause a significant increase in the amount of electronic power being consumed by aircraft systems, which in turn will bring about a significant increase in the heat being dissipated by those same systems. The power dissipation from electrical components will be orders of magnitude higher than for conventional aircraft, even if high levels of efficiency are achieved.
In the ADENEAS project, the goal is to reduce mass for distributed MEA architectures. A key optimisation can be found when reconsidering technologies used in existing cooling systems. Here, we introduce a two-phase pumped cooling system as an option for cooling aircraft power electronics. Potential benefits of a two-phase cooling system compared to conventional cooling systems include (1) enabling high-heat-flux cooling of on-board power electronics; (2) transporting heat to ambient air instead of bleed air; and (3) more modular cooling system designs. Two-phase cooling technology was earlier shown to be applicable for two-phase cooling of the AMS02 particle detector on the ISS [
1], two-phase cooling of high-heat-flux power electronics [
2], and two-phase cooling of fuel cells for aerospace application [
3].
In this paper we analyse working fluids for a two-phase cooling system; the system masses of a two-phase and liquid mechanically pumped loop; system analyses of a two-phase pumped loop; and a two-phase cold plate design for high-heat-flux power electronics cooling. A successful technology demonstration for nominal and non-nominal scenarios is shown by testing.
2. Fluid Selection, System Analyses, and System Mass Comparison
2.1. System Description
For the heat transport from power electronics to ambient air, an evaporator, a two-phase mechanically pumped loop (two-phase MPL), and a fluid–air heat exchanger are used, as schematically shown in
Figure 1. In the evaporator, the latent heat of the refrigerant is used for absorbing the dissipated heat from the power electronics. The evaporator design will be discussed in
Section 3.2. The two-phase MPL transfers heat using a pump in the liquid part of the loop. Evaporation results in a vapour–liquid mixture in the line from the evaporator to the fluid–air heat exchanger. Using mass flow control, the vapour mass fraction in this two-phase line is 0.7 maximum. For a vapour mass fraction of 0.7, the two-phase flow regime is annular [
4], which ensures a high heat transfer coefficient at the channel wall in the evaporator. In the fluid–air heat exchanger, the absorbed heat is emitted to the airflow by condensing the two-phase fluid in minichannels. Note that the air heat exchanger sizing has a direct effect on the experienced air drag by the aircraft.
2.2. Fluid Selection
The boiling temperature in the two-phase MPL is controlled by the accumulator pressure. Therefore, the p-T saturation characteristic of fluids is taken into account in the fluid selection process. Ultimately, the fluid selection has a strong effect on system mass. In the fluid selection, various aspects of potential fluids have been analysed, concerning physical fluid properties, system characteristics (i.e., mass flow, tubing diameter), and health, safety, and environmental (HS&E) aspects. The considered fluids are sourced from NIST’s REFPROP database [
5]. The physical fluid properties can be combined into a single Figure of Merit for each fluid based on the methodology described in [
6].
Table 1 shows the results from the pre-selection of fluids. Considering a maximum NFPA rating of two or lower [
7], a low global warming potential (GWP), and good future availability, R1234zeE, R1234yf, and R1233zdE appear as primary choices. These HFOs have similar cooling performance. However, R1233zdE has a significantly lower pressure at the desired operating saturation temperature of 70 °C. System analyses were conducted with R1233zdE as the working fluid.
2.3. Two-Phase Mechanically Pumped Loop System Analyses
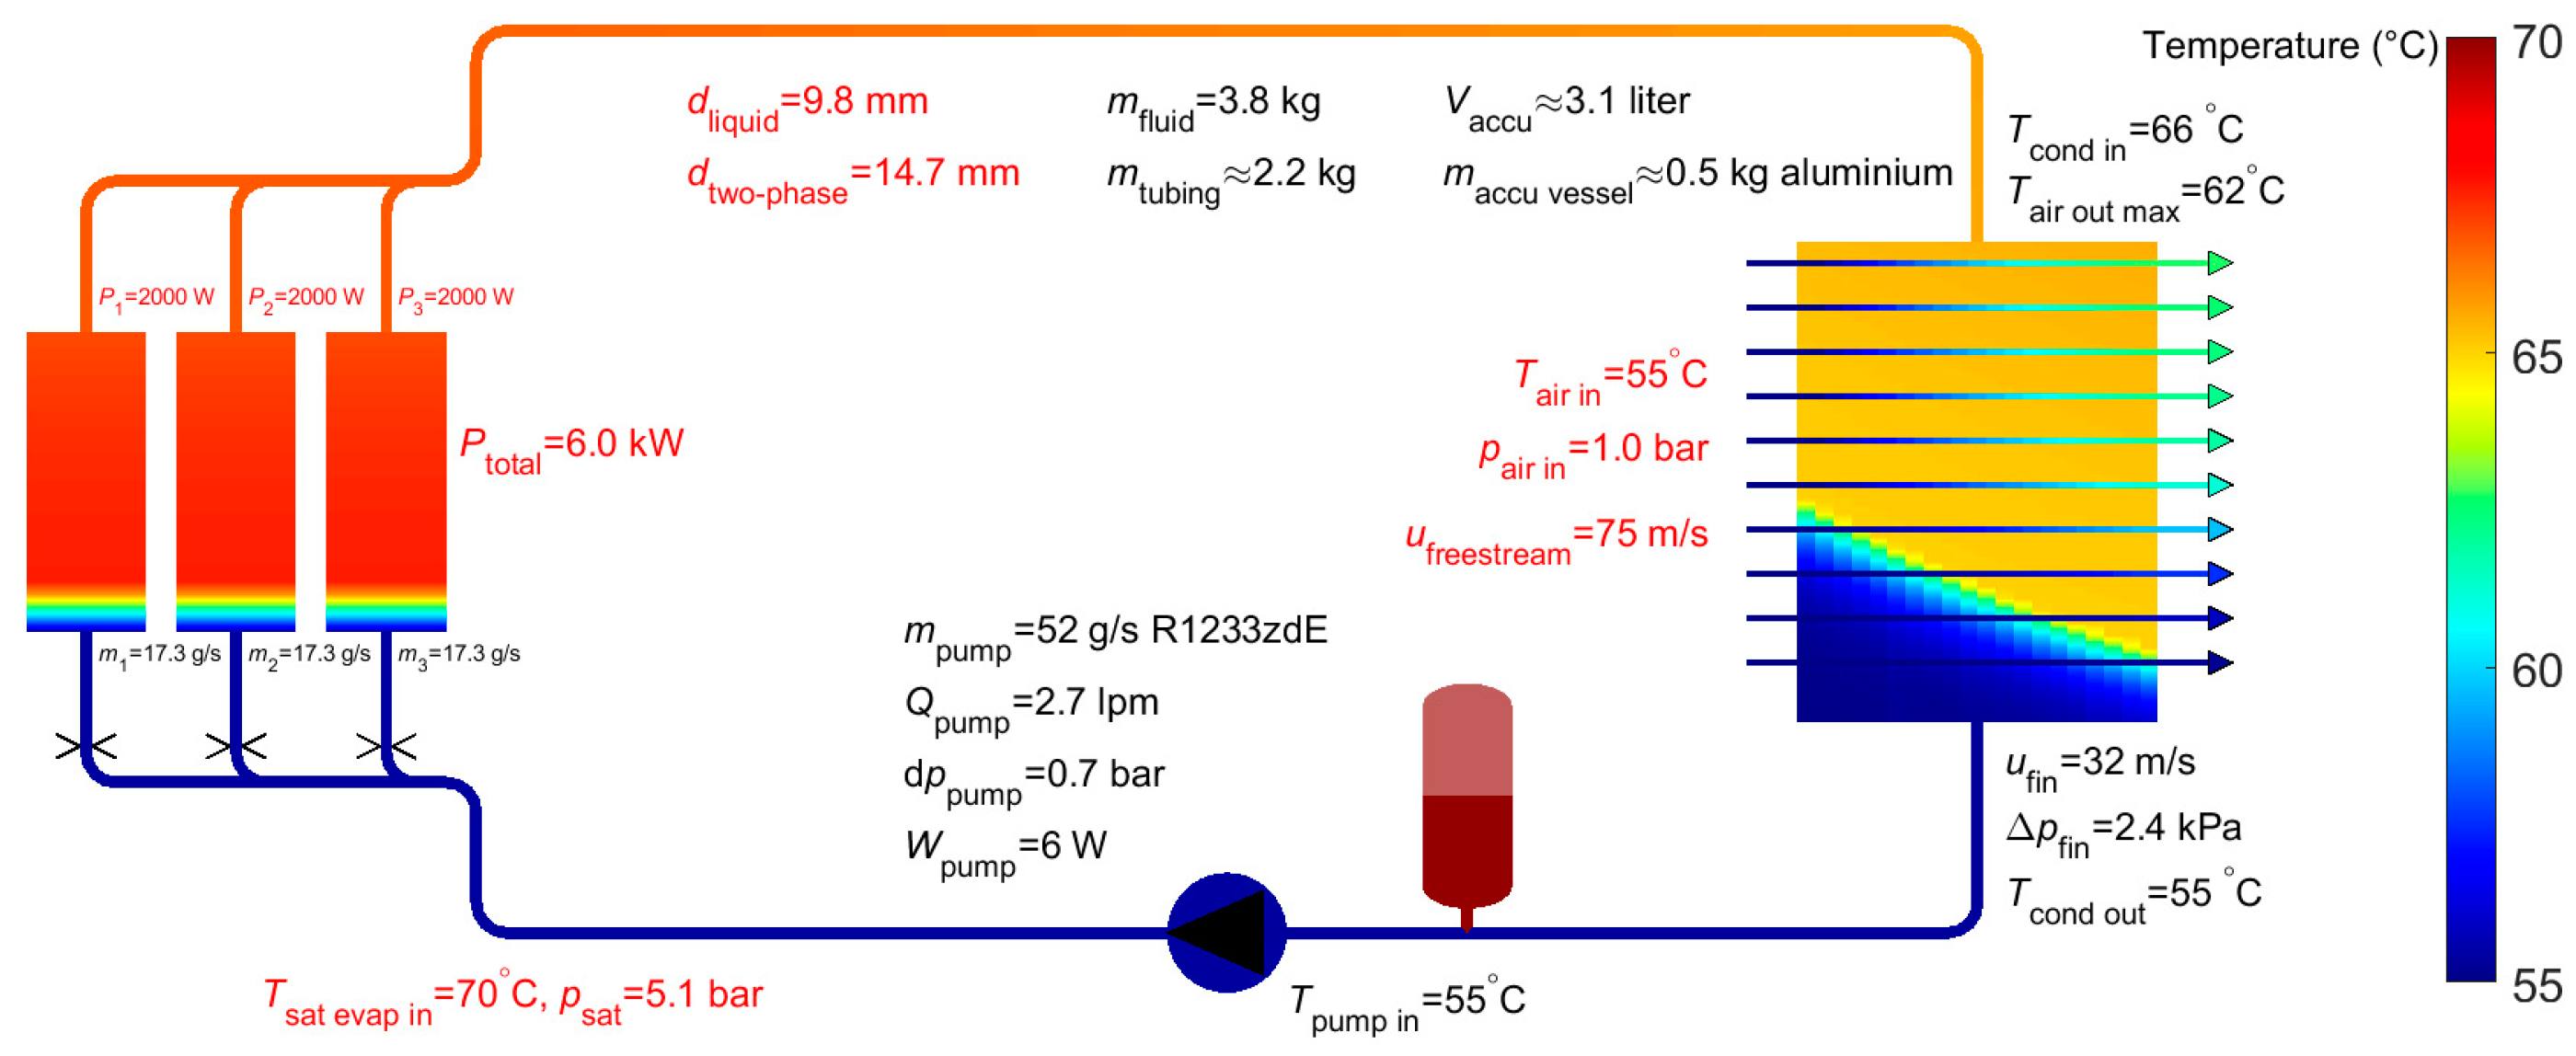
In
Figure 2 and
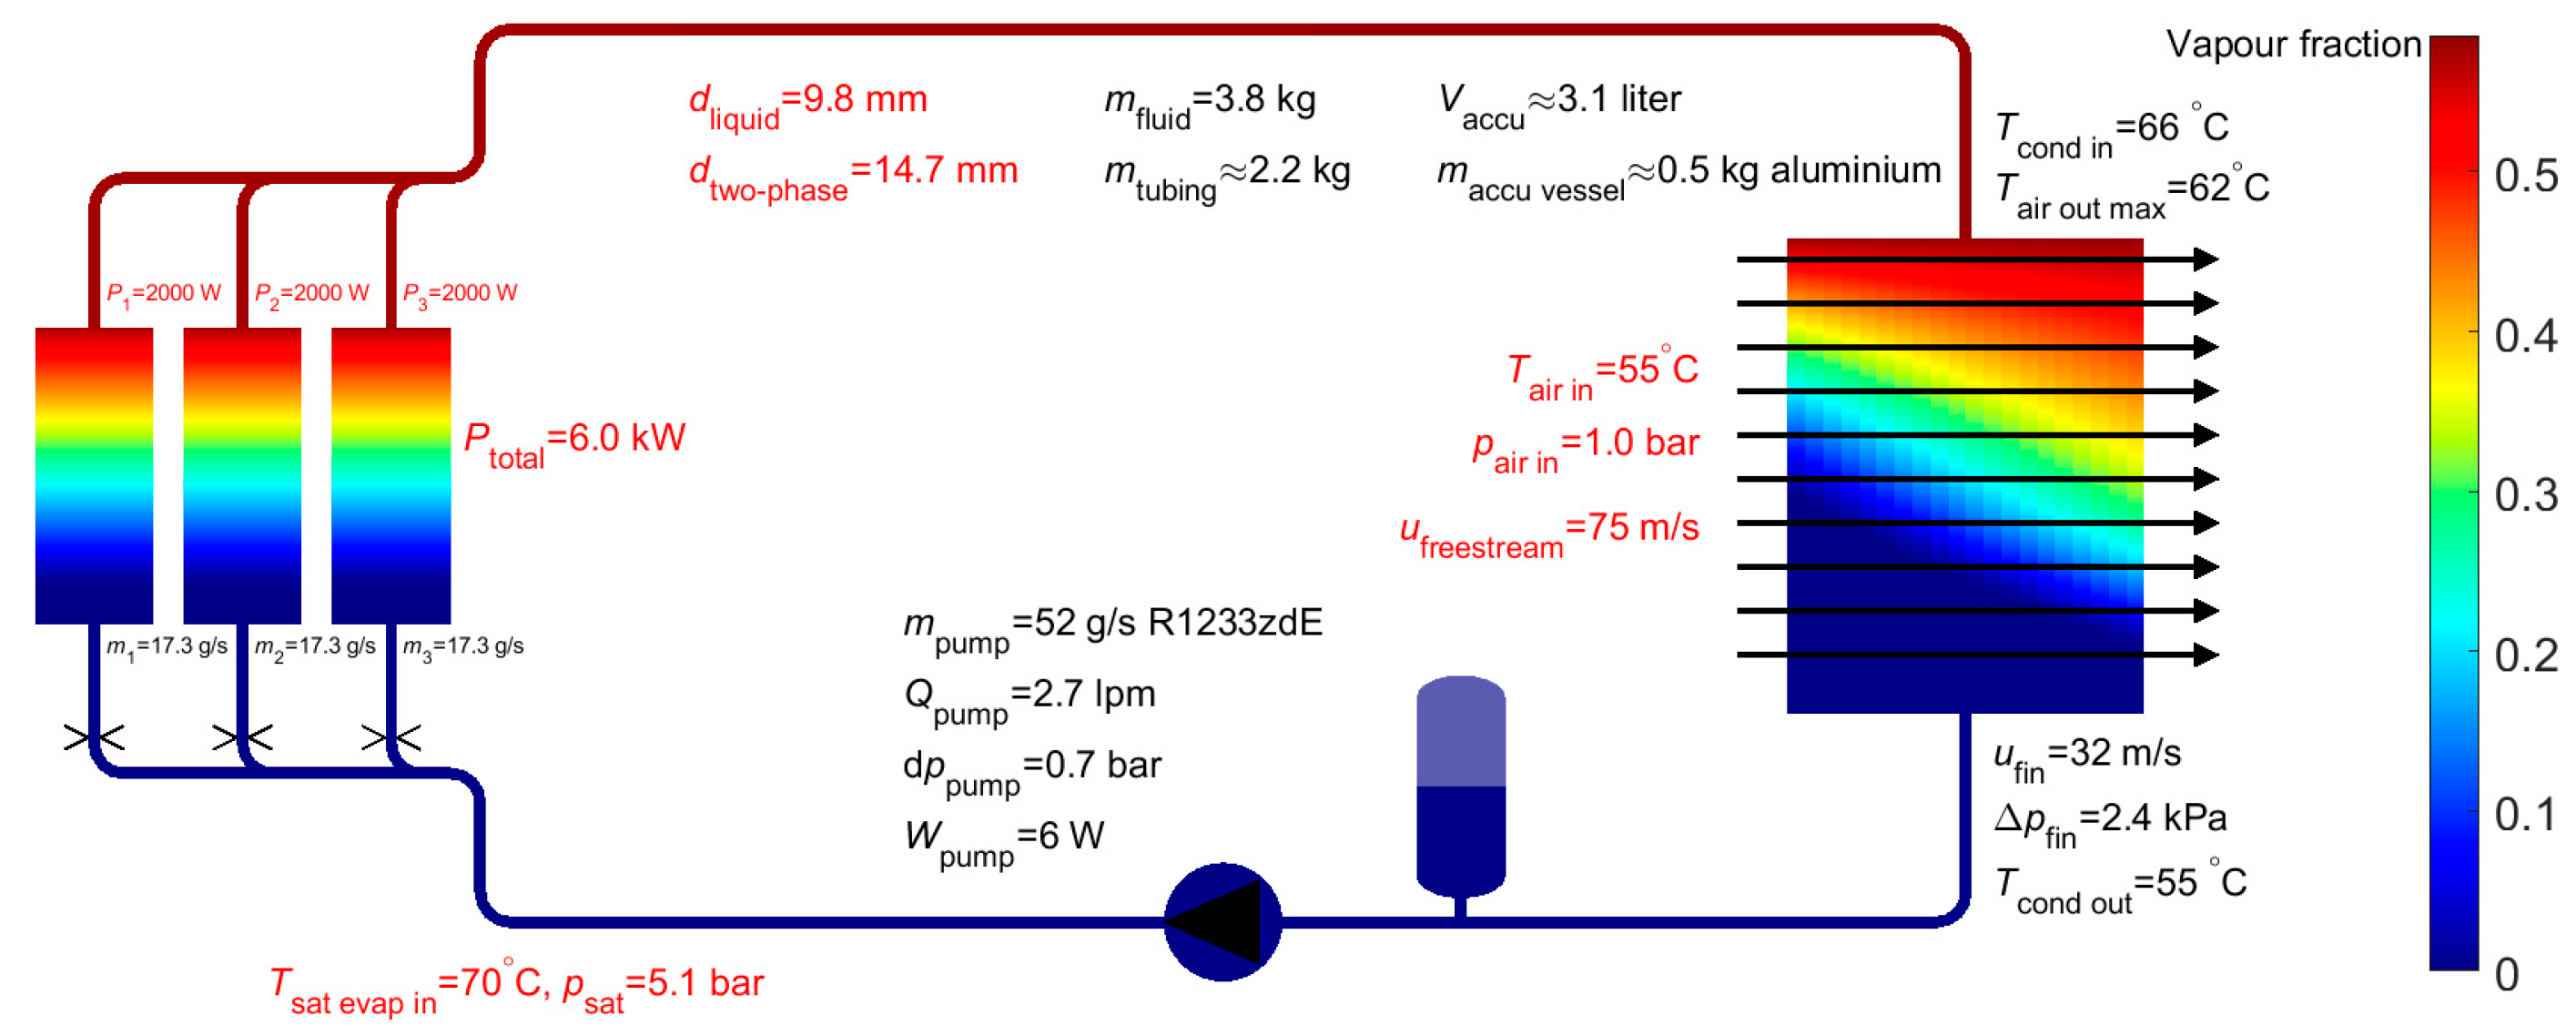
Figure 3, the conducted system analyses on the two-phase MPL with heat source and heat sink are shown, with R1233zdE as the working fluid. A saturation temperature of 70 °C is considered, resulting in a controlled system pressure of 5.1 bar(a). Three parallel heat sources are shown, each 2 kW. These three parallel heat sources each reflect the combined dissipated heat of two heat sources, with one on the topside and one on the bottom side of the cold plate section in a sandwich configuration. Three sections with 2 kW cooling performance result in a 6 kW total heat dissipation capacity. A flow of 52 g/s ensures a vapour mass fraction of a maximum of 0.7 at the cold plate outlet. In
Figure 3, the vapour mass fraction is shown, with a local maximum lower than 0.7 due to the 15 °C of subcooling at the cold plate inlet.
The simulation results show the steady-state performance prediction of the system at the maximum ambient temperature of 55 °C. A heat transfer of 6 kW is established. In the condenser, the fluid transfers its heat to the aircraft’s surrounding air, which results in subcooled R1233zdE at the outlet, required to ensure no cavitation in the pump.
2.4. System Mass Comparison
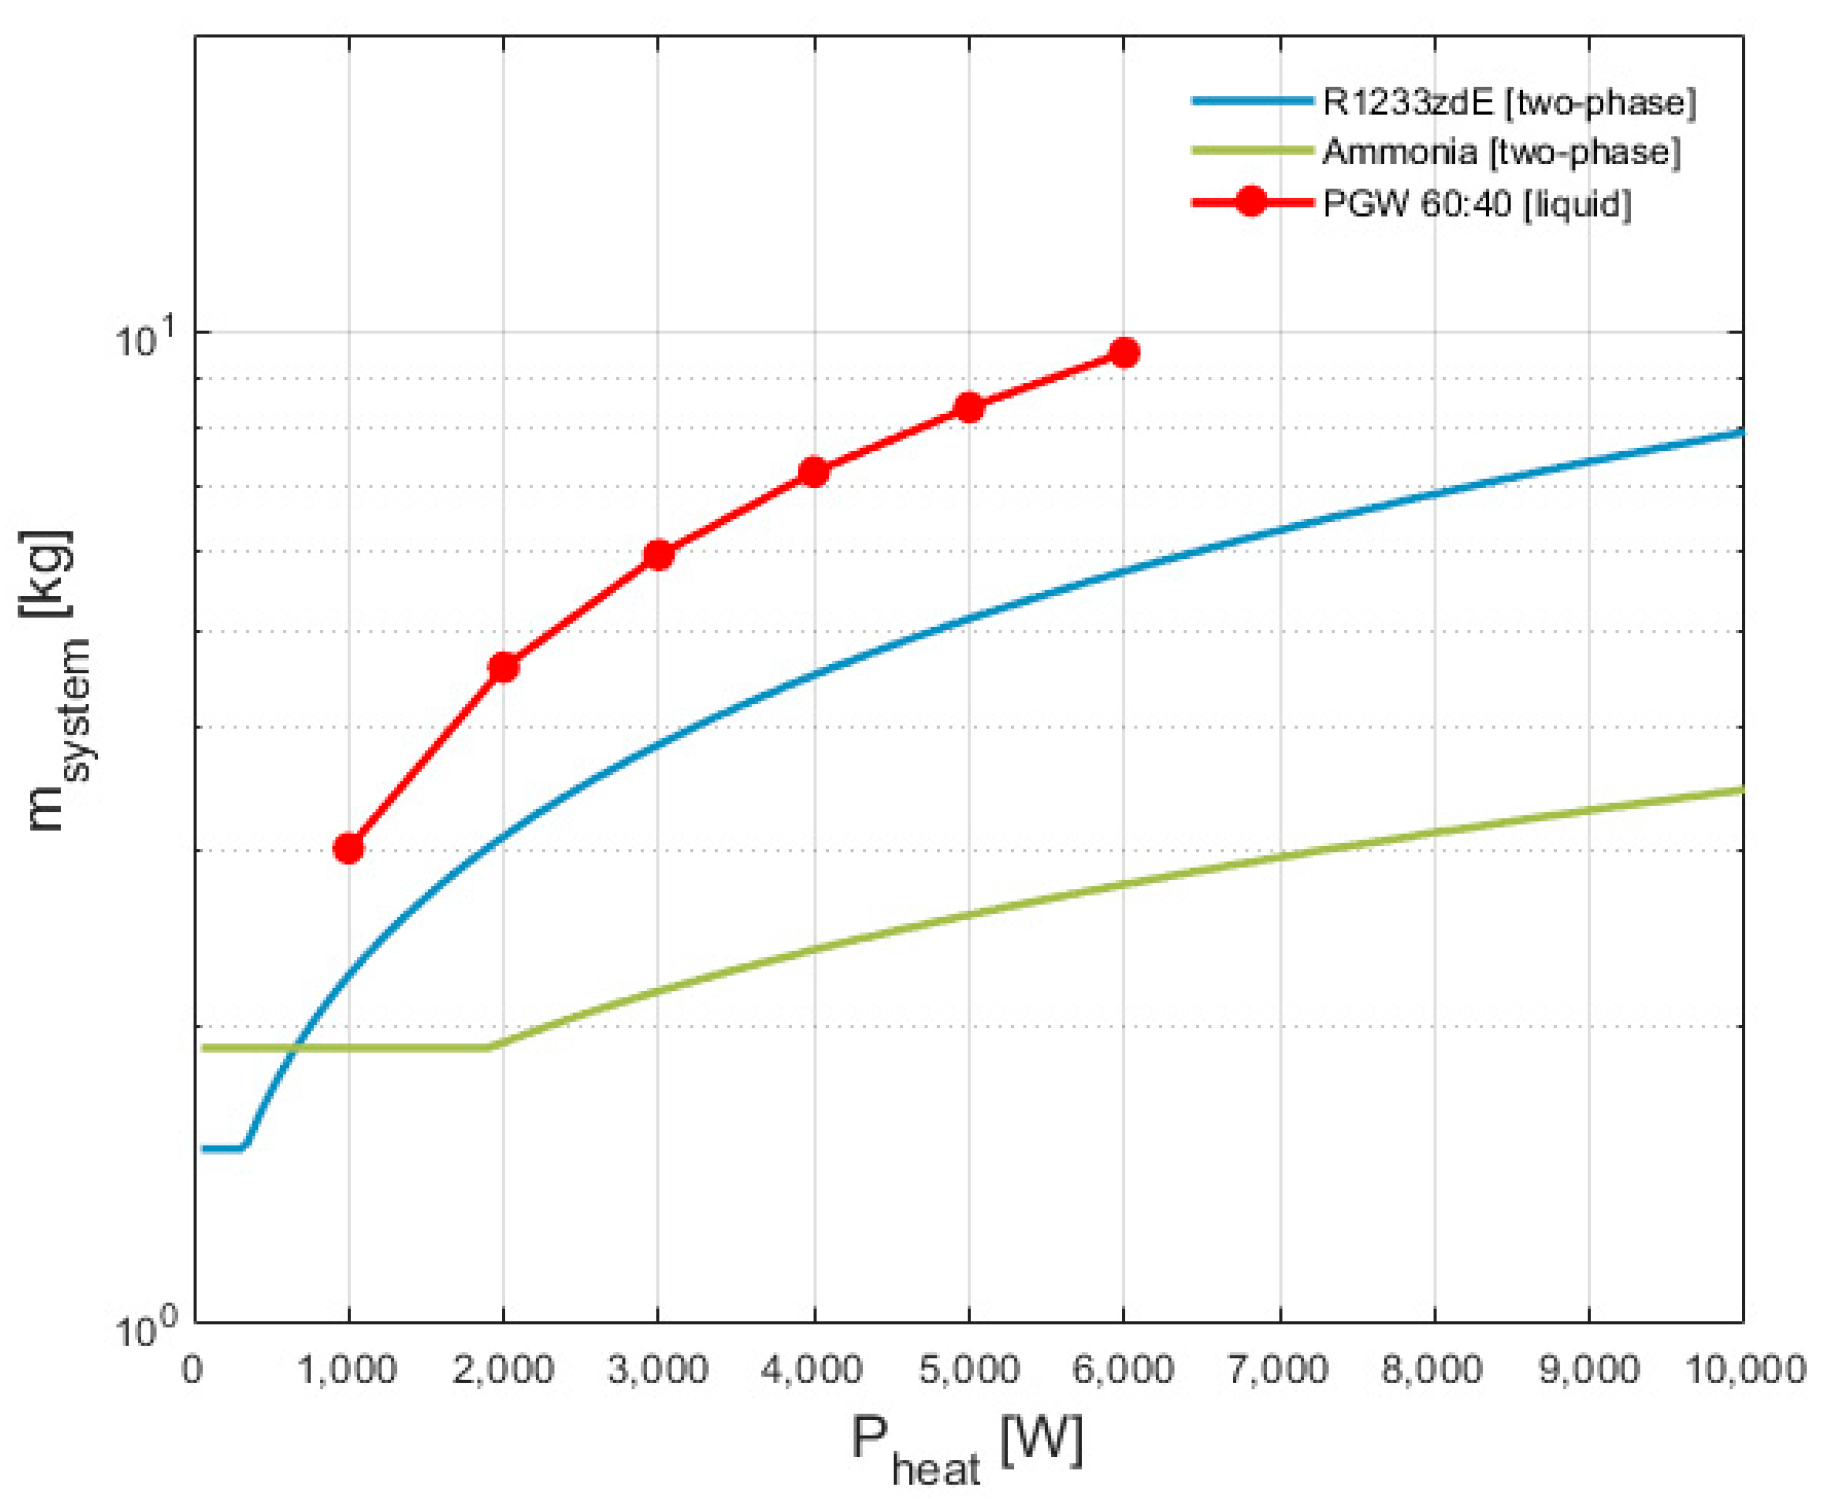
For the system mass comparison between liquid and two-phase mechanically pumped loops, a range of heat dissipation was considered, as shown in
Figure 4. For the two-phase MPL, two working fluids were considered, namely R1233zdE and ammonia. As shown in
Table 1, ammonia (NH
3) has superior performance but is toxic. Comparing mass on logarithmic scale, it can be seen that the system mass can be reduced by 40% when opting for a two-phase MPL with R1233zdE compared to a liquid MPL with propylene–glycol water. This mass reduction is 70% when considering ammonia as the two-phase MPL working fluid.
Additional to system mass, the following differences appear when comparing a liquid and two-phase mechanically pumped loop:
The required mass flow for a two-phase MPL is an order of magnitude smaller, resulting in a lower electrical power consumption of the pump;
Refrigerants suitable for a two-phase MPL generally have a low triple point temperature. For cooling system operation in an aircraft, a triple point below the minimum ambient temperature in flight is required, which is −55 °C;
The air drag penalty induced by the fluid–air heat exchanger is lower for a two-phase MPL because of a higher refrigerant temperature inlet.
3. Experimental Setup and Cold Plates Under Test
3.1. System Demonstrator
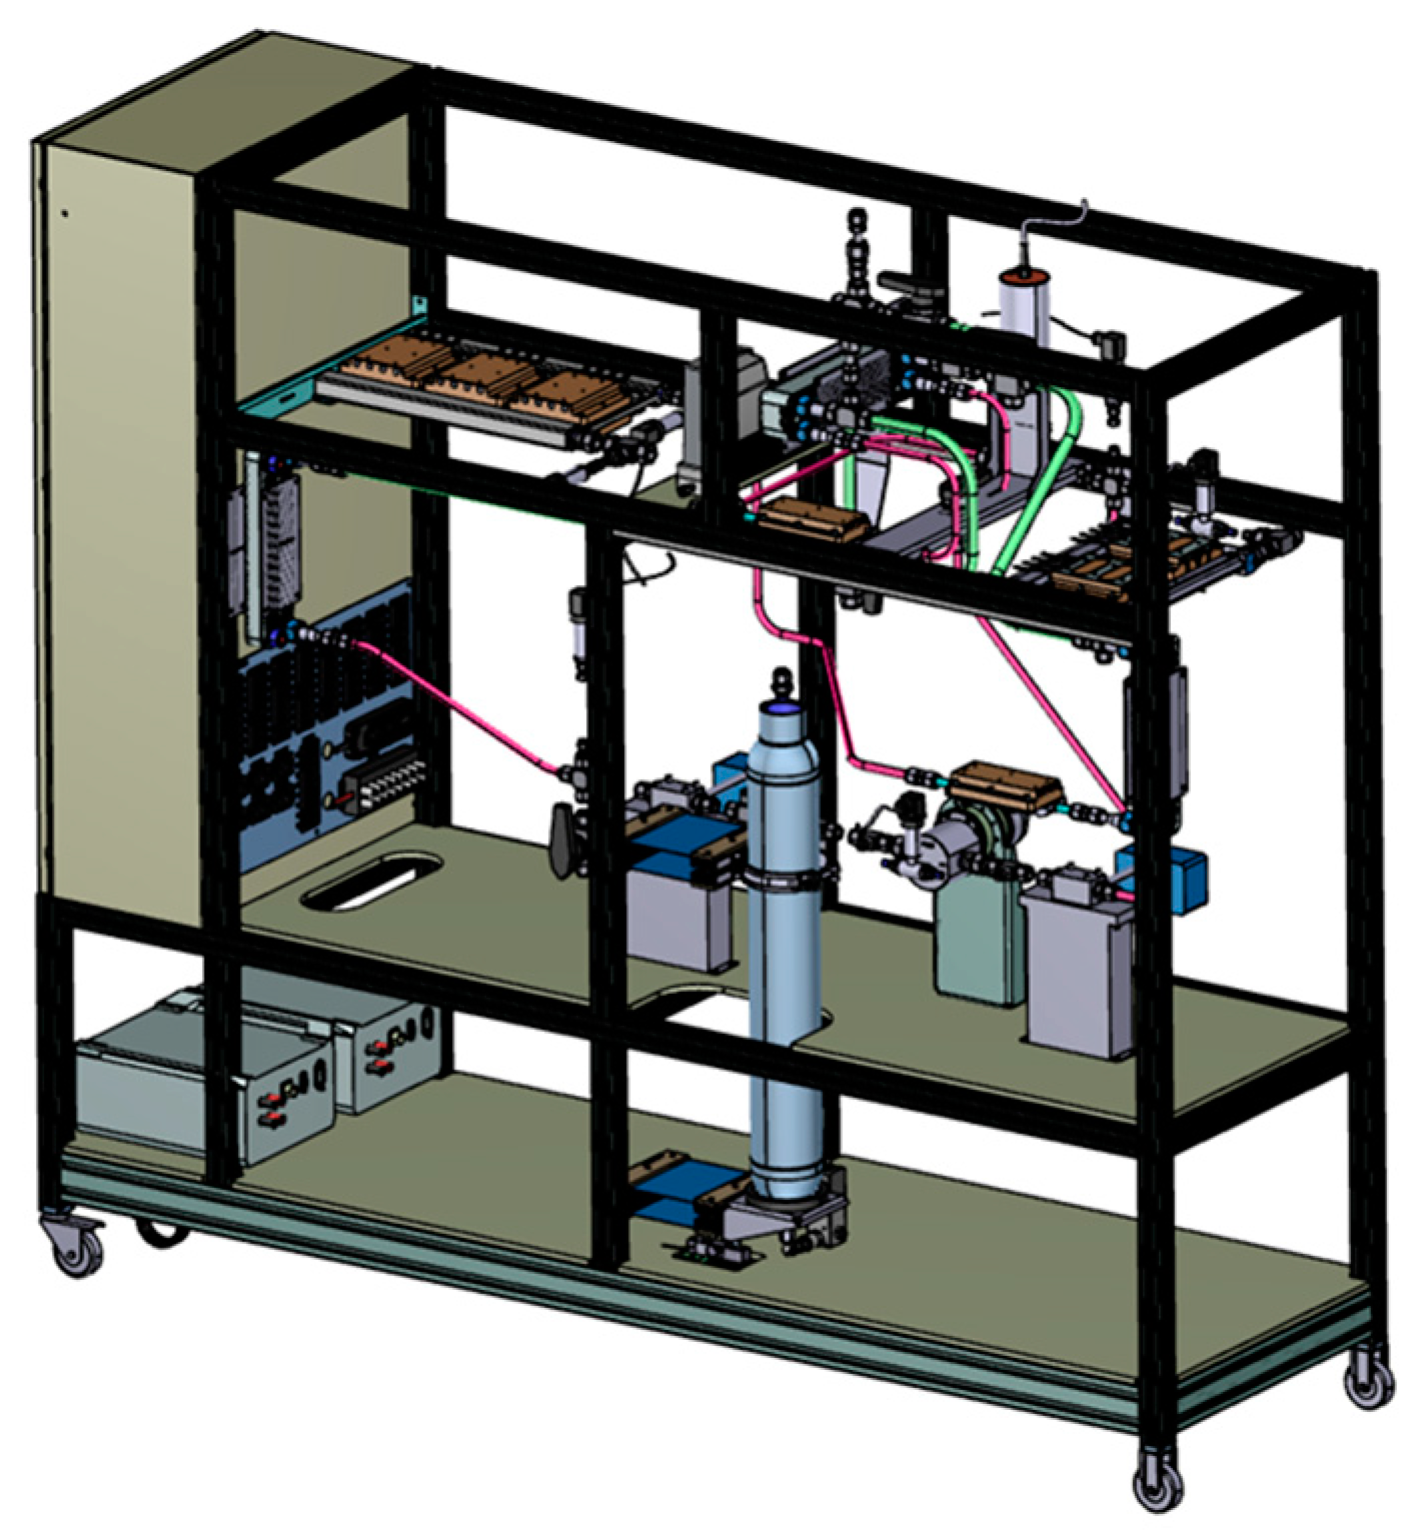
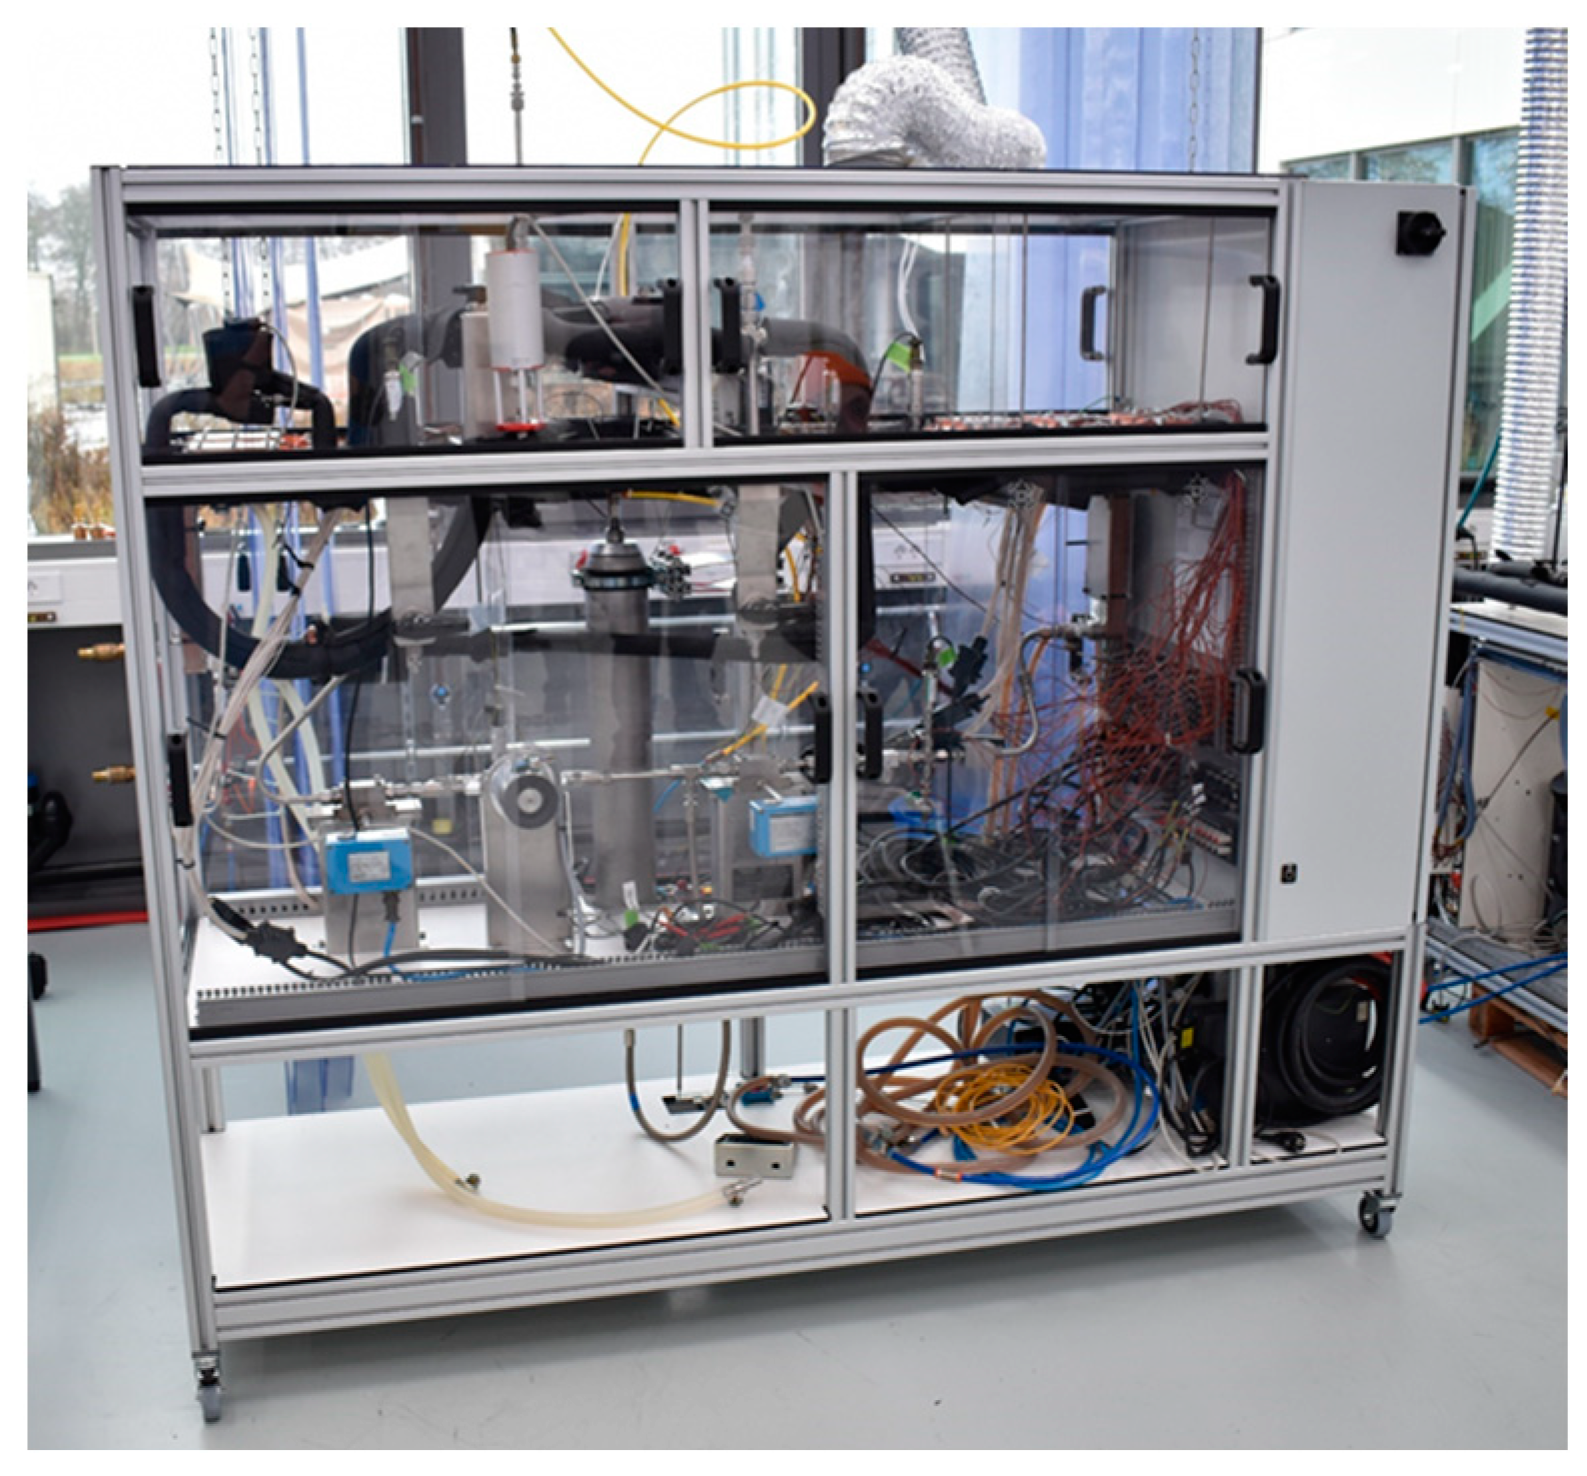
A two-phase MPL demonstrator was built in order to validate the two-phase MPL system performance and individual cold plate performance. The demonstrator system is shown in
Figure 5 and
Figure 6. In this setup, cold plate designs can be tested by drop-in and several modularity configurations can be replicated. The system has shown its ability to transfer up to 10 kW of heat from heat source to sink, with R1233zdE as the working fluid.
3.2. Cold Plate Design and Manufacturing
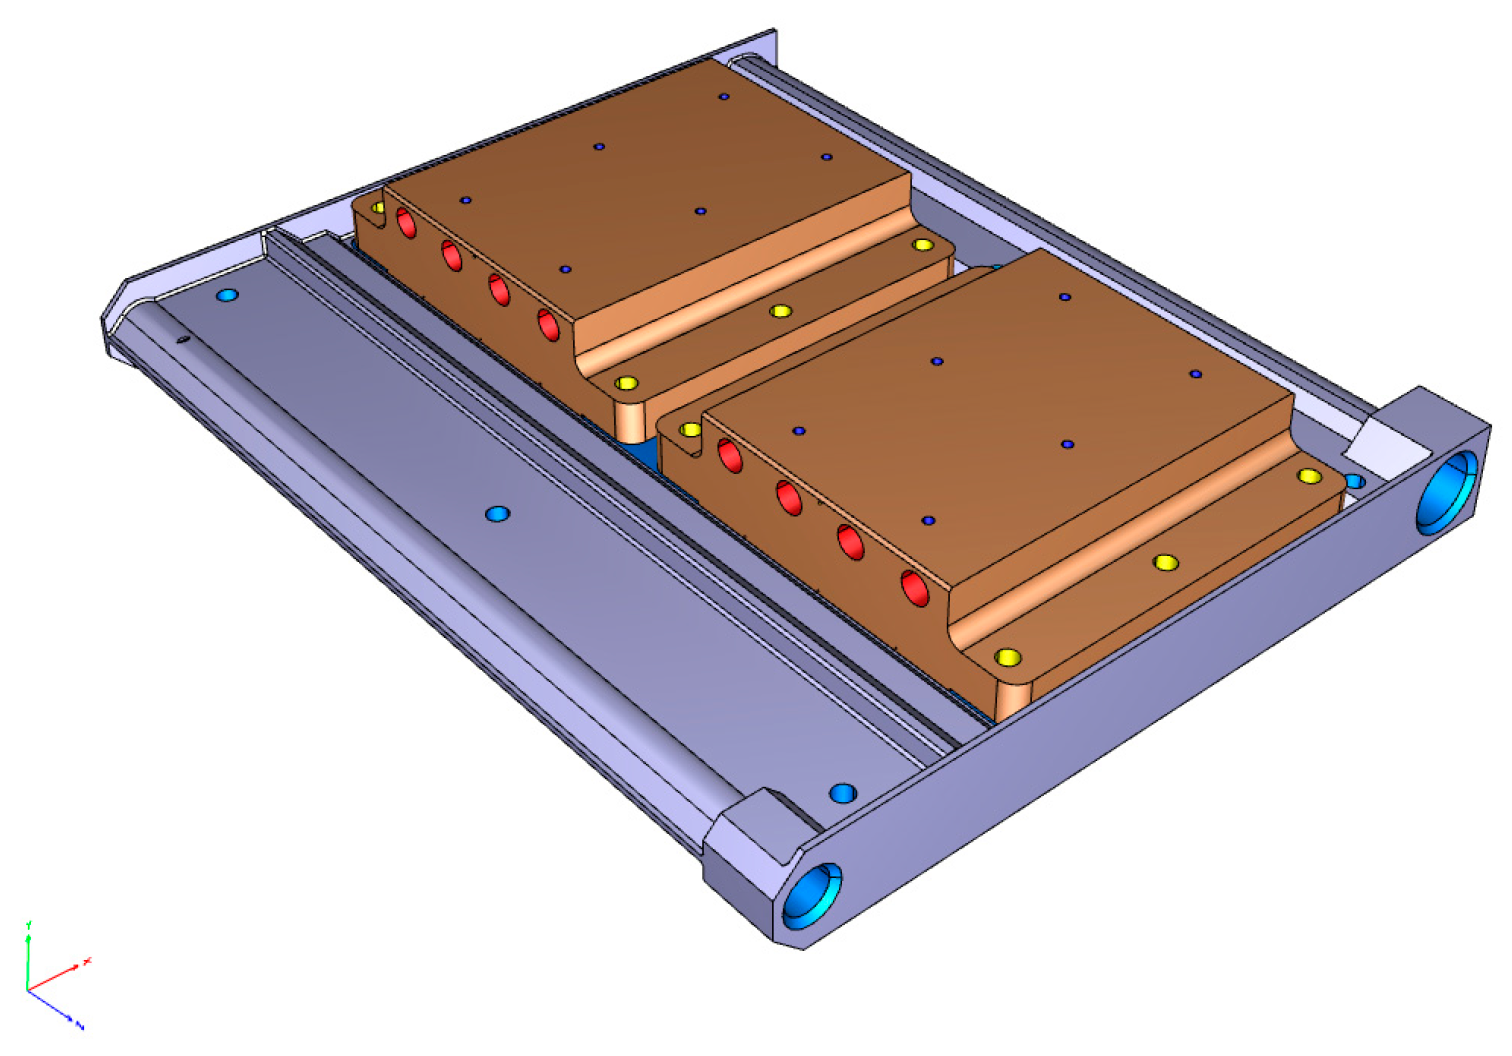
The individual items under test were two manufactured cold plates. One of them was manufactured by employing AlSi10Mg additive manufacturing with in-house machining capabilities at NLR, as shown in
Figure 7 and
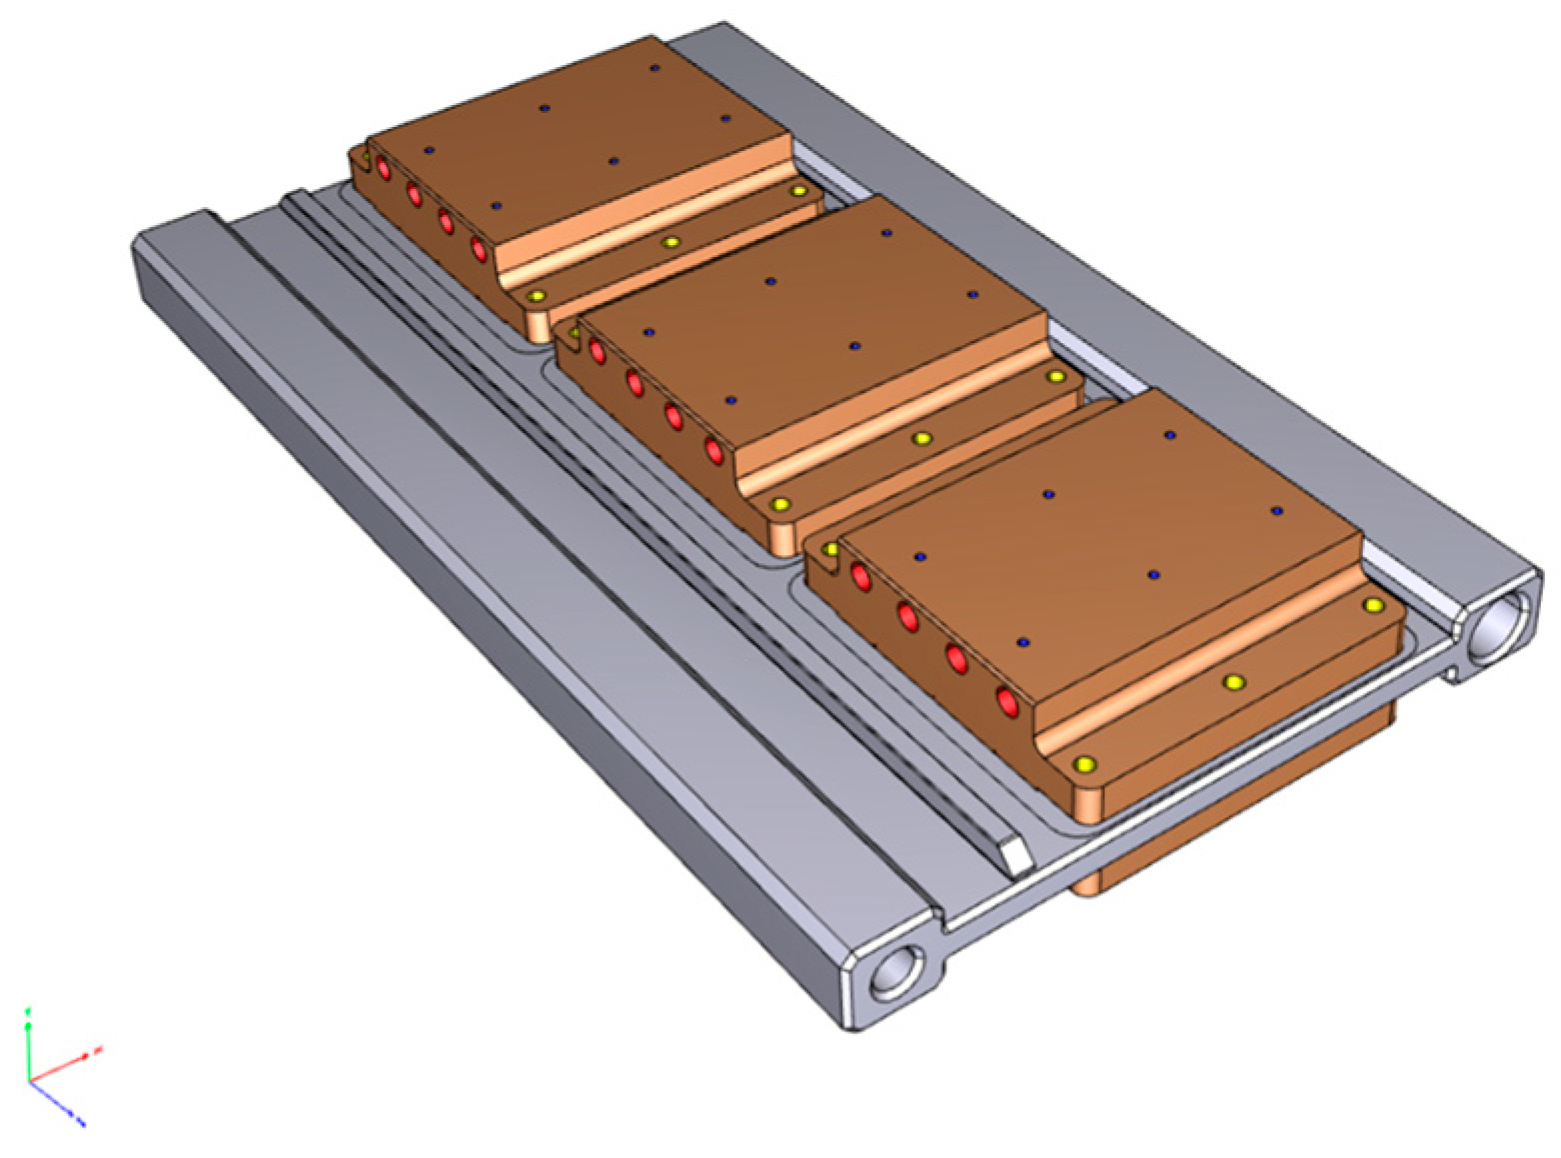
Figure 8. The other cold plate was manufactured by conventionally machining aluminium, as shown in
Figure 9 and
Figure 10. The orange-coloured blocks are copper blocks that serve as thermal emulators of HVDC converters. Embedded cartridge heaters in the copper blocks generate heat in a controlled manner. A heat flux of 7.7 W/cm
2 is applied on each cold plate cooling section of 10 by 13 cm on both sides. At 1.0 mm above the interface between copper blocks and the cold plate, thermocouples are placed to monitor the local temperature.
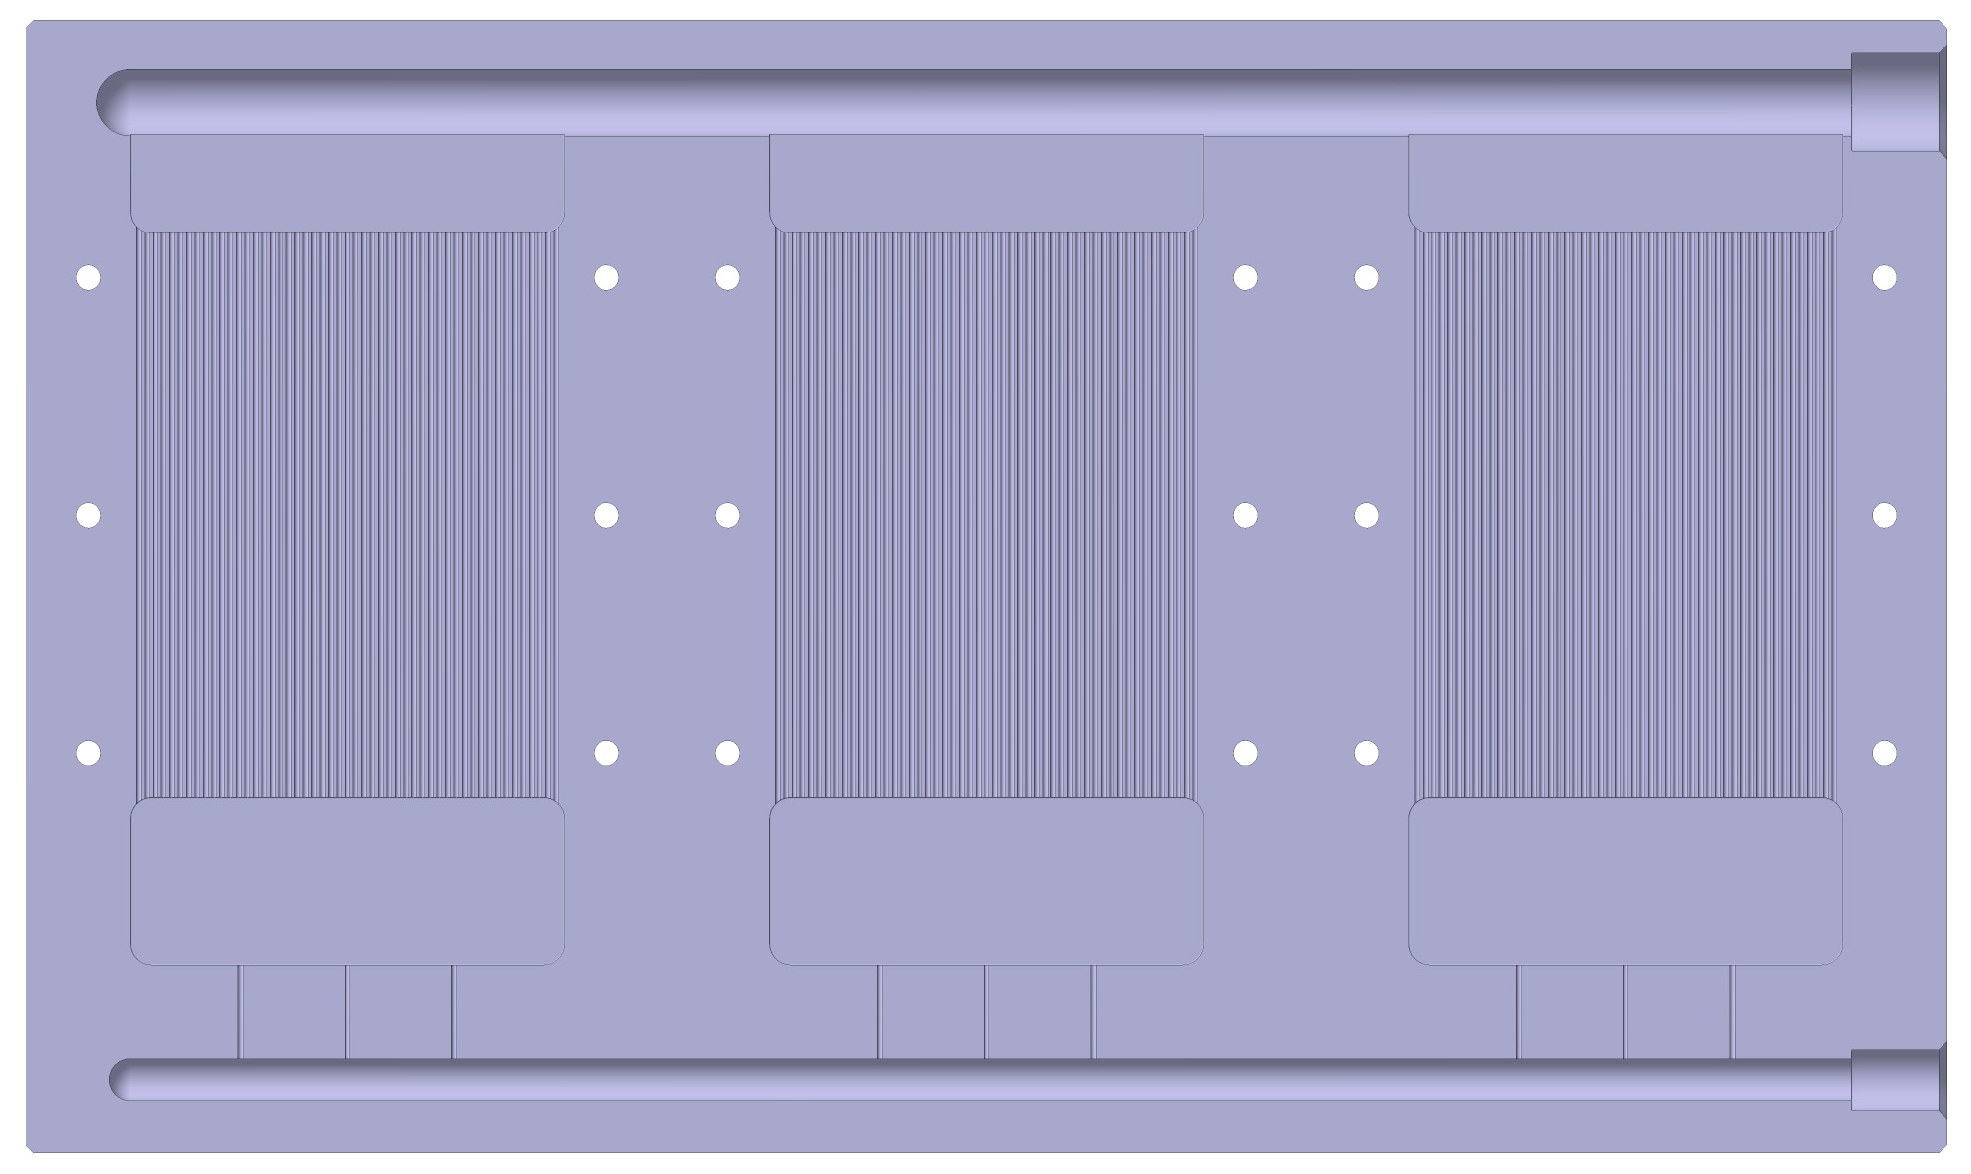
Based on design trade-off and flow simulations, the machined cold plate (
Figure 9) consists of three parallel sections for three pairs of heat sources. Note that a pair consists of a heat source on the top and bottom of the cold plate in a sandwich structure. The flow enters the cold plate at the liquid inlet, bottom right in
Figure 10, and leaves at the two-phase outlet, top right. Due to higher pressure drop for two-phase flow compared to liquid flow, the diameter of the two-phase channel is 50% larger than for the liquid channel.
Flow balancing between the parallel sections is achieved by placing restrictions upstream of each section. These serve as the main pressure drop for each section, i.e., the restriction pressure drop is five times larger than the pressure drop over a two-phase minichannel by design. This appeared effective for flow balancing across a cold plate [
2]. Furthermore, acceleration effects are negligible by designing the minichannels such that inertial forces are stronger than acceleration forces.
For the detailed design of both cold plates, the internal geometry dimensions were the same. For the additively manufactured cold plate, however, a reduction to 2/3 of the size of the machined cold plate was applied due to the manufacturing envelope. Therefore, its heat absorption capacity was reduced to 4 kW. The additively manufactured cold plate was manufactured as a single piece, employing its inherent manufacturing benefits. The machined cold plate was assembled as a two-piece design, with a braze line along the midplane of the design.
4. Technology Demonstration by Testing
4.1. Performance Test of Additively Manufactured Cold Plate at Maximum Heat Load
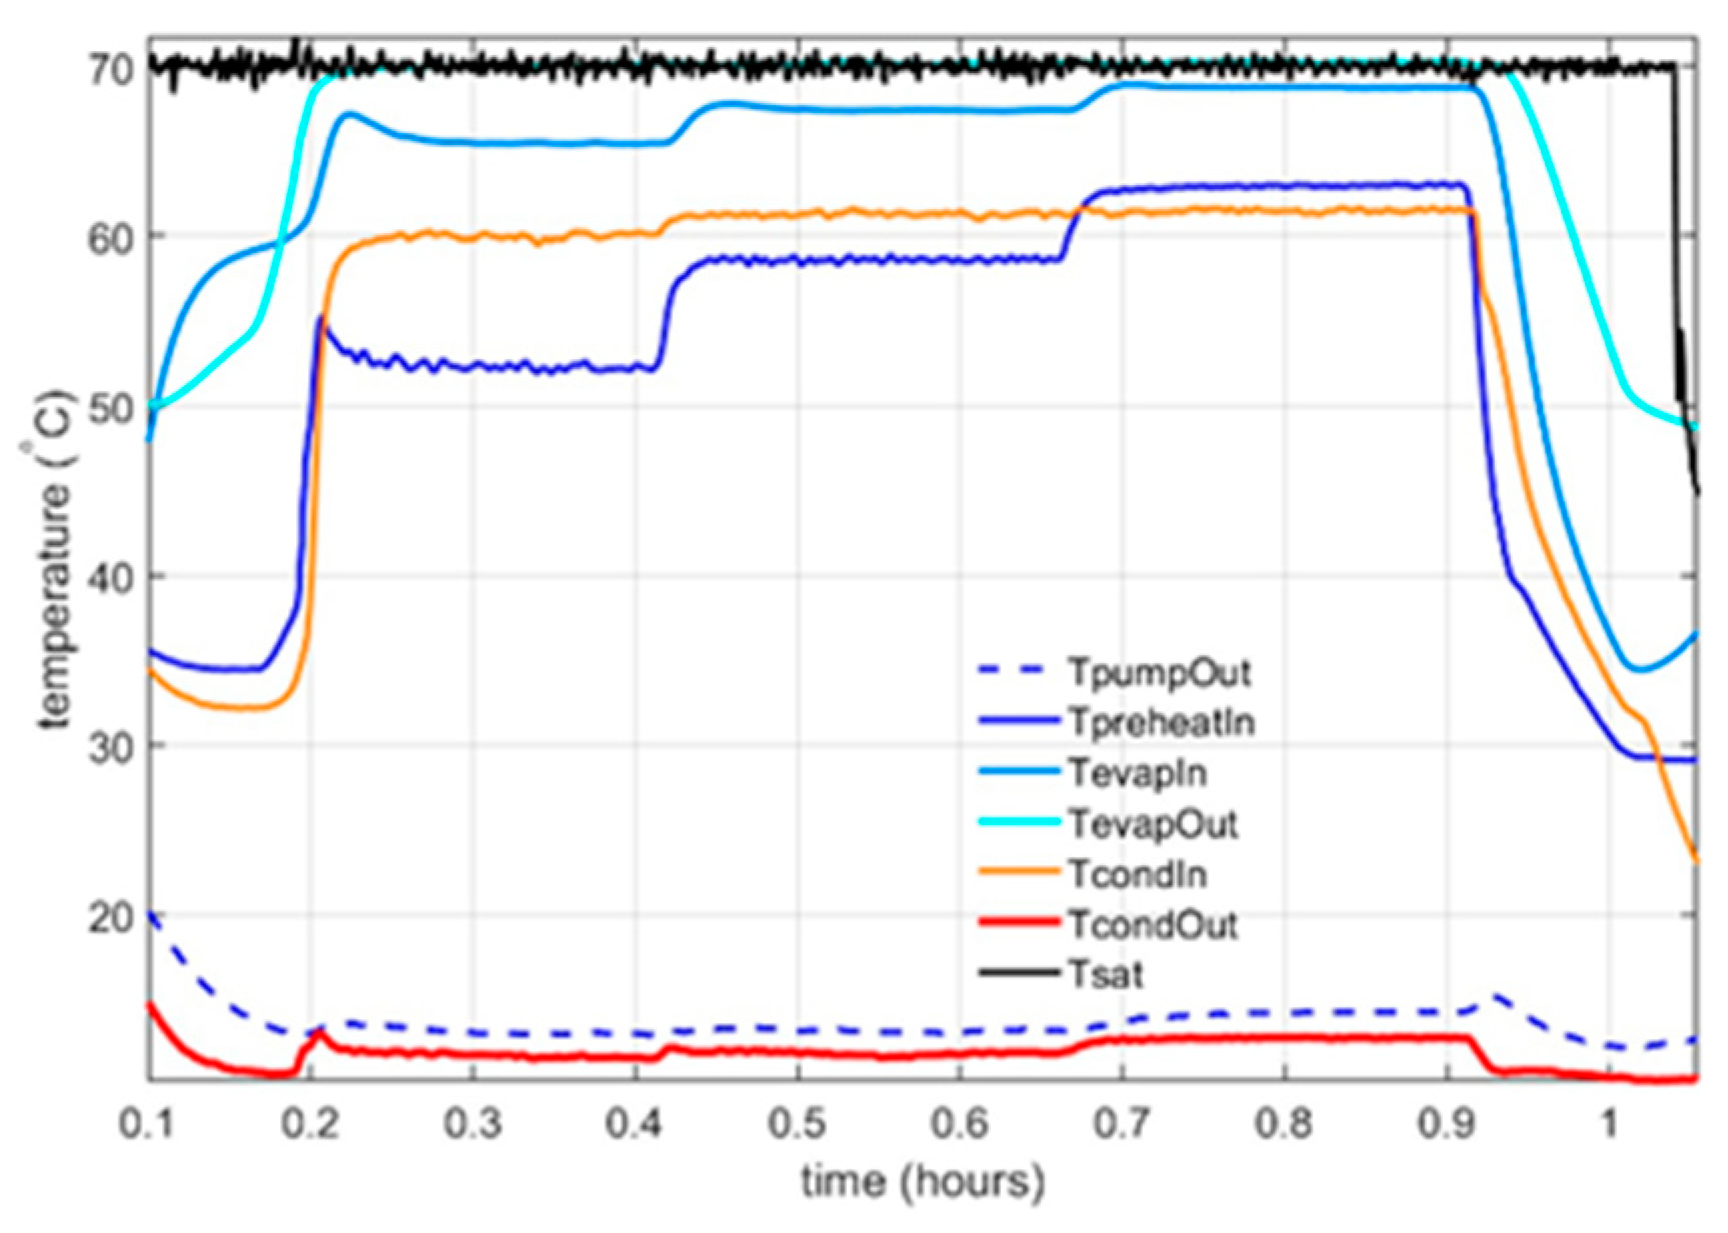
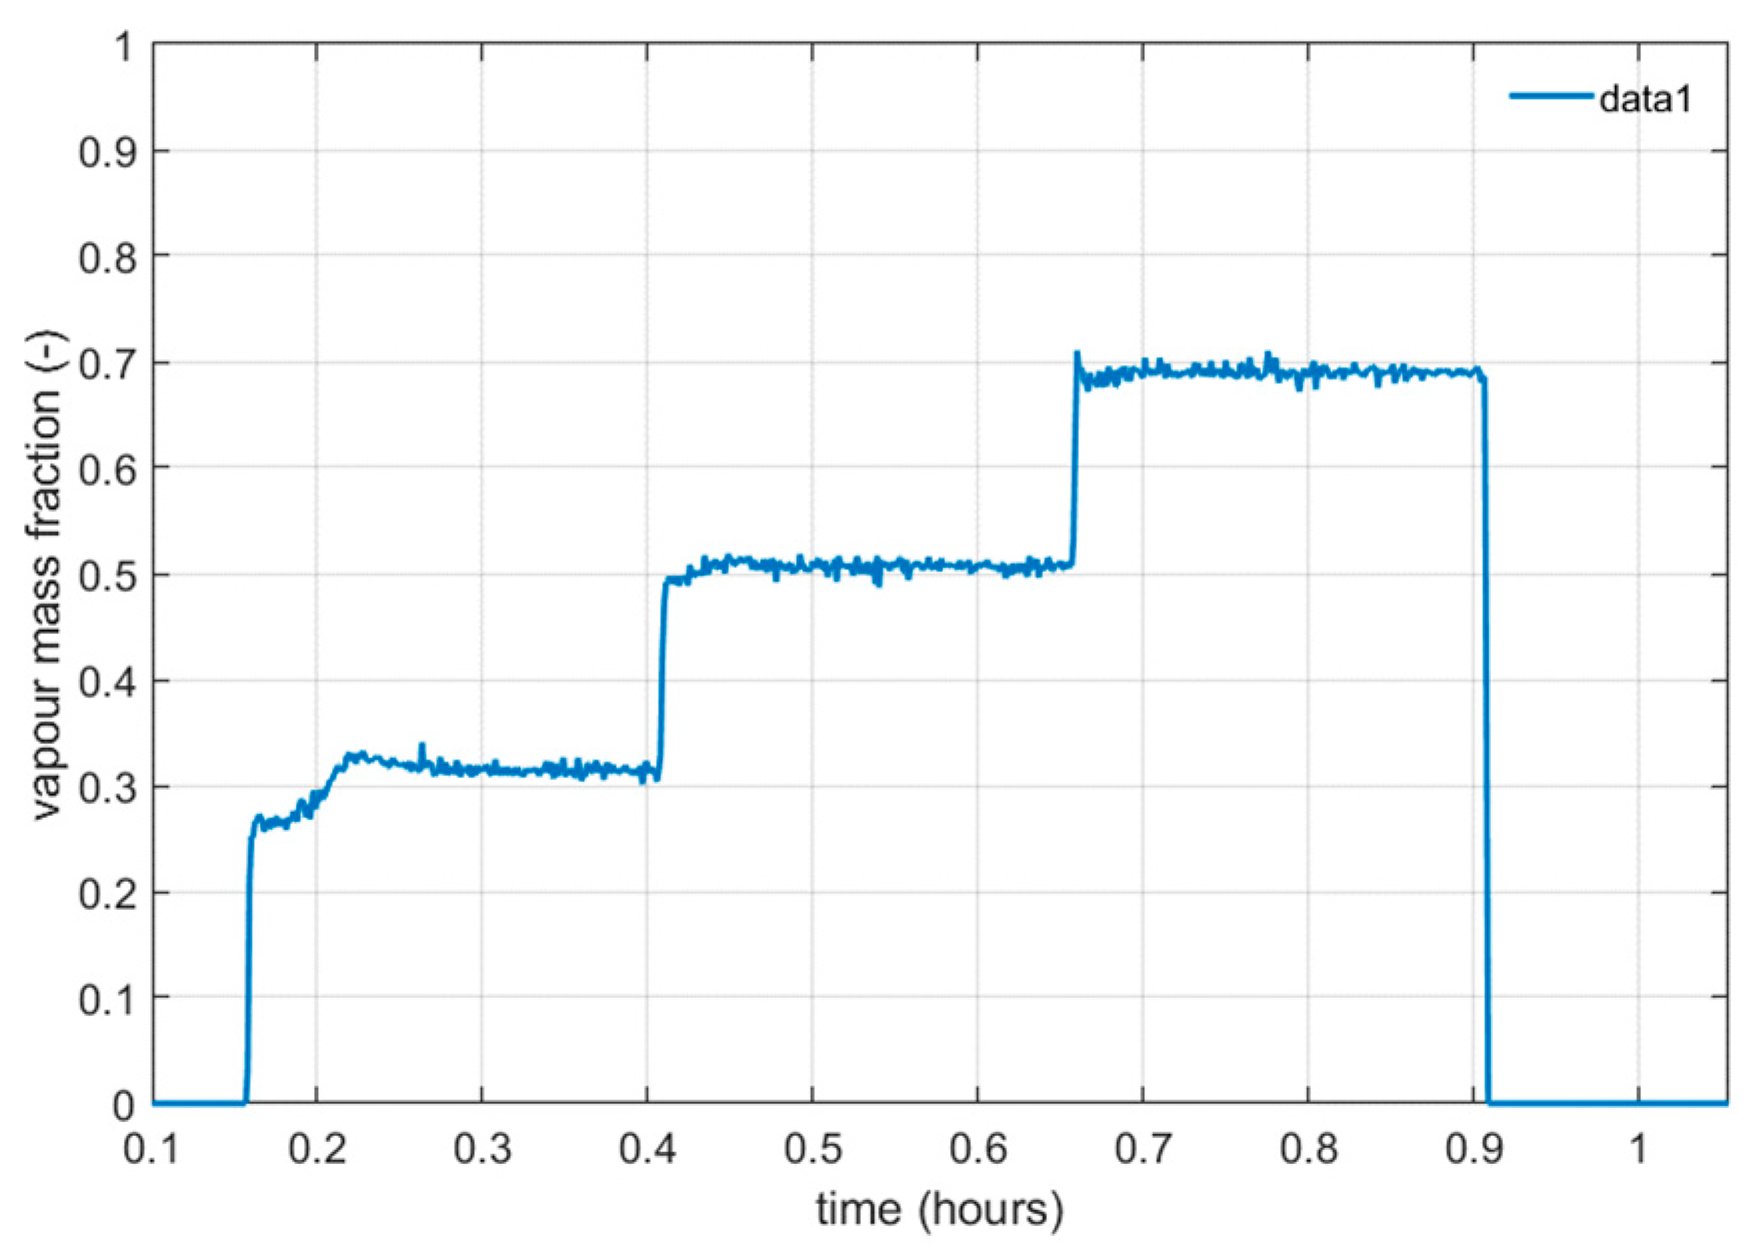
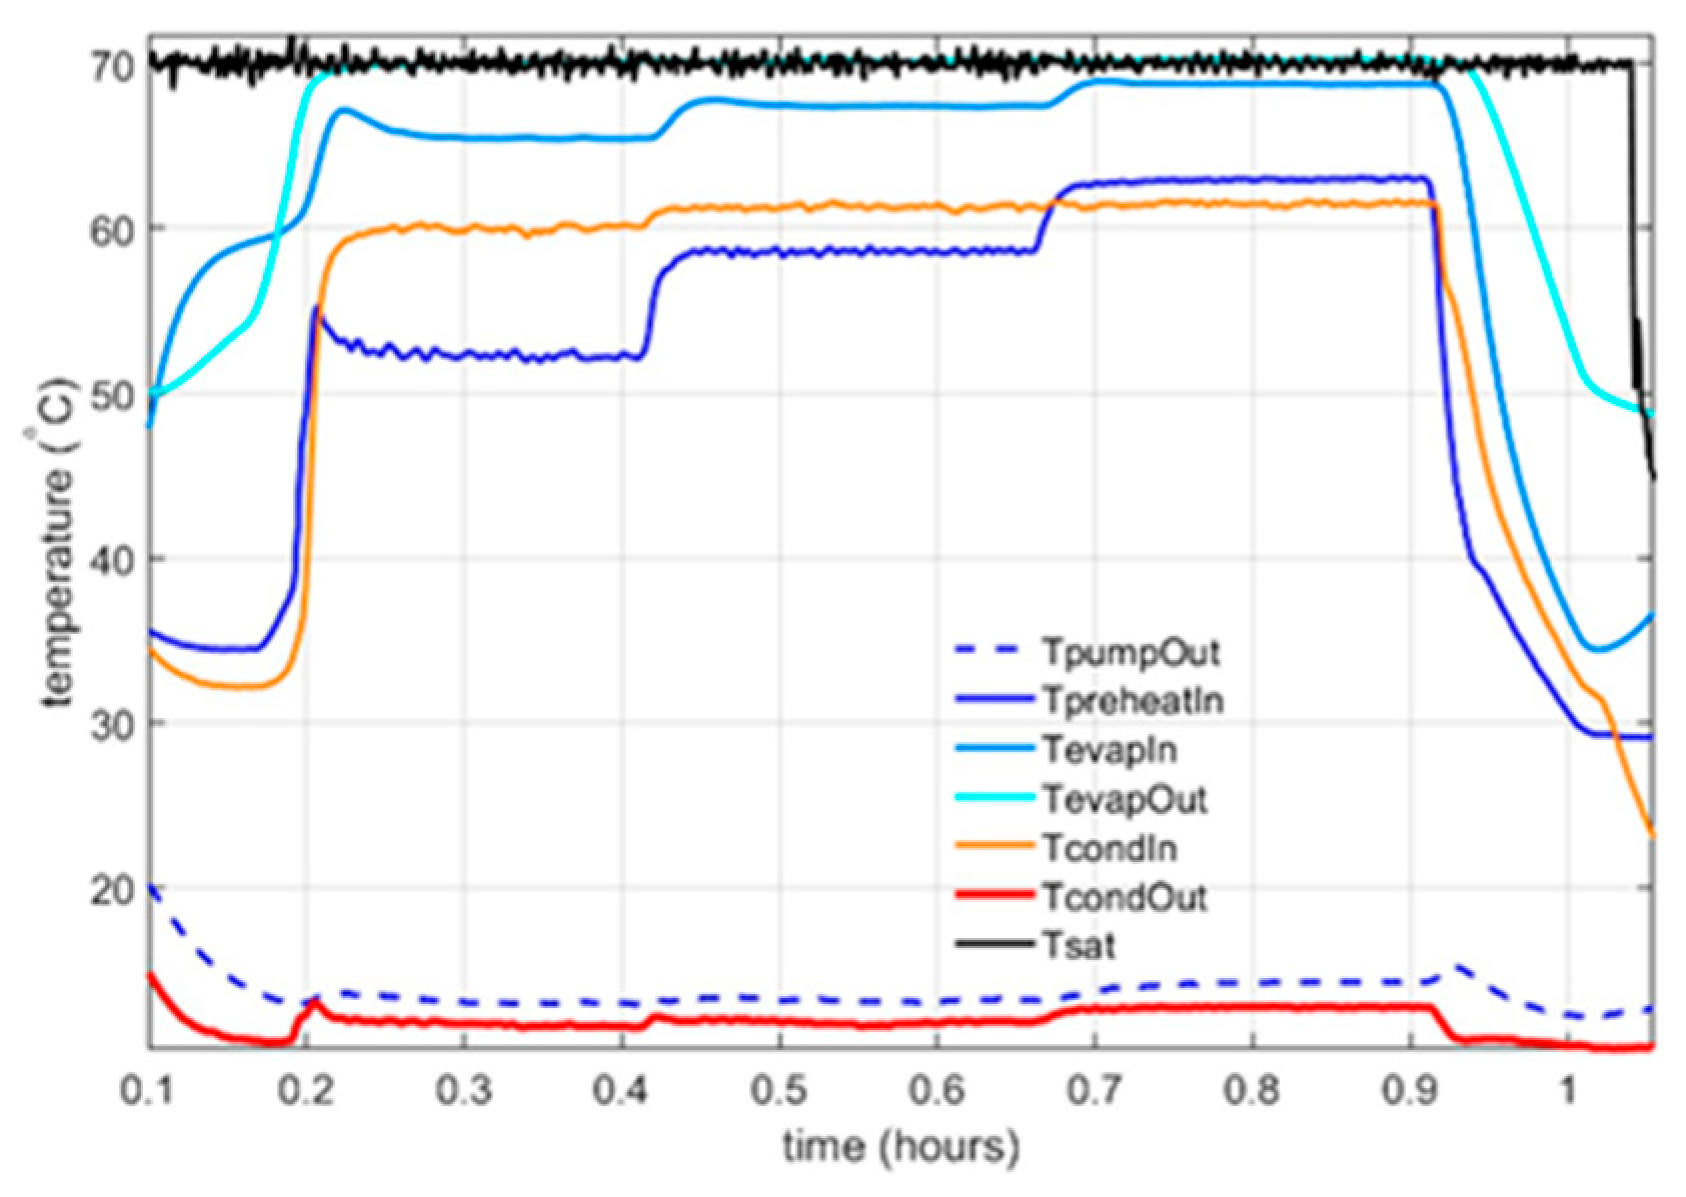
The additively manufactured cold plate was tested with a heat load of up to 4 kW. A mass flow of 35 g/s was established to achieve a vapour mass fraction at the outlet of 0.70. In
Figure 11, the measured temperatures in the two-phase MPL demonstrator system are displayed. In
Figure 12, the vapour mass fraction in the two-phase MPL demonstrator is displayed. The saturation temperature was kept constant at 70 °C by pressure control. The condenser outlet is at 10 to 15 °C due to the cooling capacity of the building’s general water circuit. In the demonstrator system, a recuperator was used to heat the cold flow upstream of the cold plate by interfacing with the hot two-phase flow downstream of the cold plate via a plate heat exchanger. This results in a high evaporator inlet temperature of about 65 °C. This low amount of subcooling results in two-phase cooling performance near the entrance of the heated section of the cold plate. The evaporator outlet is at saturation temperature, which is 70 °C.
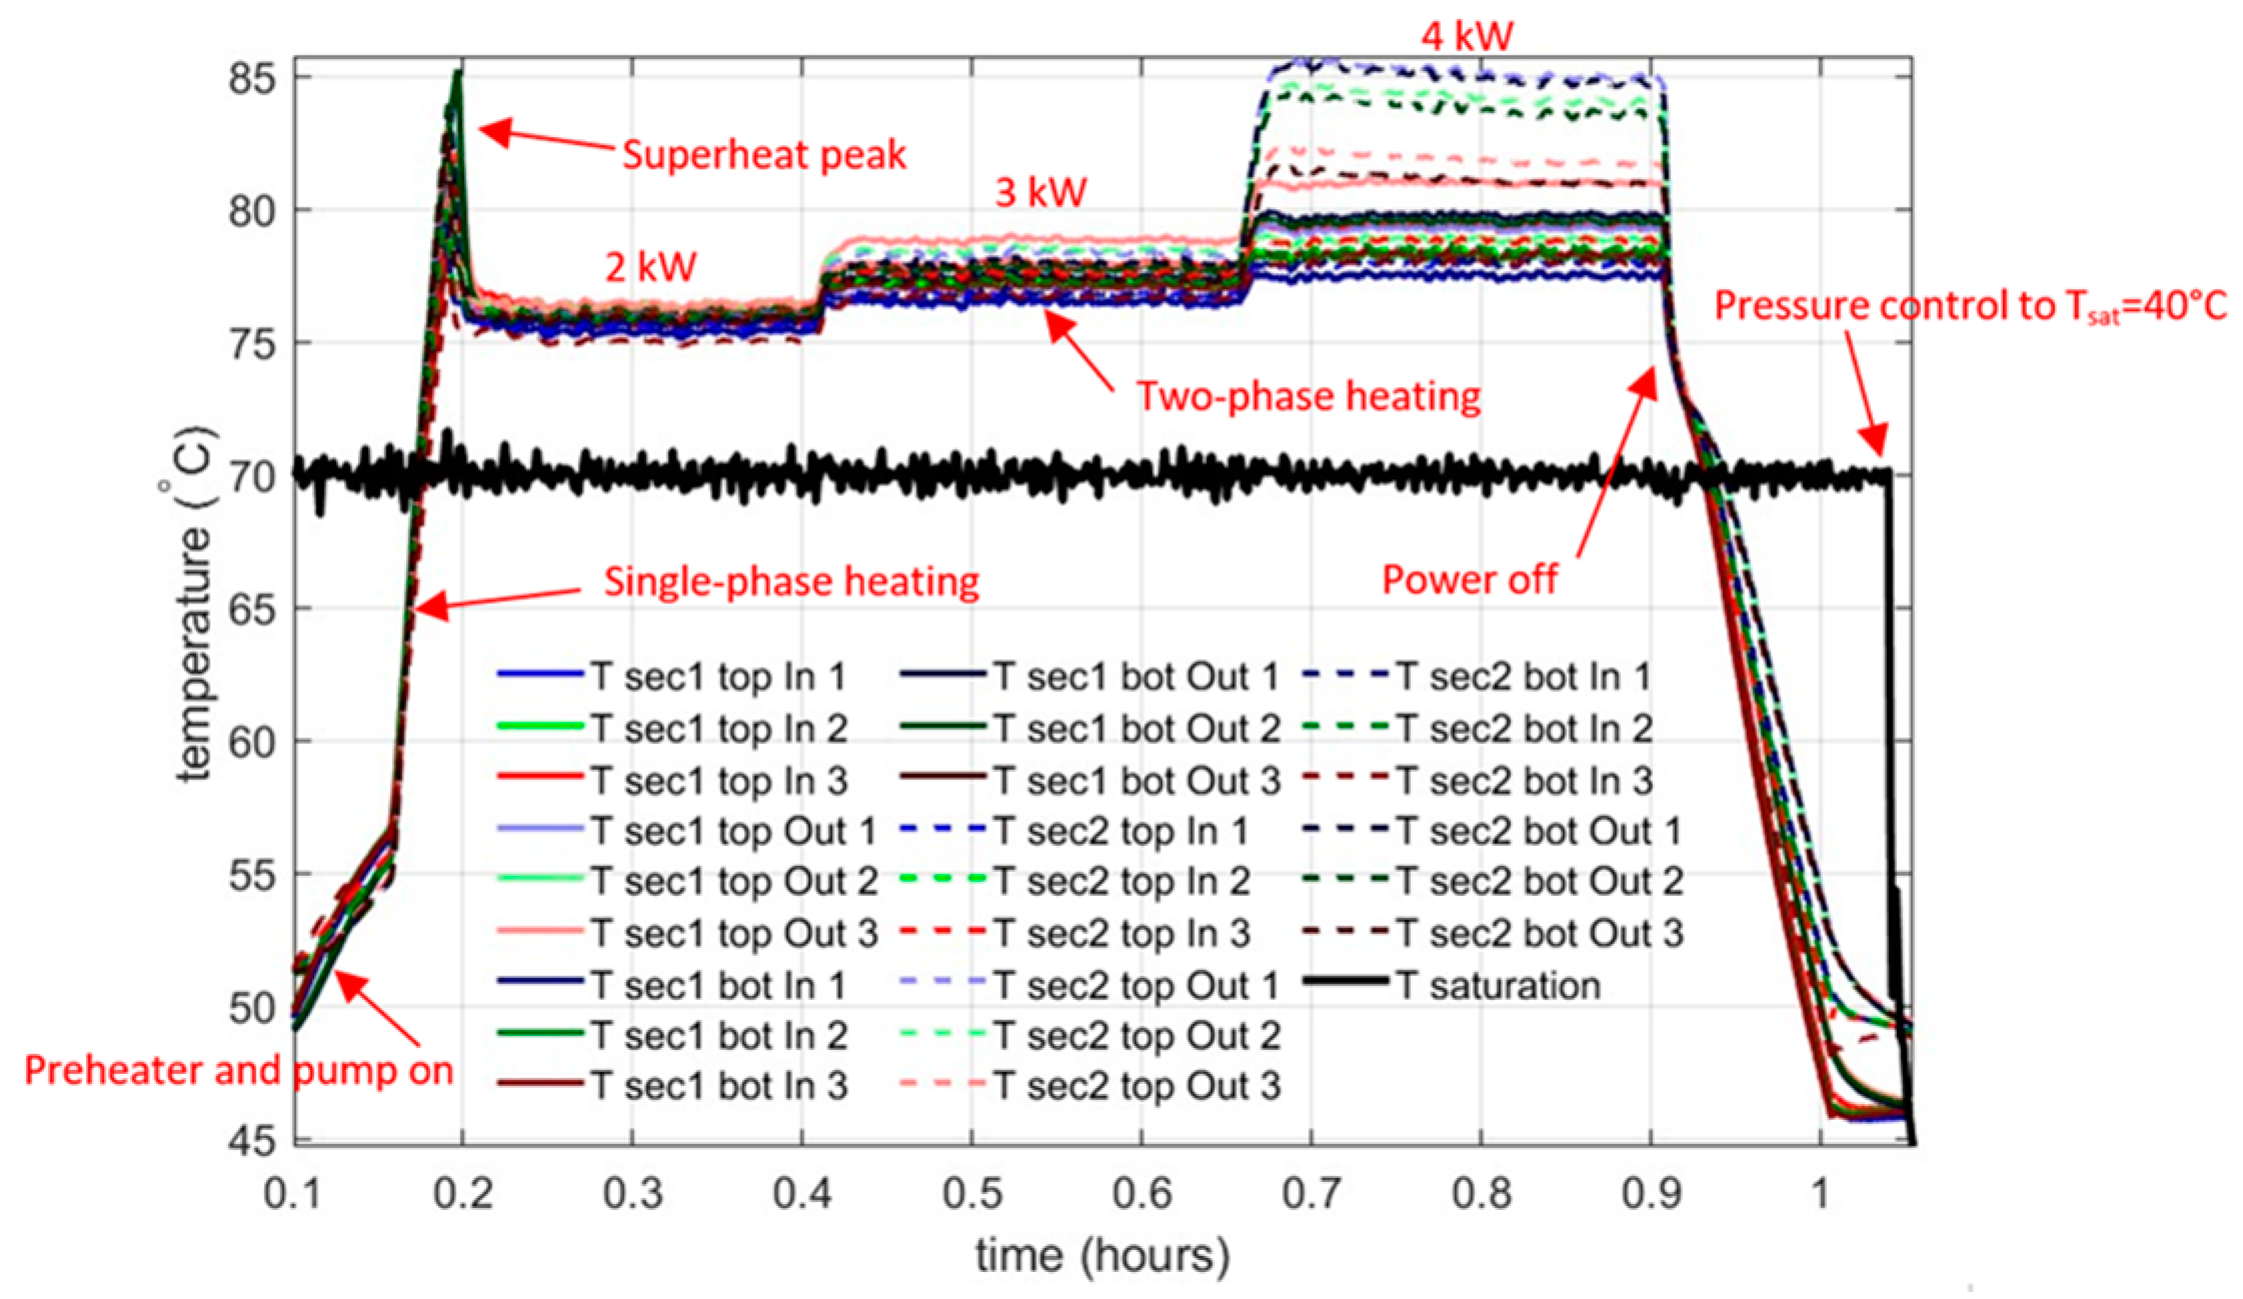
In
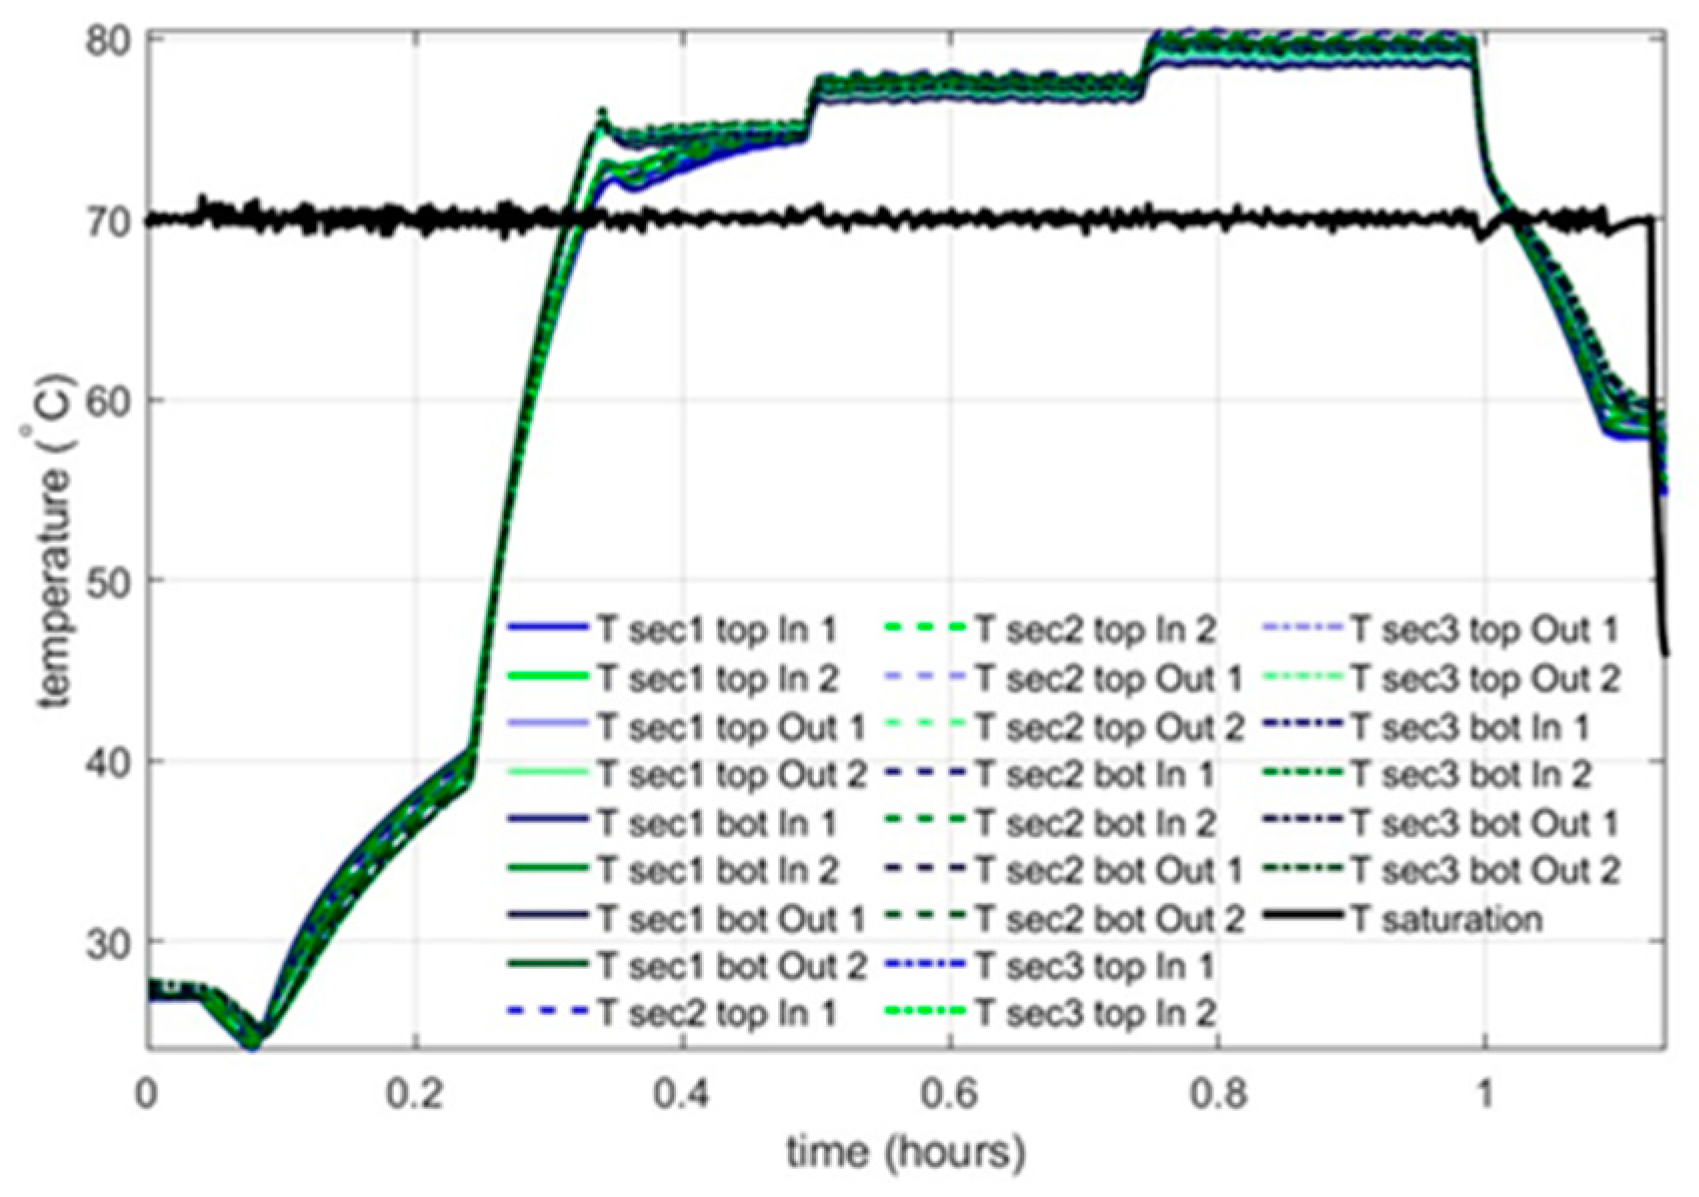
Figure 13, the temperature at the cold plate interface is shown. When the preheater (between pump and cold plate) and pump are switched on, an initial temperature rise is observed. A further increase in temperature occurs from t = 0.16 h, when the heat loads on the cold plate sections are switched on to 2 kW, i.e., 500 W per heat source. Initially, this results in single-phase heating. Once above saturation, a superheat peak is observed. This phenomenon is, in general, ill-understood. A lack of nucleation sites can be a reasonable explanation; however, for the additively manufactured cold plate, the suppression of superheat would be expected due to the relatively high wall roughness at the minichannel perimeter. The superheat peak is sustained for a minute. Once superheat is suppressed, the temperature sensors show a uniform temperature distribution across the cold plate interface. For 3 kW, similar performance is found, albeit at a higher temperature due to a higher heat flux.
At 4 kW operation, a spread in temperatures is shown in
Figure 13. This indicates sub-optimal flow balancing. Because of the additive manufacturing process, small agglomerations of AlSi10Mg particles have been formed, which affect flow distribution in the plenums. Therefore, higher temperatures occur at the temperature sensors furthest away from the inlet. Even though imbalance occurs, the operation at 4 kW is stable, indicating that two-phase cooling for this cold plate has been achieved for all heat dissipation levels.
4.2. Performance Test of Machined Cold Plate at Maximum Heat Load
Performance testing on the machined cold plate has been performed up to 6 kW. Again, the heat distribution among the six heat sources is even, i.e., max 1 kW per heat source.
The pressure is controlled at 5.1 bar (a), i.e., at a saturation temperature of 70 °C. This pressure control is performed on the outlet of the cold plate, as this is the most stable control method. The pressure differential over the cold plate stays within 0.2 bar along the test duration.
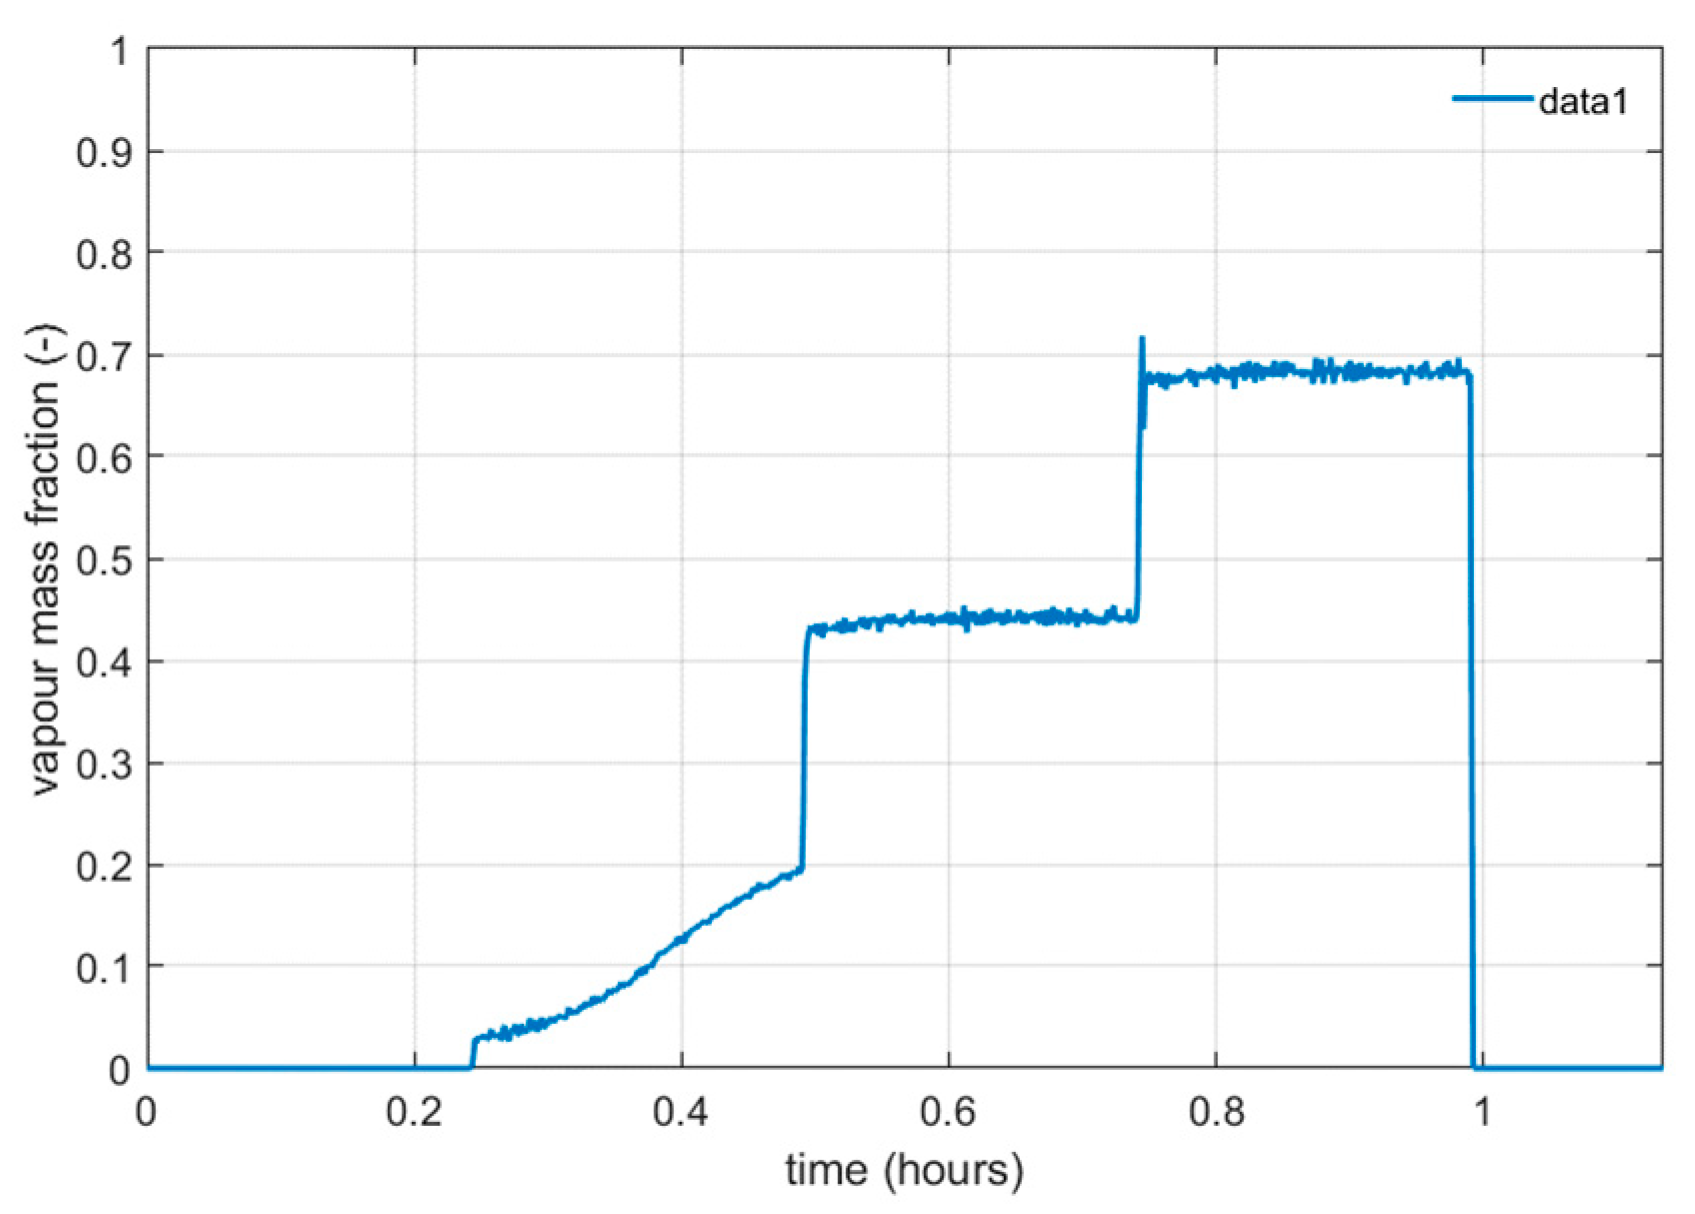
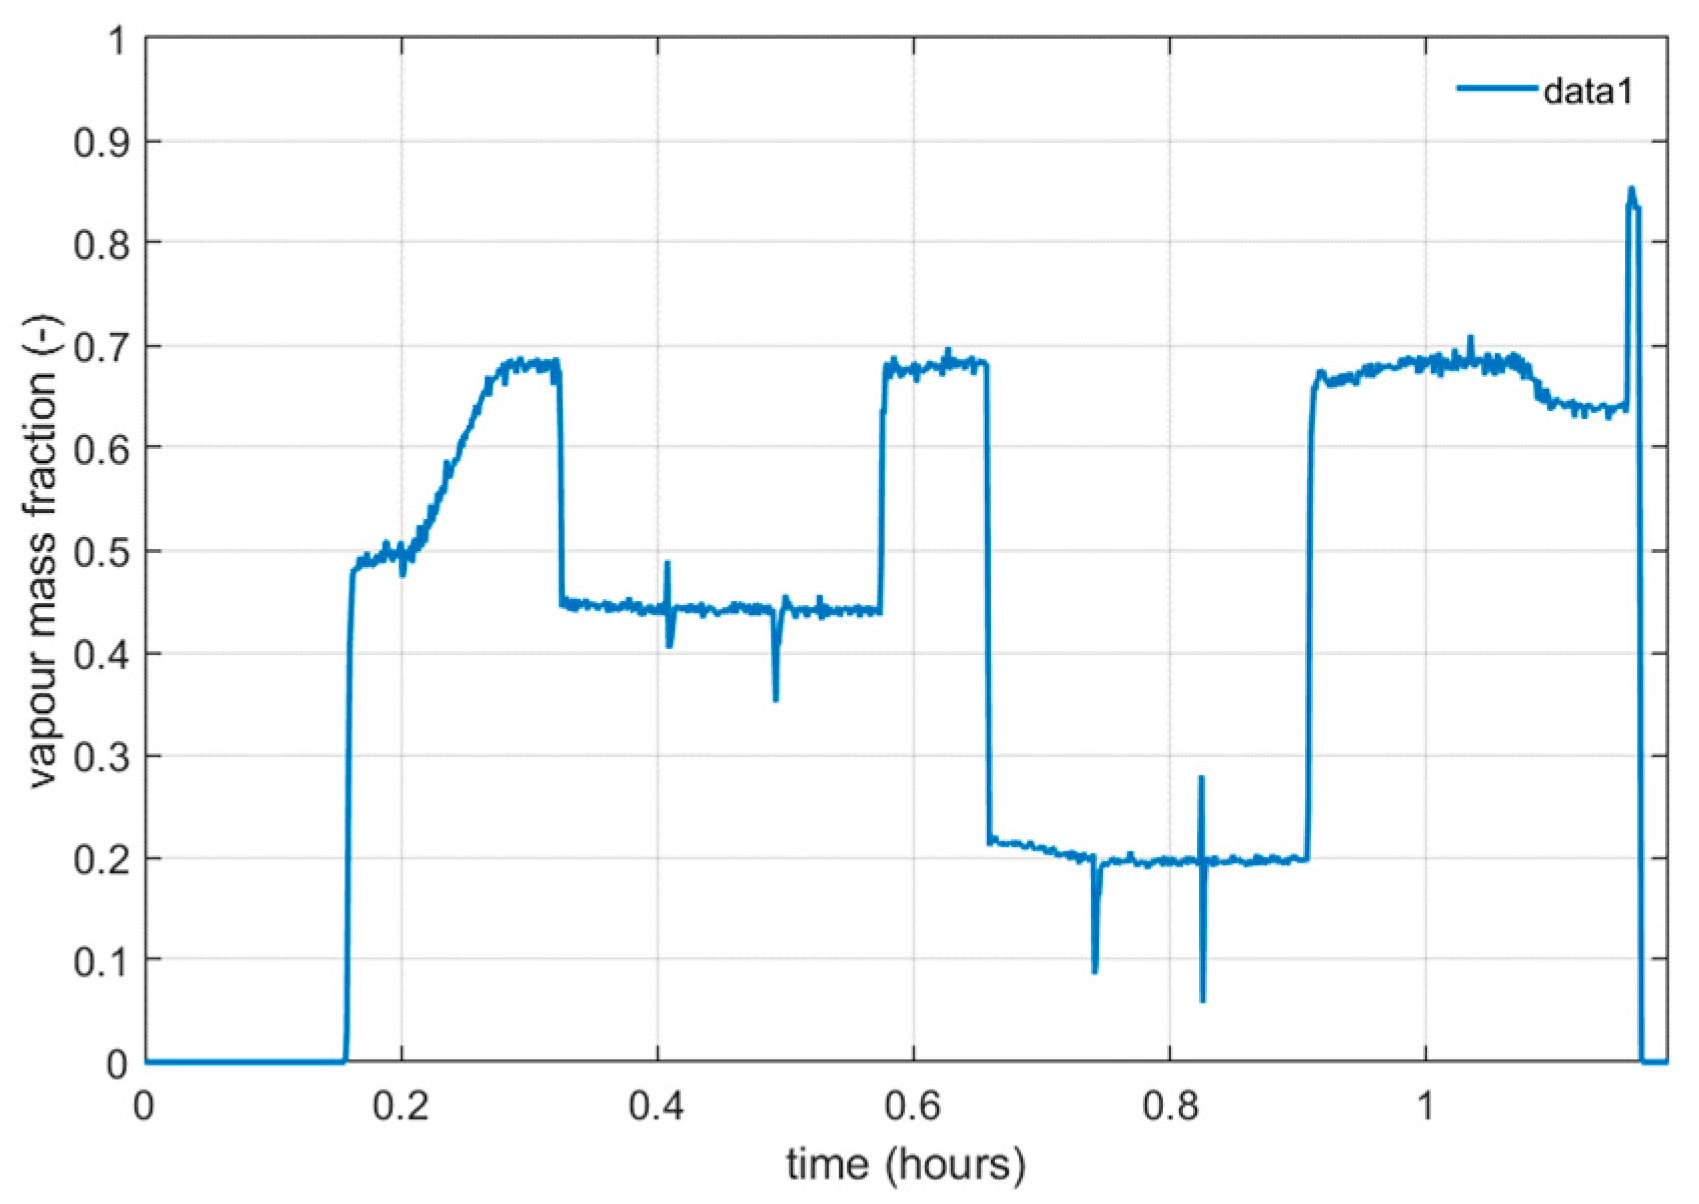
The vapour mass fraction of the cold plate outlet is shown in
Figure 14. Due to the thermal inertia of the system, the vapour mass fraction is increasing during the test phase at 2 kW between t = 0.25 h to t = 0.50 h. The recuperator is causing this inertia. At 4 kW and 6 kW heat loads, constant vapour mass fractions of x = 0.45 and x = 0.69 are observed.
The measured temperatures at the cold plate interface are shown in
Figure 15. Remarkably, the superheat peak is small. This might be suppressed by the presence of the midline braze, which can act as a primary nucleation site. The temperature variation between sensors is low. Unlike the additively manufactured cold plate, the machined cold plate shows excellent flow balancing properties, confirming the working of the applied pressure balancing method. Furthermore, the highest temperature observed is only 80 °C during 6 kW operation, indicating a high heat transfer coefficient at the fluid–wall interface.
4.3. Performance Test of Machined Cold Plate with Unbalanced Heat Load
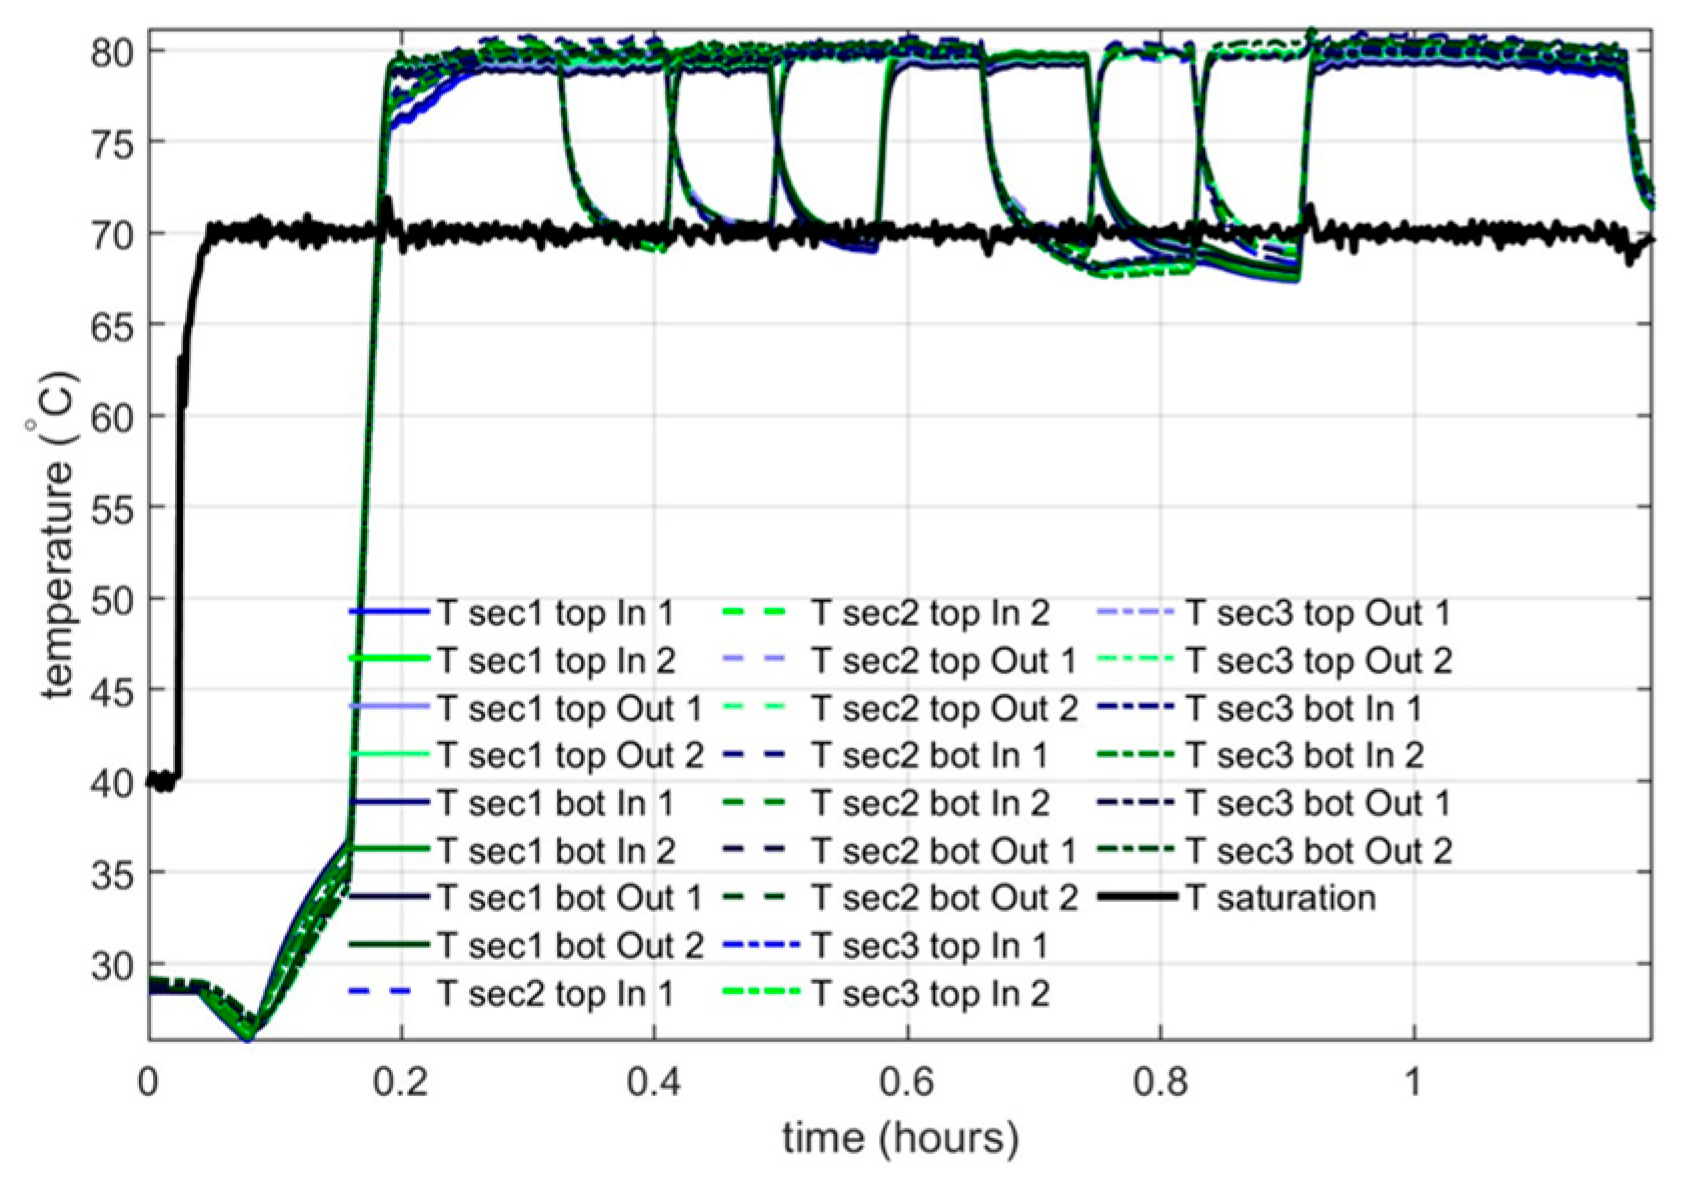
As part of the test campaign on the system’s modularity, a test was carried out with unbalanced heat load. Here, the machined cold plate was used for testing. An alternating sequence of the heat loads on the six heat sources was applied. The following sequence was applied: 1-1-1, 1-1-0, 1-0-1, 0-1-1, 1-1-1, 1-0-0, 0-1-0, 0-0-1, 1-1-1, where “1” indicates full load and “0” indicates zero load on the section. As highlighted in
Section 3, a section consists of a sandwich configuration of two heat loads. Hence, a section load of 2 kW total is determined.
In
Figure 16 and
Figure 17, the system temperatures and vapour mass fraction show performance as expected for the applied heat load profile. The vapour mass fraction shows a spike at t = 1.17 h, following incorrect shutdown of the system by human mistake.
The results of the cold plate temperature in
Figure 18 show expected behaviour, in line with the cold plate performance shown in
Section 4.2. A maximum temperature of 81 °C is shown. Even though heat load imbalance is introduced, no signs of flow imbalance are noted. This is a result of the pressure balancing method by restrictions, which mitigate the difference between liquid and two-phase pressure drop in the cold plate minichannels.
5. Conclusions
In the presented study, a successful technology demonstration of a two-phase mechanically pumped loop for power electronics cooling in more-electric aircraft is reported. Successful cold plate and system performance have been shown in both nominal and non-nominal operation. Furthermore, the choice for R1233zdE as a high-performance refrigerant with little HS&E disadvantages has been substantiated. The two-phase MPL, with R1233zdE as a working fluid, has a 40% lower system mass than a liquid MPL. This can be enhanced to 70% reduction when ammonia is considered as a working fluid.
With the achieved results presented here, the two-phase mechanically pumped loop for aircraft power electronics cooling has progressed to TRL4. This paper shows potential cooling system mass saving. Therefore, incorporation of two-phase cooling technology for power electronics cooling should be considered in next-generation aircraft system design.
Author Contributions
Conceptualization, A.K.t.N., J.v.E. and A.D.; methodology, A.K.t.N. and J.v.E.; software, A.K.t.N. and R.P.L.J.A.N.; validation, A.K.t.N., R.P.L.J.A.N. and A.D.; formal analysis, A.K.t.N. and A.D.; investigation, A.K.t.N., R.P.L.J.A.N. and A.D.; resources, J.v.E.; data curation, A.K.t.N.; writing—original draft preparation, A.K.t.N.; writing—review and editing, R.P.L.J.A.N., J.v.E. and A.D.; visualisation, A.K.t.N.; supervision, J.v.E.; project administration, J.v.E.; funding acquisition, J.v.E. All authors have read and agreed to the published version of the manuscript.
Funding
This ADENEAS project was co-funded by the European Union under GA number 101006728. This paper reflects the authors’ views. The EU cannot be held responsible for this paper.
Institutional Review Board Statement
Not applicable.
Informed Consent Statement
Not applicable.
Data Availability Statement
The raw data supporting the conclusions of this article will be made available by the authors upon request.
Conflicts of Interest
The funders had no role in the design of the study; in the collection, analyses, or interpretation of data; in the writing of the manuscript; or in the decision to publish the results.
References
- Van Es, J.; Pauw, A.; van Donk, G.; van Gerner, H.J.; Laudi, E.; He, Z.; Gargiulo, C.; Verlaat, B. AMS02 Tracker Thermal Control Cooling System commissioning and operational results. In Proceedings of the 43rd International Conference on Environmental Systems, Vail, CO, USA, 14–18 July 2013. [Google Scholar]
- Van Gerner, H.J.; te Nijenhuis, A.K.; Cao, C.; Castro, I.; Pedroso, D.A.; Dsouza, H. Two-phase pumped cooling system for power electronics, analyses and experimental results. In Proceedings of the 2024 30th International Workshop on Thermal Investigations of ICs and Systems (THERMINIC), Toulouse, France, 25–27 September 2024. [Google Scholar]
- Van Gerner, H.J.; Luten, T.; Scholten, S.; Mühltaler, G.; Buntz, M.-B. Test results for a novel 20 kW two-phase pumped cooling system for aerospace applications. 2025; in publication. [Google Scholar]
- Hewitt, G.; Roberts, D. Studies of Two-Phase Flow Patterns by Simultaneous X-Ray and Flast Photography; AERE-M-2159; Atomic Energy Research Establishment: Harwell, UK, 1969. [Google Scholar]
- Lemmon, E.; Huber, M.; McLinden, M. NIST-Standard Reference Database 23: Reference Fluid Thermodynamic and Transport Properties—REFPROP—Version 9.1; National Institute of Standards and Technology, Standard Reference Data Program: Gaithersburg, MD, USA, 2013. [Google Scholar]
- Van Gerner, H.J.; van Benthem, R.C.; van Es, J.; Schwaller, D.; Lapensée, S. Fluid selection for space thermal control systems. In Proceedings of the International Conference on Environmental Systems, San Diego, CA, USA, 15–19 July 2014. [Google Scholar]
- NFPA 704; Standard System for the Identification of the Hazards of Materials for Emergency Response. NFPA: Quincy, MA, USA, 2022.
Figure 1.
Schematic drawing of a two-phase mechanically pumped loop.
Figure 1.
Schematic drawing of a two-phase mechanically pumped loop.
Figure 2.
Calculated temperature in a two-phase mechanically pumped loop for an aircraft case, with R1233zdE as the working fluid.
Figure 2.
Calculated temperature in a two-phase mechanically pumped loop for an aircraft case, with R1233zdE as the working fluid.
Figure 3.
Calculated vapour mass fraction in a two-phase mechanically pumped loop for an aircraft case, with R1233zdE as the working fluid.
Figure 3.
Calculated vapour mass fraction in a two-phase mechanically pumped loop for an aircraft case, with R1233zdE as the working fluid.
Figure 4.
System mass comparison for a liquid and two-phase MPL.
Figure 4.
System mass comparison for a liquid and two-phase MPL.
Figure 5.
Two-phase MPL demonstrator during lab operation in CAD.
Figure 5.
Two-phase MPL demonstrator during lab operation in CAD.
Figure 6.
Two-phase MPL demonstrator during lab operation.
Figure 6.
Two-phase MPL demonstrator during lab operation.
Figure 7.
Additively manufactured cold plate in CAD.
Figure 7.
Additively manufactured cold plate in CAD.
Figure 8.
Additively manufactured cold plate as installed in demonstrator system.
Figure 8.
Additively manufactured cold plate as installed in demonstrator system.
Figure 9.
Machined cold plate in CAD.
Figure 9.
Machined cold plate in CAD.
Figure 10.
Machined cold plate’s internal flow geometry.
Figure 10.
Machined cold plate’s internal flow geometry.
Figure 11.
Measured temperatures at locations throughout two-phase MPL demonstrator.
Figure 11.
Measured temperatures at locations throughout two-phase MPL demonstrator.
Figure 12.
Measured vapour mass fraction.
Figure 12.
Measured vapour mass fraction.
Figure 13.
Measured temperatures at additively manufactured cold plate interface.
Figure 13.
Measured temperatures at additively manufactured cold plate interface.
Figure 14.
Measured vapour mass fraction.
Figure 14.
Measured vapour mass fraction.
Figure 15.
Measured cold plate temperatures.
Figure 15.
Measured cold plate temperatures.
Figure 16.
Measured temperatures at locations throughout two-phase MPL demonstrator.
Figure 16.
Measured temperatures at locations throughout two-phase MPL demonstrator.
Figure 17.
Measured vapour mass fraction.
Figure 17.
Measured vapour mass fraction.
Figure 18.
Measured temperatures at machined cold plate interface.
Figure 18.
Measured temperatures at machined cold plate interface.
Table 1.
Relevant properties of potential working fluids at 70 °C for two-phase MPL. In blue, the cooling system analysis results are shown. In green, the HS&E aspects of the fluids are shown.
Table 1.
Relevant properties of potential working fluids at 70 °C for two-phase MPL. In blue, the cooling system analysis results are shown. In green, the HS&E aspects of the fluids are shown.
| | NH3 | R134a | R1234zeE | R1234yf | R236fa | R245fa | R1233zdE |
| Figure of Merit | 1.2 × 10¹³ | 1.3 × 10¹² | 1.0 × 10¹² | 9.2 × 10¹¹ | 7.3 × 10¹¹ | 7.0 × 10¹¹ | 5.9 × 10¹¹ |
| Pressure at 70 °C (bar) | 33.0 | 21.1 | 16.1 | 20.4 | 9.8 | 6.1 | 5.1 |
| Pressure at 20 °C (bar) | 8.5 | 5.7 | 4.3 | 5.9 | 2.3 | 1.2 | 1.1 |
| Triple point (°C) | −78 | −103 | −104 | −150 | −93 | −103 | −78 |
| Enthalpy hlv (kJ/kg) | 940 | 125 | 124 | 97 | 115 | 162 | 165 |
| Spec. heat cp (kJ/kgK) | 5.47 | 1.80 | 1.65 | 1.83 | 1.39 | 1.44 | 1.31 |
| Liq. density ρl (kg/m3) | 527 | 997 | 986 | 884 | 1185 | 1205 | 1145 |
| Liq./vap. density ratio | 19.9 | 8.6 | 10.8 | 6.7 | 17.4 | 35.9 | 42.4 |
| ∂Tsat/∂psat (°C/bar) | 1.3 | 2.1 | 2.7 | 2.3 | 4.1 | 6.1 | 7.5 |
| Req. massflow (g/s) | 9.1 | 68.8 | 69.1 | 88.7 | 74.6 | 52.9 | 52.0 |
| Req. vol. flow (lpm) | 1.0 | 4.1 | 4.2 | 6.0 | 3.8 | 2.6 | 2.7 |
| Tube diameter (mm) | 7.7 | 12.5 | 13.0 | 13.4 | 14.2 | 14.3 | 14.7 |
| NFPA (flam-tox-stab) | 3-1-0 | 1-0-1 | 2-1-0 | 2-2-0 | 1-0-0 | 2-1-0 | 2-0-0 |
| Global Warming Pot. | 0 | 1530 | 1.4 | 0.5 | 8690 | 962 | 3.9 |
| Future availability | Good | Phase-out | Good | Prob. good | Phase-out | Phase-out | Good |
| Disclaimer/Publisher’s Note: The statements, opinions and data contained in all publications are solely those of the individual author(s) and contributor(s) and not of MDPI and/or the editor(s). MDPI and/or the editor(s) disclaim responsibility for any injury to people or property resulting from any ideas, methods, instructions or products referred to in the content. |
© 2025 by the authors. Licensee MDPI, Basel, Switzerland. This article is an open access article distributed under the terms and conditions of the Creative Commons Attribution (CC BY) license (https://creativecommons.org/licenses/by/4.0/).


