Abstract
Glaucoma, a primary cause of irreversible blindness, necessitates early detection to prevent significant vision loss. In the literature, fundus imaging is identified as a key tool in diagnosing glaucoma, which captures detailed retina images. However, the manual analysis of these images can be time-consuming and subjective. Thus, this paper presents an automated system for glaucoma detection using fundus images, combining diverse feature extraction methods with advanced classifiers, specifically Support Vector Machine (SVM) and AdaBoost. The pre-processing step incorporated image enhancement via Contrast-Limited Adaptive Histogram Equalization (CLAHE) to enhance image quality and feature extraction. This work investigated individual features such as the histogram of oriented gradients (HOG), local binary patterns (LBP), chip histogram features, and the gray-level co-occurrence matrix (GLCM), as well as their various combinations, including HOG + LBP + chip histogram + GLCM, HOG + LBP + chip histogram, and others. These features were utilized with SVM and Adaboost classifiers to improve classification performance. For validation, the ACRIMA dataset, a public fundus image collection comprising 369 glaucoma-affected and 309 normal images, was used in this work, with 80% of the data allocated for training and 20% for testing. The results of the proposed study show that different feature sets yielded varying accuracies with the SVM and Adaboost classifiers. For instance, the combination of LBP + chip histogram achieved the highest accuracy of 99.29% with Adaboost, while the same combination yielded a 65.25% accuracy with SVM. The individual feature LBP alone achieved 97.87% with Adaboost and 98.58% with SVM. Furthermore, the combination of GLCM + LBP provided a 98.58% accuracy with Adaboost and 97.87% with SVM. The results demonstrate that CLAHE and combined feature sets significantly enhance detection accuracy, providing a reliable tool for early and precise glaucoma diagnosis, thus facilitating timely intervention and improved patient outcomes.
1. Introduction
Glaucoma is a leading cause of vision loss globally. It is a neurodegenerative eye condition that develops due to increased intraocular pressure within the eye. Glaucoma is the second-most common cause of blindness globally and can result in total vision loss if it is not detected and treated promptly. It is a condition that results from damage to the optic nerves, which are responsible for transferring visual signals from the retina to the brain [1]. When the optic nerves are impaired, the brain cannot process visual information correctly. This damage is frequently produced by elevated pressure within the eye. The early detection of glaucoma is crucial, as regular eye exams and timely treatment can help prevent further vision loss. While treatment can preserve existing vision, it cannot restore damaged nerve tissue. If diagnosed at an advanced stage, the disease may lead to significant, irreversible damage to the optic nerve, potentially resulting in central vision loss and blindness. Hence, early diagnosis is a key to manage the condition effectively [2,3]. Preventing vision loss from glaucoma relies on early detection and proper treatment, making diagnosing the condition in its early stages essential. Traditional diagnostic techniques in medical practice rely on instruments such as corneal pachymetry, goniolenses, tonometers, optical coherence tomography (OCT), scanning laser polarimetry (SLP), and scanning laser ophthalmoscopes (SLO), but their manual operation often proves to be time-consuming.
Color fundus imaging allows for the analysis of key eye structures, including the optic disc, macula, and retina. It is a cost-effective technique compared to previous imaging methods. These tools operate using optical and mechanical principles, but they have limitations, including being labor-intensive, less accurate, and challenging for diagnosing early-stage glaucoma. Additionally, due to the shortage of skilled ophthalmologists, manually screening all potential glaucoma patients is difficult. As a result, computerized methods are essential for the more efficient, accurate, and reliable early diagnosis of glaucoma. In recent years, machine learning (ML) and deep learning (DL) techniques have been applied in various applications such as medical image classification and segmentation, smart energy, etc. [4,5,6,7]. While traditional ML methods offer quick results, they rely on structured data and require manual feature extraction, which can introduce errors due to human oversight.
2. Related Work
Glaucoma is an eye condition characterized by increased intraocular pressure, which can be categorized into two types: open-angle glaucoma and closed-angle glaucoma. This pressure increase is primarily due to the flow restriction of aqueous humor within the eye. Various tests have been conducted to diagnose the disease. A deformable model was developed in [8] to outline fluid-filled regions in the retina. The method included these phases: first, the input image was denoised utilizing Gaussian filtering to minimize speckle noise; then, an edge map was created and normalized for further processing. A novel network, referred to as self-ONNs, was introduced in [9] for analyzing fundus images in glaucoma detection. GoogleNet, pre-trained on a large dataset, was employed for the early detection of glaucoma. A two-stage approach was introduced, starting with cropping an image to focus on the region of interest (ROI), followed by using a pre-trained neural network to diagnose glaucoma [10]. A new glaucoma detection approach uses QB-VMD [11] to decompose retinal images, followed by PHOG and Haralick texture feature extraction. This method leverages both shape and texture features for diagnosis. The paper in [12] utilized an adapted version of GoogleNet. The methodology consisted of two stages: (1) identifying the region of interest (ROI) and (2) classifying the image. In the study in [13], five ImageNet-trained models were utilized for automated glaucoma assessment from fundus images. Deep features were extracted with a new CNN [14] model and used for classification with traditional machine learning methods, including Adaboost, k-nearest neighbors (kNNs), Random Forest (RF), Multilayer Perceptron (MLP), Support Vector Machine (SVM), and Naive Bayes (NB). The paper in [15] introduced a a comprehensive deep learning model for detecting glaucoma from fundus images. The study introduced CoG-NET [16], a deep learning network designed for glaucoma prediction. The paper in [17] proposed an explainable AI model for automatic glaucoma detection using pre-trained CNNs to obtain features and machine learning classifiers to categorize images. Performance evaluation involved selecting optimal CNN and classifier parameters. Further, this method was proposed in [18] to first obtain the optic disc from fundus images utilizing image segmentation. Glaucoma diagnosis was then performed by applying deep learning networks to the segmented optic disc images. A technique was proposed in [19] to apply RGB channel weighting for processing fundus images in glaucoma classification. However, this method only led to slight improvements in the efficiency of glaucoma diagnosis.
A novel combination of HOG, LBP, GLCM, and chip histogram features is used for glaucoma detection, enhancing texture and shape representation in fundus images. A comparison of Adaboost and SVM shows that Adaboost achieves superior accuracy, especially with the HOG, LBP, and chip histogram combination. This hybrid approach improves glaucoma detection effectively.
3. Materials and Methods
This section provides a detailed overview of the dataset, experimental setup, and methodology for the detection of glaucoma in fundus images.
3.1. Dataset
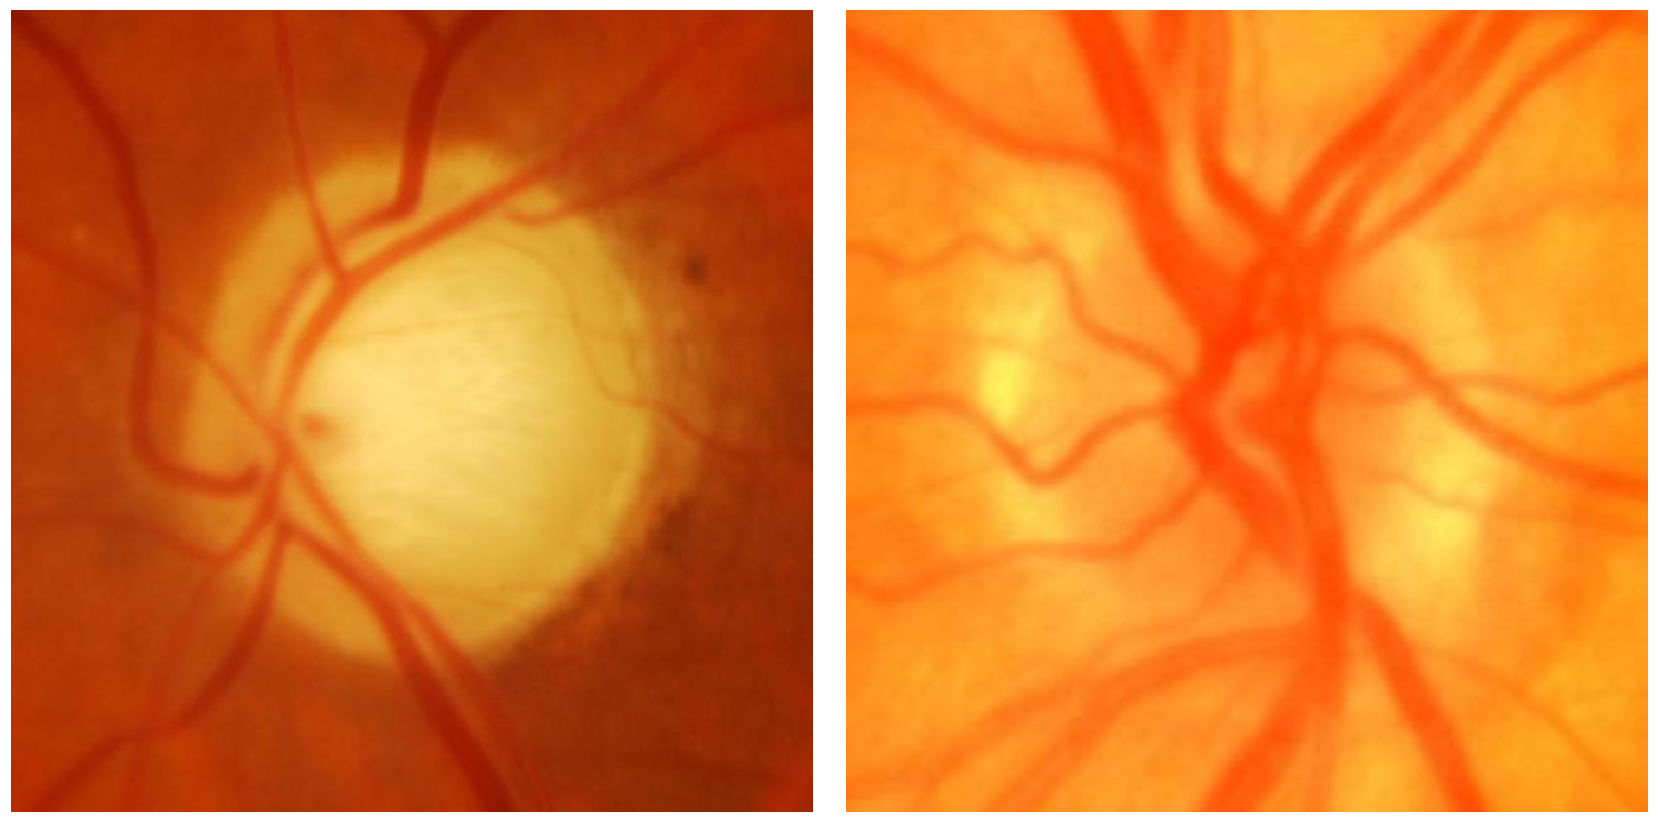
In this work, the ACRIMA [13] fundus image dataset was used, comprising 705 images, including 396 glaucomatous and 309 normal cases, collected from patients at FISABIO Oftalmología Médica in Valencia, Spain. These images, centered on the optic disc and taken after pupil dilation, were captured using a Topcon TRC retinal camera with a 35° visual range. Images with artifacts or poor contrast were discarded. Two glaucoma experts, each with 8 years of experience, annotated images without additional clinical information. Released in March 2019, the ACRIMA dataset is widely used for glaucoma classification tasks, though it lacks optic disc and cup segmentation data. Figure 1 compares the retinal image of an individual diagnosed with glaucoma and that of a normal image.
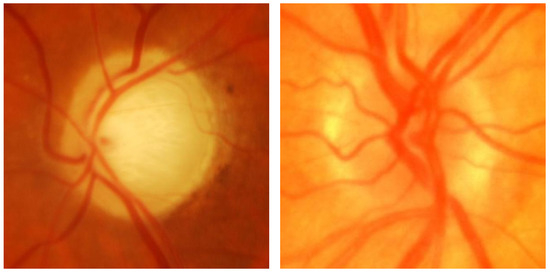
Figure 1.
(Left) Glaucoma-affected image; (right) normal image.
3.2. Methodology
Figure 2 shows the workflow of the proposed method for glaucoma detection, and it is briefly outlined in the below sub-sections.
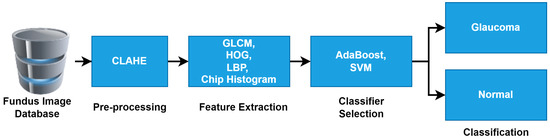
Figure 2.
Workflow of proposed method for detection of glaucoma in fundus images.
3.2.1. Input Fundus Images
The system used fundus images as the input from the ACRIMA dataset, which includes 396 glaucoma-affected and 309 normal images.
3.2.2. Pre-Processing
The CLAHE preprocessing method was utilized to improve image quality and contrast, preparing the images for effective feature extraction. CLAHE was chosen because it enhances local contrast in fundus images, making subtle features, such as texture variations around the optic disc, more distinguishable, which is crucial for accurate glaucoma detection.
3.2.3. Feature Extraction
Various feature extraction methods were used, both individually and in combination, to capture significant image features such as the GLCM, the HOG, LBP, and the chip histogram.
The GLCM is a feature extraction method that captures second-order texture information by analyzing the spatial relationship between pixel intensities in an image. In glaucoma detection, texture features such as those derived from the GLCM can be crucial for identifying subtle changes in the retinal structure. The HOG is a feature extraction method that focuses on capturing edge directions and shapes in an image by computing gradient orientation histograms. The HOG is often used in computer vision tasks, especially for detecting objects or shapes, which makes it a useful feature extraction method for glaucoma detection where structural changes in the optic nerve head are critical. LBP are a texture-based feature extraction method that focus on capturing local texture information by comparing pixel intensities in a local neighborhood. They are particularly effective for identifying patterns in texture variations, which are critical in detecting structural changes in the optic nerve head for glaucoma diagnosis. The chip histogram is a feature extraction method that summarizes pixel intensity distributions in localized regions or “chips” of an image. This method focuses on capturing intensity variations in specific areas of fundus images, which can be informative in identifying regions affected by glaucoma. These features were evaluated individually and in various combinations (e.g., LBP + chip histogram, GLCM + LBP) to assess their impact on classification performance.
3.2.4. Classification
For classification, two advanced classifiers, SVM and AdaBoost, were chosen. SVM was selected due to its strong theoretical foundation and effectiveness in handling high-dimensional feature spaces, making it a common choice in medical image classification. It works by finding the optimal hyperplane that maximally separates the data points belonging to different classes. SVM is effective in high-dimensional spaces and is particularly useful when the number of dimensions exceeds the number of samples, which makes it ideal for complex image classification tasks such as glaucoma detection. AdaBoost is an ensemble learning algorithm that combines multiple weak classifiers to form a strong classifier. The algorithm adjusts the weights of incorrectly classified instances, forcing subsequent classifiers to focus on these harder cases. AdaBoost is particularly useful when the base classifiers (or weak learners) are simple and prone to errors individually but perform well when combined. AdaBoost was chosen for its ability to create a strong ensemble classifier by focusing iteratively on misclassified samples. AdaBoost’s strength in handling complex and non-linear data distributions made it a valuable addition, particularly for feature sets that might introduce complexity or noise.
3.2.5. Training and Testing
The dataset was split into 80% for training and 20% for testing. The system was trained using different feature sets to observe how various combinations affected classification performance. In the training phase, both classifiers were trained on the extracted features. The SVM classifier was trained using the different extracted features. SVM attempted to find the optimal hyperplane that separated glaucoma and healthy samples in the feature space. The classifier was trained using both individual and combined feature sets. The AdaBoost classifier was trained with the same features. It worked by combining multiple weak classifiers, iteratively focusing on misclassified instances to improve overall classification accuracy. AdaBoost adapted to the training data, particularly targeting more difficult-to-classify images as the training progressed. After training, the trained models were tested on the remaining 20% of the dataset (testing set) to evaluate their ability to generalize to new, unseen data. Each feature set was evaluated with both classifiers (SVM and AdaBoost) to assess their performance, using accuracy as the primary metric.
4. Results
The effectiveness of the proposed automated glaucoma detection system was evaluated utilizing various feature extraction methods and their combinations, classified with both the SVM and AdaBoost classifiers. Table 1 illustrates the outcomes of the proposed method that demonstrate the effectiveness of different feature sets and highlight the significant variations in classifier performance depending on the feature combination.

Table 1.
The performance of each feature and combination of features, showing the differences between the SVM and AdaBoost classifiers.
4.1. Individual Feature Performance
From Table 1, LBP alone provided strong results with both classifiers, reaching 97.87% with AdaBoost and 98.58% with SVM. This indicates that LBP are a robust feature for detecting glaucoma-related texture changes in fundus images. The chip histogram alone produced a lower accuracy than the other three feature sets.
4.2. Feature Combination Performance
4.2.1. LBP + Chip Histogram (3 + 4):
This combination yielded the highest accuracy with the AdaBoost classifier, achieving a remarkable 99.29%. However, the same feature set performed poorly with SVM, yielding only a 65.25% accuracy. The disparity suggests that the non-linear complexity of this feature set was better handled by AdaBoost’s ensemble method, while SVM struggled with separability in the high-dimensional space. Figure 3 presents the confusion matrices for the LBP + chip histogram features combination.
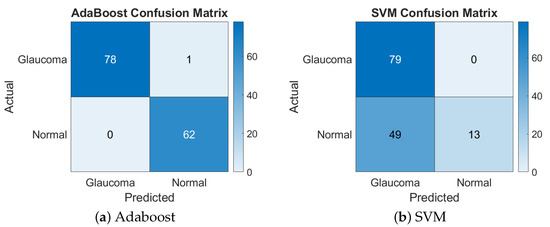
Figure 3.
Confusion matrices of Adaboost and SVM for LBP + chip histogram.
4.2.2. GLCM + LBP (1 + 3):
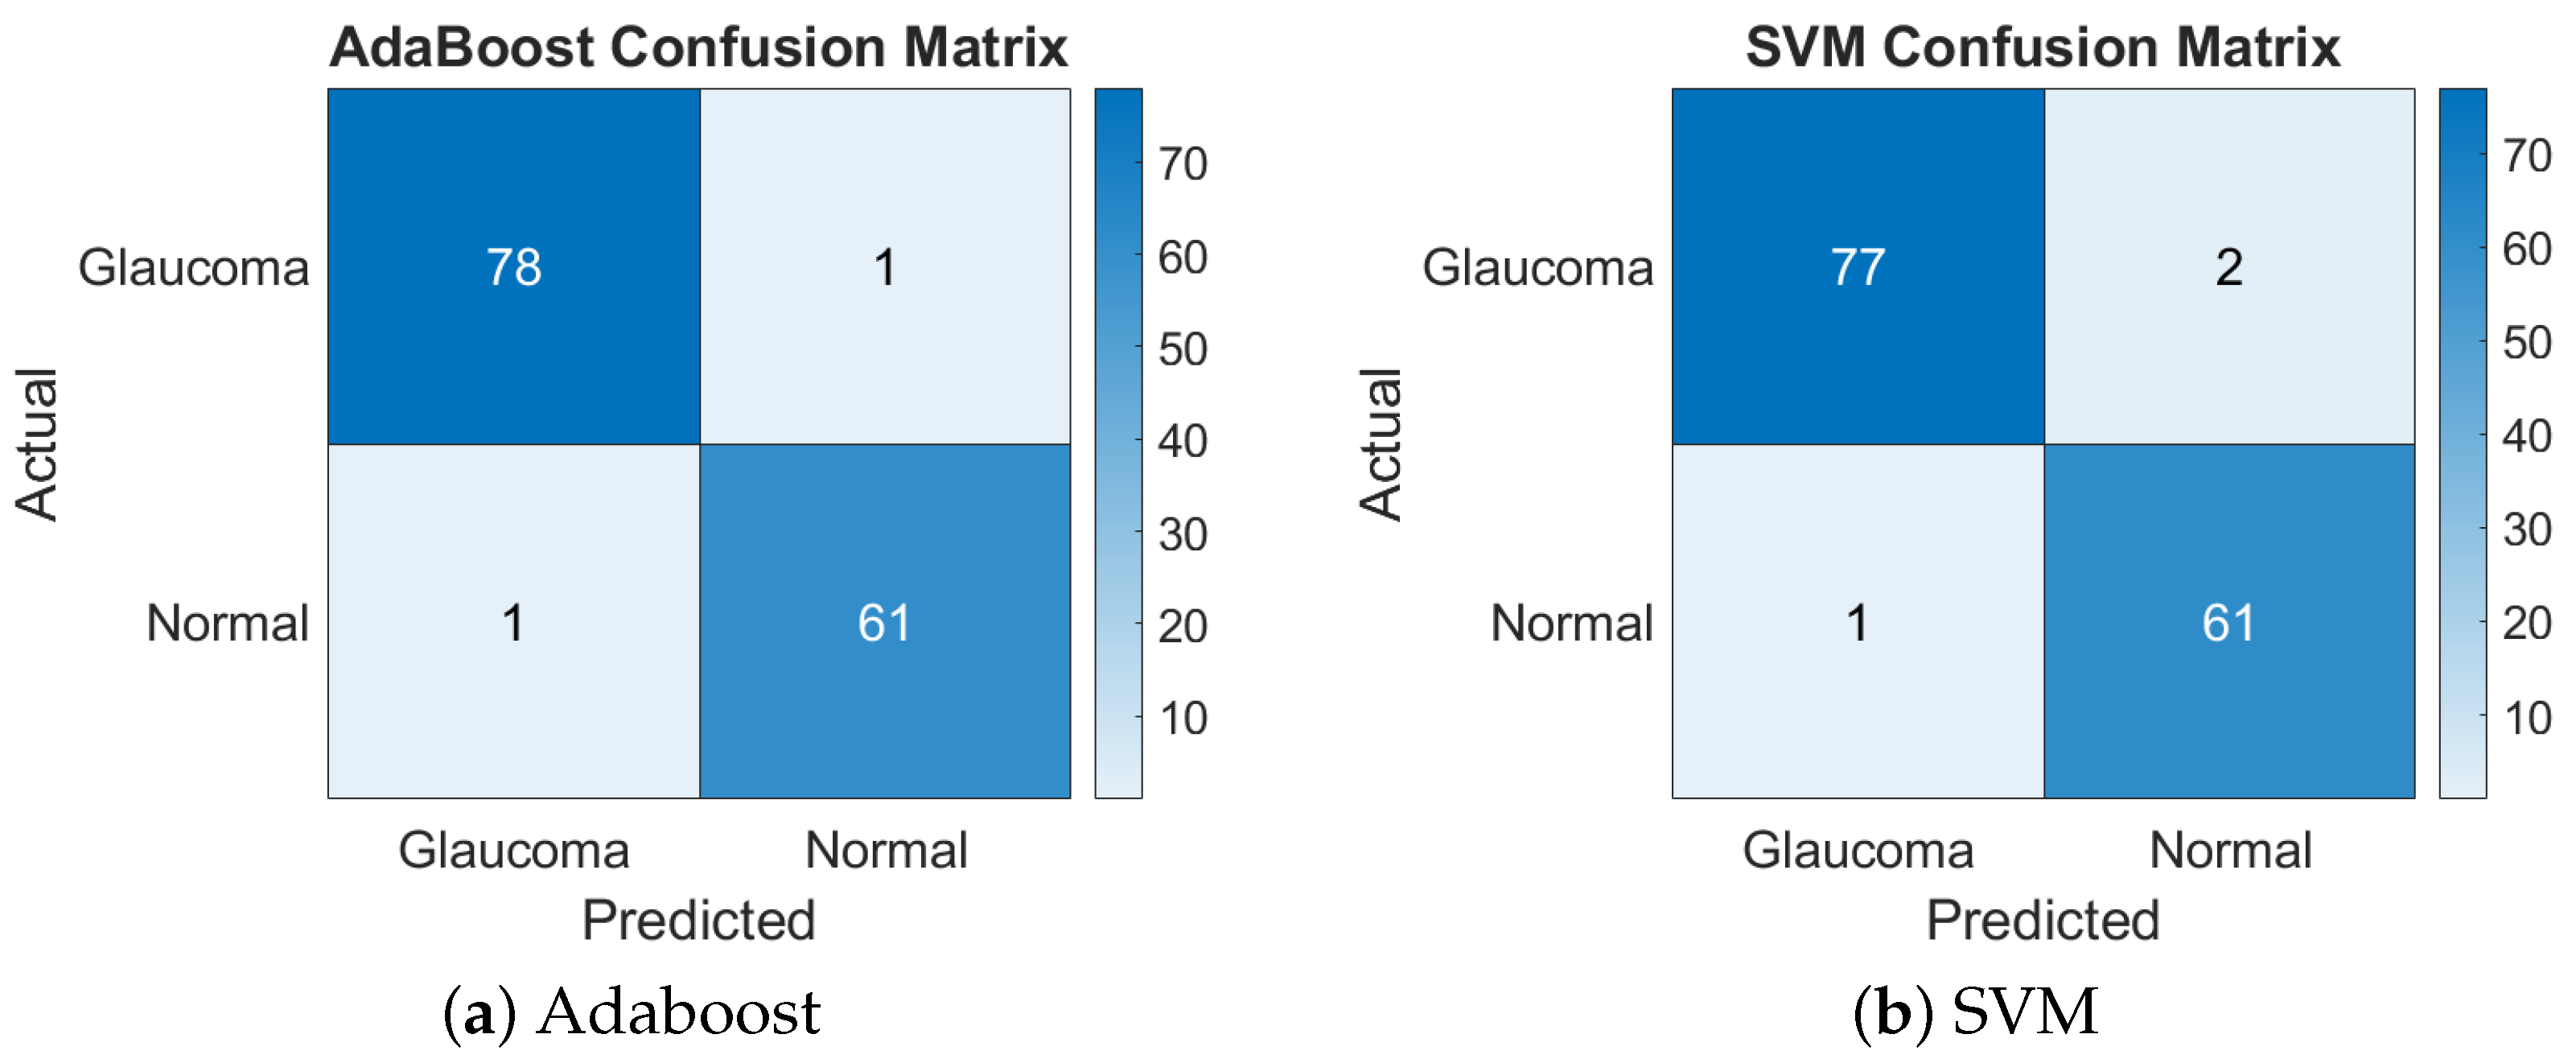
This feature combination achieved a balanced performance with both classifiers, resulting in a 98.58% accuracy with AdaBoost and a 97.87% accuracy with SVM. The similarity in performance suggests that these features provided a well-structured representation of the image data that both classifiers could handle effectively. Figure 4 presents the confusion matrices for the GLCM + LBP features combination.
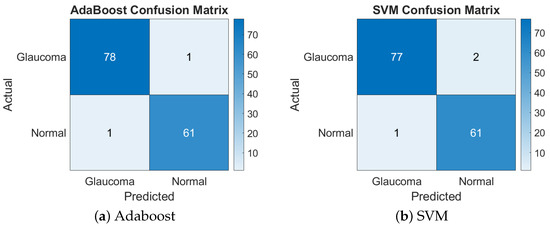
Figure 4.
Confusion matrices of Adaboost and SVM for GLCM + LBP.
4.2.3. GLCM + LBP + Chip Histogram (1 + 3 + 4):
For the combination of the GLCM, LBP, and the chip histogram (1 + 3 + 4), AdaBoost yielded the highest accuracy of 99.29%, but SVM only achieved 65.25%, showing that ADB handled this feature set much better than SVM. Figure 5 presents the confusion matrices for the GLCM + LBP + chip histogram features combination.
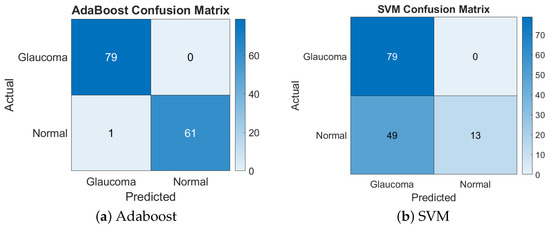
Figure 5.
Confusion matrices of Adaboost and SVM for GLCM + LBP + chip histogram.
Table 2 provides a comparative analysis of various state-of-the-art methods for glaucoma detection from fundus images, highlighting their respective accuracies. Methods such as Adapted GoogleNet [12] achieved an accuracy of 86.4%, while [10], using GoogleNet pre-trained on a large dataset, obtained a 95.31% accuracy. [9] proposed Self-ONNs, which achieved a 94.5% accuracy, while [16] introduced CoG-NET, reaching 95.3%. The proposed method using Adaboost with a combination of HOG, LBP, and chip histogram features resulted in the highest accuracy of 99.29%, outperforming other methods. The SVM classifier also showed strong performance with a 97.87% accuracy when using GLCM and LBP feature combinations, although it performed lower (65.25%) when combined with HOG, LBP, and chip histogram features. This comparison shows the effectiveness of the proposed method, especially when leveraging Adaboost, which surpasses previous works in terms of accuracy for glaucoma detection.
Table 2.
A comparison of the proposed method’s results with some state-of-the-art methods.
5. Conclusions
In conclusion, this study presents an effective automated system for glaucoma detection using fundus images by integrating various feature extraction methods with advanced classifiers. The application of CLAHE for image enhancement significantly improved feature visibility, which, in combination with diverse feature extraction techniques, contributed to the system’s overall performance. The results demonstrate that different combinations of features had a significant impact on classification accuracy. Specifically, the combination of LBP + the chip histogram achieved the highest accuracy with AdaBoost, while other feature sets such as the GLCM + LBP also delivered strong performance across both classifiers. AdaBoost consistently outperformed SVM in handling complex feature combinations, highlighting its robustness for this application. The proposed method, with its high accuracy rates, offers a reliable tool for early glaucoma diagnosis, which is crucial for preventing irreversible vision loss and improving patient outcomes.
Author Contributions
Conceptualization, V.K.V. and J.V.; formal analysis, P.P.K.; investigation, V.K.V. and J.V.; software, V.K.V. and P.P.K.; supervision and Validation, Y.V.P.K.; writing—original draft, V.K.V. and J.V.; writing—review and editing, Y.V.P.K. All authors have read and agreed to the published version of the manuscript.
Funding
This research received no external funding.
Institutional Review Board Statement
Not applicable.
Informed Consent Statement
Not applicable.
Data Availability Statement
The original data presented in the study are openly available in ACRIMA database at https://figshare.com/s/c2d31f850af14c5b5232 (accessed on 24 November 2024).
Conflicts of Interest
The authors declare no conflicts of interest.
Abbreviations
The following abbreviations are used in this manuscript:
| CLAHE | Contrast-Limited Adaptive Histogram Equalization |
| CNN | Convolutional neural network |
| OCT | Optical coherence tomography |
| DL | Deep learning |
| GLCM | Gray-level co-occurrence matrix |
| HOG | Histogram of oriented gradients |
| LBP | Local binary patterns |
| ML | Machine learning |
| SLO | Scanning laser ophthalmoscopes |
| SLP | Scanning laser polarimetry |
| SVM | Support Vector Machine |
References
- Zilly, J.; Buhmann, J.M.; Mahapatra, D. Glaucoma detection using entropy sampling and ensemble learning for automatic optic cup and disc segmentation. Comput. Med Imaging Graph. 2017, 55, 28–41. [Google Scholar] [CrossRef] [PubMed]
- Shinoj, V.; Hong, X.J.J.; Murukeshan, V.; Baskaran, M.; Tin, A. Progress in anterior chamber angle imaging for glaucoma risk prediction–A review on clinical equipment, practice and research. Med Eng. Phys. 2016, 38, 1383–1391. [Google Scholar]
- Shinde, R. Glaucoma detection in retinal fundus images using U-Net and supervised machine learning algorithms. Intell.-Based Med. 2021, 5, 100038. [Google Scholar] [CrossRef]
- Chalapathi, M.M.V.; Vali, D.K.; Kumar, Y.V.P.; Reddy, C.P.; Kasaraneni, P.P. An Insight Into Viable Machine Learning Models for Early Diagnosis of Cardiovascular Disease. Scalable Comput. Pract. Exp. 2024, 25, 187–203. [Google Scholar] [CrossRef]
- Kasaraneni, P.P.; Venkata Pavan Kumar, Y.; Moganti, G.L.K.; Kannan, R. Machine Learning-Based Ensemble Classifiers for Anomaly Handling in Smart Home Energy Consumption Data. Sensors 2022, 22, 9323. [Google Scholar] [CrossRef] [PubMed]
- Hacisoftaoglu, R.E.; Karakaya, M.; Sallam, A.B. Deep learning frameworks for diabetic retinopathy detection with smartphone-based retinal imaging systems. Pattern Recognit. Lett. 2020, 135, 409–417. [Google Scholar] [CrossRef] [PubMed]
- Anoop, B. Binary classification of DR-diabetic retinopathy using CNN with fundus colour images. Mater. Today Proc. 2022, 58, 212–216. [Google Scholar]
- Fernandez, D.C. Delineating fluid-filled region boundaries in optical coherence tomography images of the retina. IEEE Trans. Med. Imaging 2005, 24, 929–945. [Google Scholar] [CrossRef] [PubMed]
- Devecioglu, O.C.; Malik, J.; Ince, T.; Kiranyaz, S.; Atalay, E.; Gabbouj, M. Real-time glaucoma detection from digital fundus images using self-onns. IEEE Access 2021, 9, 140031–140041. [Google Scholar] [CrossRef]
- Claro, M.; Veras, R.; Santana, A.; Araujo, F.; Silva, R.; Almeida, J.; Leite, D. An hybrid feature space from texture information and transfer learning for glaucoma classification. J. Vis. Commun. Image Represent. 2019, 64, 102597. [Google Scholar] [CrossRef]
- Sonti, K.; Dhuli, R. Shape and texture based identification of glaucoma from retinal fundus images. Biomed. Signal Process. Control 2022, 73, 103473. [Google Scholar] [CrossRef]
- Cerentini, A.; Welfer, D.; Cordeiro d’Ornellas, M.; Pereira Haygert, C.J.; Dotto, G.N. Automatic identification of glaucoma using deep learning methods. In MEDINFO 2017: Precision Healthcare Through Informatics; IOS Press: Amsterdam, The Netherlands, 2017; pp. 318–321. [Google Scholar]
- Diaz-Pinto, A.; Morales, S.; Naranjo, V.; Köhler, T.; Mossi, J.M.; Navea, A. CNNs for automatic glaucoma assessment using fundus images: An extensive validation. Biomed. Eng. Online 2019, 18, 1–19. [Google Scholar] [CrossRef] [PubMed]
- Oguz, C.; Aydin, T.; Yaganoglu, M. A CNN-based hybrid model to detect glaucoma disease. Multimed. Tools Appl. 2024, 83, 17921–17939. [Google Scholar] [CrossRef]
- Serte, S.; Serener, A. A generalized deep learning model for glaucoma detection. In Proceedings of the 2019 3rd International Symposium on Multidisciplinary Studies and Innovative Technologies (ISMSIT), Ankara, Turkey, 11–13 October 2019; IEEE: Piscataway, NJ, USA, 2019; pp. 1–5. [Google Scholar]
- Juneja, M.; Thakur, S.; Uniyal, A.; Wani, A.; Thakur, N.; Jindal, P. Deep learning-based classification network for glaucoma in retinal images. Comput. Electr. Eng. 2022, 101, 108009. [Google Scholar] [CrossRef]
- Velpula, V.K.; Sharma, D.; Sharma, L.D.; Roy, A.; Bhuyan, M.K.; Alfarhood, S.; Safran, M. Glaucoma detection with explainable AI using convolutional neural networks based feature extraction and machine learning classifiers. IET Image Process. 2024, 18, 3827–3853. [Google Scholar] [CrossRef]
- Singh, L.K.; Khanna, M. A novel multimodality based dual fusion integrated approach for efficient and early prediction of glaucoma. Biomed. Signal Process. Control 2022, 73, 103468. [Google Scholar] [CrossRef]
- de Moura Lima, A.C.; Maia, L.B.; Pereira, R.M.P.; Junior, G.B.; de Almeida, J.D.S.; de Paiva, A.C. Glaucoma diagnosis over eye fundus image through deep features. In Proceedings of the 2018 25th International Conference on Systems, Signals and Image Processing (IWSSIP), Maribor, Slovenia, 20–22 June 2018; IEEE: Piscataway, NJ, USA, 2018; pp. 1–4. [Google Scholar]


Disclaimer/Publisher’s Note: The statements, opinions and data contained in all publications are solely those of the individual author(s) and contributor(s) and not of MDPI and/or the editor(s). MDPI and/or the editor(s) disclaim responsibility for any injury to people or property resulting from any ideas, methods, instructions or products referred to in the content. |
© 2024 by the authors. Licensee MDPI, Basel, Switzerland. This article is an open access article distributed under the terms and conditions of the Creative Commons Attribution (CC BY) license (https://creativecommons.org/licenses/by/4.0/).