Abstract
The electrical stimulation of the primary occipital cortex can evoke luminous perceptions known as phosphenes, forming the basis for cortical visual prostheses for blind individuals. In this study, cortical dynamics during phosphene perception were investigated in a blind subject implanted with a 10 × 10 Utah microelectrode array in the visual cortex. EEG analyses revealed significant event-related synchronization/desynchronization (ERS/ERD) differences in the 4–7.5 Hz range, primarily in frontal regions, 250–750 ms post-stimulus. Connectivity analysis using the directed transfer function (DTF) showed directional connections from temporal to frontal areas during perception. These findings provide preliminary insights into the cortical dynamics associated with phosphene perception and highlight the potential of EEG for characterizing neural activity in such contexts.
1. Introduction
Scientific evidence has demonstrated that electrical stimulation of the primary occipital cortex can evoke luminous visual perceptions known as phosphenes [1]. This finding has laid the groundwork for the development of cortical visual prostheses aimed at restoring vision in blind individuals [2]. In this context, understanding and unraveling the cortical perceptual dynamics involved in the process of phosphene perception is crucial to enhancing the interaction between this technology and its users.
In this study, cortical perceptual dynamics were investigated in a blind subject implanted with a 10 × 10 Utah microelectrode array in the visual cortex [2]. Cortical responses during the perception and non-perception of evoked phosphenes were recorded using electroencephalography (EEG) techniques. Additionally, functional features such as event-related synchronization/desynchronization (ERS/ERD) and effective cortical connectivity were characterized in both states.
2. Methods
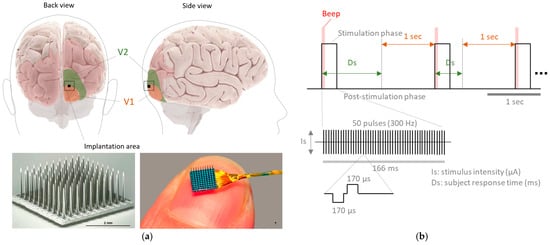
This study was conducted on a blind subject (fame aged 57 years) who was implanted with an intracortical microelectrode array (Utah Electrode Array, UEA; Blackrock Microsystems Inc., Salt Lake City, UT, USA) consisting of 96 stimulating electrodes in the visual cortex for a 6-month period. This implant is part of the procedures adopted for the implementation of a cortical visual neuroprosthesis, which is still under research and development within the CORTIVIS project (www.cortivis.org, accessed on 1 July 2024). The participant was diagnosed with toxic optic neuropathy and had been completely blind (no light perception) for 16 years prior to the study. She had good cognitive and functional abilities, was a Braille reader, and a regular user of accessible technologies for visually impaired individuals. Before participating in the study, she underwent a comprehensive medical and psychological assessment including clinical history, neurological and ophthalmological examinations, and evaluation of visual perception through transcranial magnetic stimulation [2]. The UEA was implanted in the right occipital cortex, near the occipital pole and close to the boundary between V1 and V2 (Figure 1a). All experimental, surgical, and pre-surgical procedures were conducted according to a protocol approved by the Clinical Research Committee of the General University Hospital of Elche and registered in ClinicalTrials.gov (NCT02983370). Furthermore, all relevant ethical guidelines pertaining to clinical trial regulations (EU No. 536/2014, repealing Directive 2001/20/EC), the Declaration of Helsinki, and European Commission Directives (2005/28/EC and 2003/94/EC) were followed. Written informed consent was obtained before any procedures were performed as part of this study.

Figure 1.
(a) Approximate region of the visual cortex where the UEA was implanted in the subject. (b) Experimental protocol used for the electrical stimulation of the primary visual cortex. Ds represents the response time taken by the subject to indicate whether a phosphene was perceived or not.
Over the six months of implantation, various experimental protocols of electrical stimulation were applied to the subject five times per week, with sessions lasting four hours each. The stimulation was delivered using a Cerestim multichannel current microstimulation system (Blackrock Microsystems Inc., Salt Lake City, UT, USA). Specifically, this study focuses on a psychometric testing protocol designed to determine stimulation thresholds [2].
To achieve this, the cortical region surrounding the implant was electrically stimulated using different amplitude parameters. After each stimulus, the participant indicated whether or not they perceived a phosphene. The stimulation protocol consisted of 166 ms trains of biphasic (−/+) pulses, each phase lasting 0.4 ms, delivered at a frequency of 300 Hz. The stimulus amplitudes ranged from 20 µA to 160 µA in 20 µA increments, with 0 µA considered as a control condition (Figure 1b). For each amplitude level, 10 randomized trials were administered, resulting in a total of 90 stimulation events. The 0 µA control condition was also part of the randomization. Approximately half of the trials led to the perception of phosphenes, while the remaining half did not.
In addition, a spatial mapping protocol was implemented to assess the localization of perceived phosphenes. The participant was instructed to report the position of each phosphene relative to the center of her visual field using a digitizing tablet equipped with a central tactile reference. She also provided qualitative descriptions of each percept in terms of shape, size, brightness, color, and possible motion. This procedure confirmed that the reported phosphenes were consistent with the expected retinotopic organization based on the cortical site of stimulation [2].
Cortical responses during the implementation of the stimulation protocol were recorded using electroencephalography (EEG) techniques. EEG signals were acquired with a NeuroScan SynAmps RT acquisition system (Compumedics, Charlotte, NC, USA), with electrodes placed at FpZ, AF7, AF8, Fz, FC5, FC6, T7, T8, P3, Pz, P4, PO7, PO3, PO4, PO8, and Oz positions, according to the international 10/20 system. Electrode impedance was maintained below 25 kΩ, and the sampling frequency was set to 1000 Hz.
Two distinct analyses were performed on the EEG signals. The first involved the estimation of Event-Related Desynchronization (ERD), following the methodological guidelines proposed by Kalcher and Pfurtscheller and specifically employing the inter-trial variance method [3]. Differences between the conditions of phosphene perception and non-perception were quantified by calculating the normalized difference between the mean ERD values, using their standard deviations (Dn). Statistical analysis of this difference was conducted using the Aspin-Welch T-test for unequal variances. ERD was evaluated in the following frequency bands: theta (4–7.5 Hz), alpha (8–12 Hz), low beta (13–19.5 Hz), and high beta (20–32 Hz). Additionally, an exploratory analysis was performed over the full frequency range (1–45 Hz) to assess broader patterns of desynchronization.
In a second analytical approach, effective connectivity between cortical areas was assessed in the frequency domain. This analysis characterized the perception and non-perception conditions of phosphenes based on the connectivity evoked in each situation. Effective connectivity, a key dimension of functional connectivity, refers to the causal influences exerted by one neural system on another and can be estimated using Granger causality analysis [4,5]. In this study, the Directed Transfer Function (DTF) was employed [6]. The DTF is a multivariate autoregressive spectral measure that determines the direction of influence between pairs of recording channels. Conceptually, it describes the causal influence that one channel exerts on another at a specific frequency [6].
Finally, after applying the DTF, a complex topological network was established, which was quantitatively described using various metrics derived from graph theory [7,8]. In this study, the clustering coefficient was utilized, a measure that quantifies the number of connections among a node’s nearest neighbors as a proportion of the maximum possible connections. This coefficient describes the specialized processing capacity that occurs within densely interconnected groups in different brain regions [9,10].
3. Results
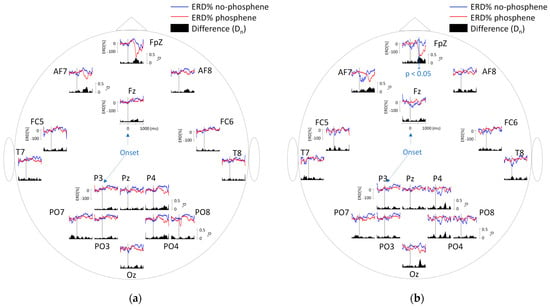
In Figure 2a, the EEG signal shows an increase in ERD in the 1–45 Hz range, primarily at FpZ, when the subject perceives a phosphene. The difference in ERD values between perception and non-perception was most pronounced between 500 and 1000 ms after stimulus onset. However, no significant differences were observed (p < 0.05). Significant differences between perception and non-perception were identified in the 4–7.5 Hz band at FpZ, approximately 600 ms after stimulus onset (Figure 2b). No significant differences were found in the remaining frequency bands.

Figure 2.
(a) ERD values obtained in the 1–45 Hz band. The area plots over time represent the differences (Dn values) between perception and non-perception. (b) ERD values obtained in the 4–7.5 Hz band, showing a significant difference at FpZ. The asterisk (*) indicates the time interval where the differences reached statistical significance.
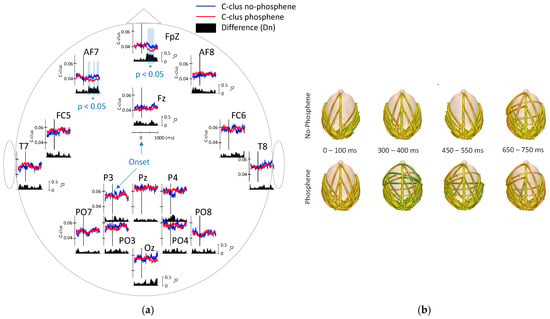
The DTF was estimated using a multivariate autoregressive (MVAR) model of order 9, selected based on the Schwarz Bayesian Criterion [11]. Time-varying DTF was obtained using a sliding window of 166 ms (sample by sample). Subsequently, the average clustering coefficients (C-clustering) were computed and graphically represented as a function of time. The results indicate that C-clustering values at FpZ decrease during the perception condition compared to the pre-stimulus interval (−500 to 0 ms) and significantly differ from the non-perception condition between 200 and 700 ms after the stimulus onset (Figure 3a). The DTF values were averaged over specific 100 ms intervals and are graphically represented in Figure 3b. This figure shows that phosphene perception evokes directional connections from temporal to central and frontal regions during the 300–400 ms and 450–550 ms intervals. Notably, these new connections reach the aforementioned regions with lower intensities, resulting in a decrease in C-clustering values (e.g., at electrode FpZ). This demonstrates that phosphene perception systematically increases interconnectivity between cortical areas, albeit at lower intensity levels compared to the baseline state.

Figure 3.
(a) Cortical connectivity analysis in the 4–7.5 Hz frequency band. C-clustering values are shown for phosphene perception (red line) and non-perception (blue line). Black regions denote the Dn values (normalized mean differences), while lightly shaded areas indicate time intervals with statistically significant differences, also marked with an asterisk (*). (b) Directional connectivity analysis in the 4–7.5 Hz frequency band using DTF. The DTF values were averaged within the corresponding intervals and are represented during the specified post-stimulus periods.
4. Discussion and Conclusions
In this study, we have preliminarily demonstrated that EEG signals are reactive to the processes of phosphene perception and non-perception. We observed that the energy of evoked oscillations was reduced (i.e., higher ERD) when phosphenes were perceived, with significant differences primarily localized in frontal and prefrontal electrodes (FpZ and AF7). These regions are typically associated with attentional control, conscious stimulus evaluation, and perceptual decision-making. This suggests that the ERD effects reflect higher-order cognitive processes rather than early sensory responses.
In terms of directional connectivity, a crossflow of cortical directional information is observed when phosphenes are perceived. The observed crossflow of directional cortical information is better understood as the result of large-scale cortical dynamics. Given the spatial resolution of EEG and the cortical origin of the recorded signals, our findings likely reflect interhemispheric integration and the engagement of associative cortical areas that support the coordination of activity during phosphene perception. Temporally, a dissociation was observed between connectivity and oscillatory activity: significant differences in effective connectivity were found starting at ~200 ms post-stimulation, whereas ERD differences emerged after ~500 ms. This suggests that early reconfigurations in large-scale cortical networks may precede the localized oscillatory changes associated with conscious perception. It is also important to note that this crossflow of directional information could be quantitatively studied using other graph theory parameters. In this study, the resulting network from the DTF analysis was assessed using the C-clustering coefficient, which may not necessarily capture this particular characteristic.
Finally, we conclude that although the conscious perception of evoked phosphenes may ultimately involve a broader set of brain regions, the current results demonstrate that these processes can be meaningfully studied at the cortical level using EEG. The combination of early changes in network connectivity and later frontal ERD modulations supports the idea that conscious phosphene perception emerges from the dynamic interaction of distributed cortical networks. In the context of cortical visual prostheses, quantifying perception evoked by cortical electrical stimulation could help optimize certain functional processes, as well as evaluate adaptability, learning, and the everyday use of this technology.
Author Contributions
Conceptualization, F.D.F. and E.F.; methodology, F.D.F., F.G., L.S., C.S.-S. and E.F.; software, F.D.F.; validation, F.D.F. and E.F.; formal analysis, F.D.F., F.G. and L.S.; investigation, F.D.F. and E.F.; resources, E.F.; data curation, F.D.F.; writing—original draft preparation, F.D.F.; writing—review and editing, F.D.F., F.G., L.S., C.S.-S. and E.F.; visualization, F.D.F.; supervision, E.F.; project administration, E.F.; funding acquisition, F.D.F. and E.F. All authors have read and agreed to the published version of the manuscript.
Funding
This work was supported by Grants PDC2022-133952-100 and PID2022-1416060B-100 from the Spanish “Ministerio de Ciencia, Innovación y Universidades,” by grant CIPROM/2023/25 from the Generalitat Valenciana, and by the European Union’s Horizon 2020 Research and Innovation Programme under Grant Agreement No. 899287 (NeuraViPeR).
Institutional Review Board Statement
All experimental, surgical, and pre-surgical procedures were conducted according to a protocol approved by the Clinical Research Committee of the General University Hospital of Elche and registered in ClinicalTrials.gov (NCT02983370). Furthermore, all relevant ethical guidelines pertaining to clinical trial regulations (EU No. 536/2014, repealing Directive 2001/20/EC), the Declaration of Helsinki, and European Commission Directives (2005/28/EC and 2003/94/EC) were followed.
Informed Consent Statement
Informed consent was obtained from all subjects involved in the study.
Data Availability Statement
The data presented in this study are available upon request from the corresponding authors.
Conflicts of Interest
The authors declare no conflict of interest.
References
- Fernández, E.; Pelayo, F.; Ammermüller, J.; Ahnelt, P.; Normann, R.A. Cortical Visual Neuroprostheses for the Blind. Available online: http://www.neuro-it.net/pdf_dateien/summer_2004/Fernandez%202004.PDF (accessed on 1 July 2024).
- Fernández, E.; Alfaro, A.; Soto-Sánchez, C.; Gonzalez-Lopez, P.; Lozano, A.M.; Peña, S.; Grima, M.D.; Rodil, A.; Gómez, B.; Chen, X.; et al. Visual percepts evoked with an intracortical 96-channel microelectrode array inserted in human occipital cortex. J. Clin. Investig. 2021, 131, e151331. [Google Scholar] [CrossRef] [PubMed]
- Kalcher, J.; Pfurtscheller, G. Discrimination between phase-locked and non-phase-locked event-related EEG activity. Electroencephalogr. Clin. Neurophysiol. 1995, 94, 381–384. [Google Scholar] [CrossRef] [PubMed]
- Kamiński, M.; Ding, M.; Truccolo, W.A.; Bressler, S.L. Evaluating causal relations in neural systems: Granger causality, directed transfer function and statistical assessment of significance. Biol. Cybern. 2001, 85, 145–157. [Google Scholar] [CrossRef] [PubMed]
- Blinowska, K.J.; Zygierewicz, J. Practical Biomedical Signal Analysis Using MATLAB, 1st ed.; CRC Press: Boca Raton, FL, USA, 2011. [Google Scholar]
- Kaminski, M.J.; Blinowska, K.J. A new method of the description of the information flow in the brain structures. Biol. Cybern. 1991, 65, 203–210. [Google Scholar] [CrossRef] [PubMed]
- Bullmore, E.; Sporns, O. Complex brain networks: Graph theoretical analysis of structural and functional systems. Nat. Rev. Neurosci. 2009, 10, 186–198. [Google Scholar] [CrossRef] [PubMed]
- Rubinov, M.; Sporns, O. Complex network measures of brain connectivity: Uses and interpretations. NeuroImage 2010, 52, 1059–1069. [Google Scholar] [CrossRef] [PubMed]
- Watts, D.J.; Strogatz, S.H. Collective dynamics of ‘small-world’ networks. Nature 1998, 393, 440–442. [Google Scholar] [CrossRef] [PubMed]
- Sporns, O. The Non-Random Brain: Efficiency, Economy, and Complex Dynamics. Front. Comput. Neurosci. 2011, 5, 5. [Google Scholar] [CrossRef] [PubMed]
- Schwarz, G. Estimating the dimension of a model. Ann. Stat. 1978, 6, 461–464. [Google Scholar] [CrossRef]
Disclaimer/Publisher’s Note: The statements, opinions and data contained in all publications are solely those of the individual author(s) and contributor(s) and not of MDPI and/or the editor(s). MDPI and/or the editor(s) disclaim responsibility for any injury to people or property resulting from any ideas, methods, instructions or products referred to in the content. |
© 2025 by the authors. Licensee MDPI, Basel, Switzerland. This article is an open access article distributed under the terms and conditions of the Creative Commons Attribution (CC BY) license (https://creativecommons.org/licenses/by/4.0/).