Abstract
In applied battery research, use-case-driven prediction is becoming increasingly important, particularly for predicting real-life load profiles. This study proposes techniques to forecast lifetime load profiles for traction batteries, comparing urban- and highway-dominated vehicular use cases. Both charging and discharging scenarios are analyzed. We examine the uncertainty in these profiles and conduct a sensitivity analysis to understand the relationship between load profiles and user behavior. In this study, we introduce a novel methodology that maps behavioral and environmental parameters to battery load clusters, enabling us to identify high-risk aging scenarios. Based on parameter studies, we perform load profile clustering to identify critical use case groups and observe key parameter interactions. We present a case study of an idealized driver under Hungarian environmental conditions to predict outlier battery usage in fleets. This novel approach enables more robust predictions of aging and performance degradation for automotive traction batteries across different user clusters.
1. Introduction
The aim of this research is to develop a method to determine load profiles for automotive traction batteries, considering different vehicle-level use cases. This work focuses on battery electric vehicles (BEVs).
The battery electric vehicle industry is currently facing challenges due to reduced customer demand, primarily driven by unsatisfactory customer experiences in various use cases. For instance, car rental companies are experiencing low residual value and high maintenance costs, primarily due to the aging of traction battery systems [1]. This research aims to provide a method to decompose the vehicle lifetime into different use cases and to compose a traction battery mission profile to predict and validate the battery lifetime. Our goal is to extend conventional calendar- and cycle-based models by incorporating user-specific load patterns.
1.1. Vehicle Power System
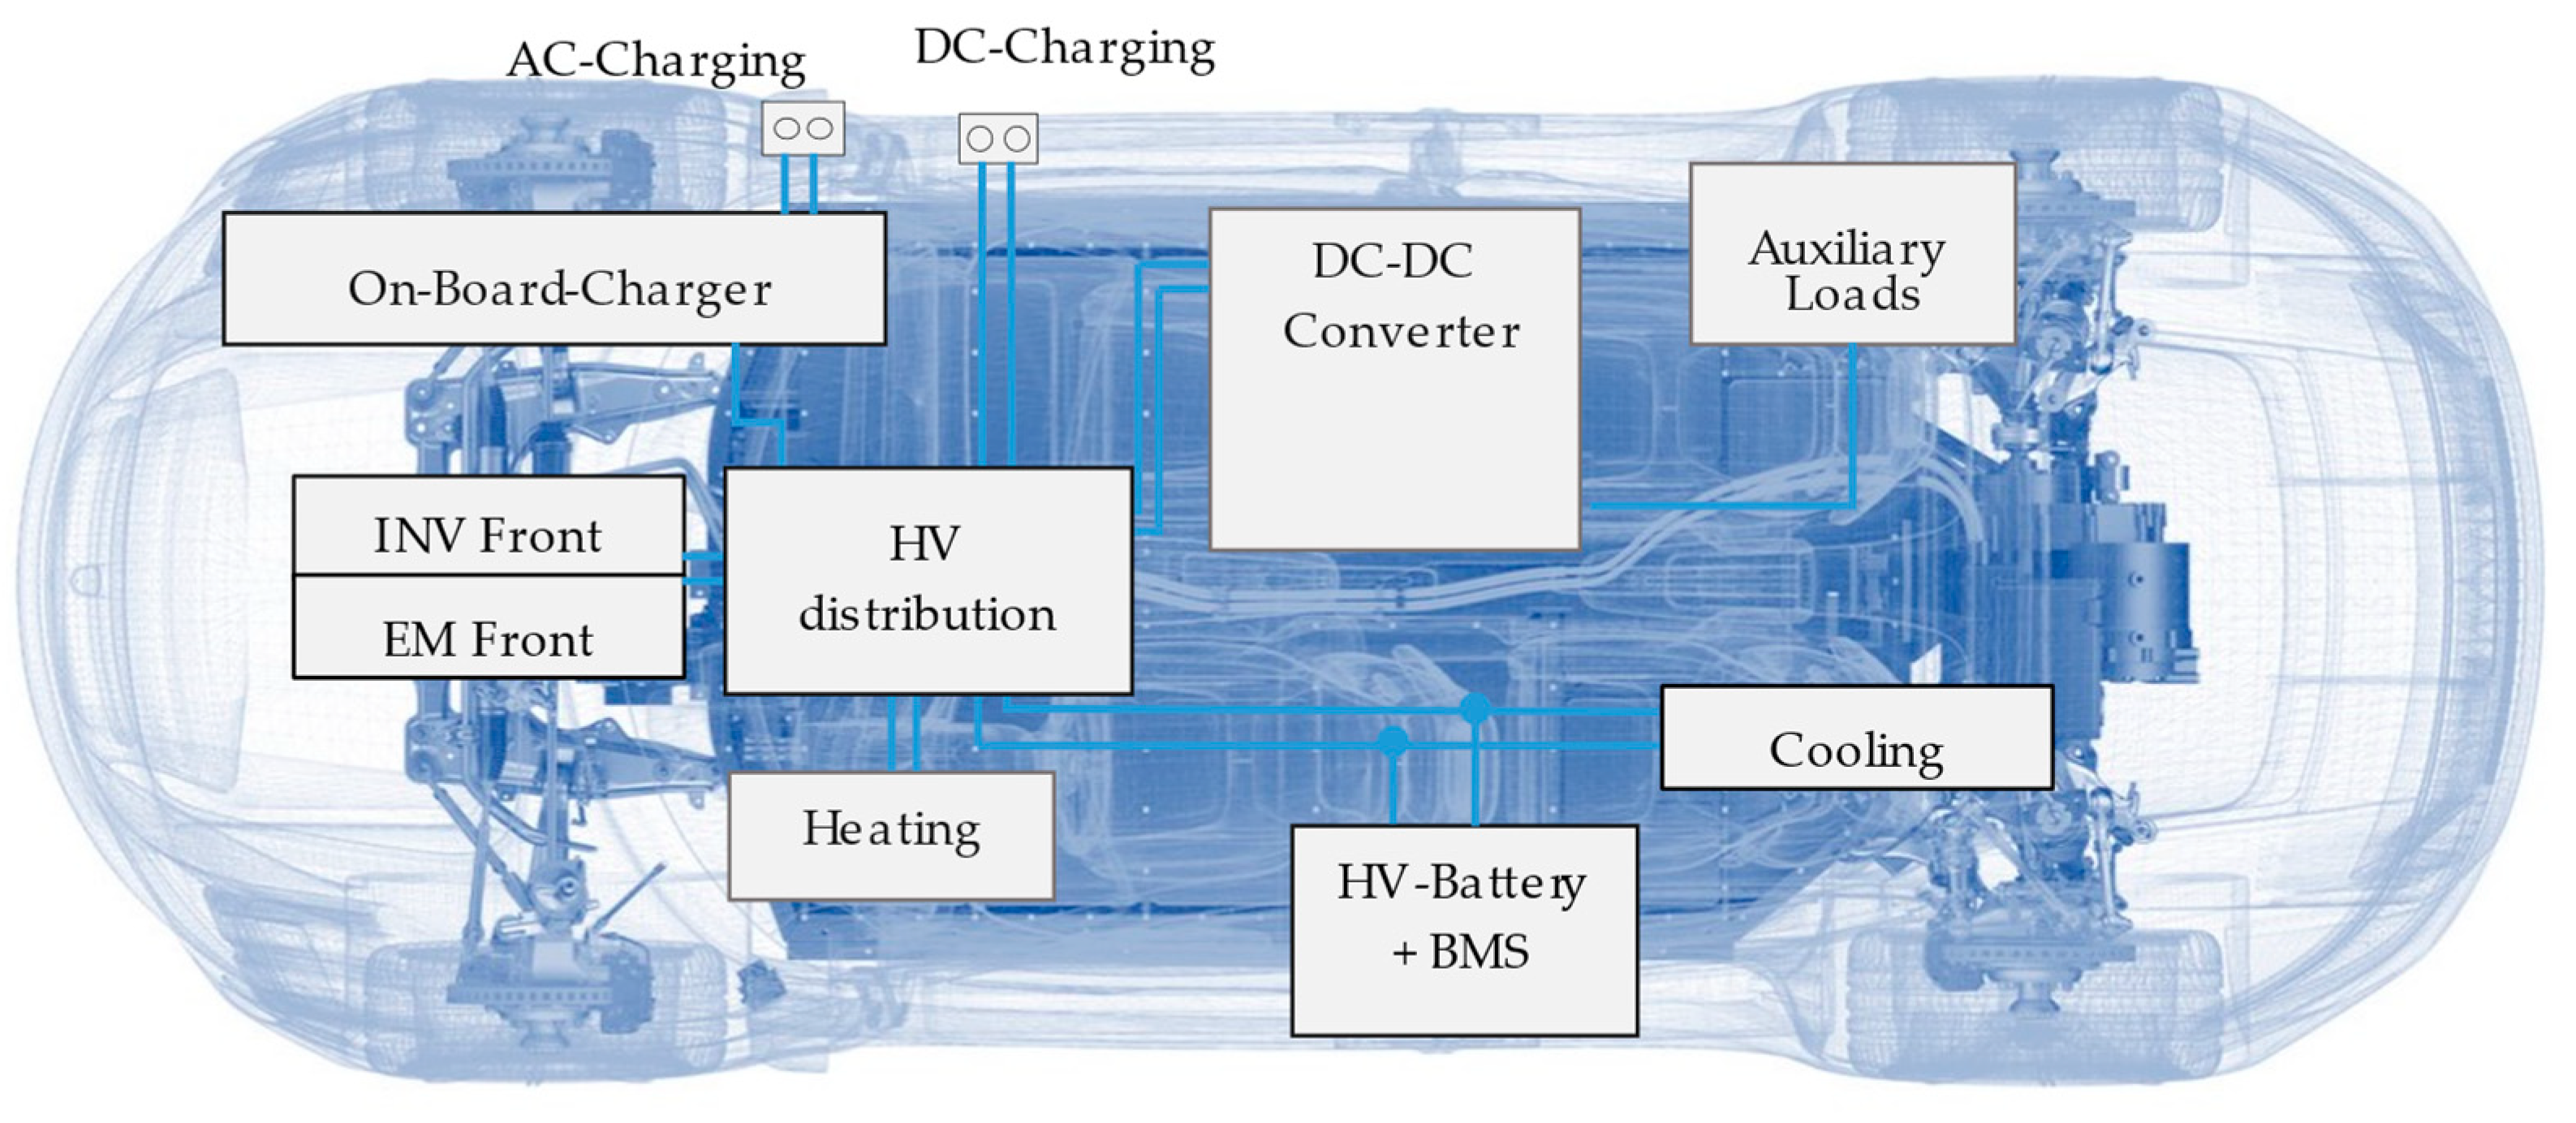
Figure 1 shows the main subsystems of the BEV connected to the traction battery. As highlighted, the vehicle has a front-axle electric drive unit and is capable of both DC and AC charging [1]. This section discusses the main power consumption characteristics of the subsystems highlighted in Figure 1.
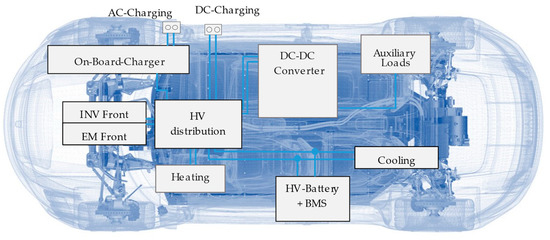
Figure 1.
The analyzed subsystems connected to the HV battery of a BEV vehicle.
1.1.1. Traction
The main purpose of the traction subsystem is to provide torque to fulfill the driver’s torque demand. This subsystem contains traction inverters and electric motors. In this work, we assume a vehicle with one rear inverter and motor.
1.1.2. Charging
The primary goal of the charging subsystem is to enable the charging of the HV battery. This subsystem contains the power electronics interfacing with the off-board charging infrastructure.
1.1.3. Thermal Subsystem
The thermal subsystem contains all functionalities to fulfill the heating and cooling demands of the vehicle. It can be decomposed into traction battery heating and cooling and cabin heating and cooling. In this work, we assume all these components are directly fed by HV. The thermal subsystem is the most temperature sensitive subsystem of the vehicle’s energy consumption. Detailed characteristics of the thermal subsystem and the thermal demands of the vehicle can be found in [2,3].
1.1.4. Auxiliary Subsystem
The auxiliary loads are fed from the low-voltage (LV) system, typically 12 V, of the vehicle. This subsystem contains all the electronic control units (ECUs) of the vehicle and an LV energy-storage element. In this work, we assume a HV to LV DC/DC converter interfaces between the traction battery and the loads.
1.2. Vehicle Lifecycle
This research considers three main states for the vehicle and identify sub-use cases for each state. We assume that the vehicle can be used in ambient temperatures ranging from −30 °C to +50 °C.
1.2.1. Sleep State
During the sleep state, we consider that none of the vehicle loads interfacing directly with the traction battery are active. Power consumption from the traction battery occurs only during periodic or event-based wake-ups. In the use case section, we provide a method to assess the load profiles during periodic wake-ups or constant current drain from the traction battery.
1.2.2. Charging
During charging, it is assumed that the traction system is inactive while all other vehicle loads are active. For the most common charging strategy, we assess a constant current–constant voltage (CC-CV) charging curve with state-of-health (SoH) and temperature-dependent limitations. We consider three main use cases in this state: home charging (AC, with a maximum of 11 kW), public charging (AC and DC), and fast charging.
1.2.3. Discharging (Driving)
During driving, we assume that all subsystems of the vehicle, except the charging subsystem, are active. The driving state has the most significant impact on customer experience, with various individual factors influencing load profiles. For example, driver behavior can be identified as battery savers and more aggressive drivers.
2. Methods
This section covers the methods to define and set up use case-based load profiles for the previously defined vehicle states and usages.
2.1. Charging
Standard-Driven Charging Profiles
Charging use cases depend on customer behavior, influenced by multiple factors affecting how the customer charges the car. Vehicle owners aim for smooth and fast charging, while the availability of charging infrastructure determines how the customer can utilize it. This work considers that during charging events, the control strategy follows a constant current–constant voltage (CC-CV) profile, determined by the actual maximum battery charging current. We consider a normal use case with a minimum state of charge (SoC) of 20%. To set the load profiles, we analyzed customer behavior, including the frequency of specific charging situations and typical energy demand.
2.1.1. Home Charging (3.5 and 11 kW)
Home charging utilizes the electrical infrastructure available in private locations, typically providing charging power between 3.5 kW and 11 kW. For individual car owners, particularly commuters with a daily mileage demand below 50 km, we assume that the car can stay plugged in overnight. A typical home charging mission profile can be constructed as once a week, charging from 20% to 100% SoC. This equates to 52 home-charging events annually, weighted by the climatic conditions of the market, considering the typical ambient temperature.
2.1.2. Public Charging (22 kW AC)
Public charging occurs at publicly available AC and DC infrastructures. These charging events typically happen at workplaces, fulfilling the 20% to 100% SoC demand, or at public spaces such as shopping centers, where the end of the charging event depends on the customer’s need for the car rather than the target SoC.
2.1.3. Fast Charging (150 kW DC)
Fast charging utilizes available infrastructure at larger charging hubs, enabling the vehicle to be charged within a short time interval, typically less than 30 min. Fast charging scenarios and their effects on aging are the focus of numerous research works. Analyzing the mission profile of fast charging reveals that most drivers, such as commuters or city users, rarely use fast charging due to its cost and the availability of home charging. However, for drivers utilizing the vehicle for long-range drives, such as those driving 50,000 km annually on highways, the number of fast-charging events can reach up to 100 per year.
2.2. Discharging
The discharging use case represents the vehicle’s behavior during driving, where most of the load is determined by driving habits. To model driver behavior, the worldwide harmonized light vehicles test procedure (WLTP) defines a driving profile that represents a normalized drive. In addition to the current used for driving, we modeled a continuous load on the auxiliaries and a temperature-dependent climatic load. The auxiliary load is assumed to be 2 kW, resulting in a 5 A load for a 400 V vehicle [4].
2.2.1. Standard-Driven Load Profiles-WLTP
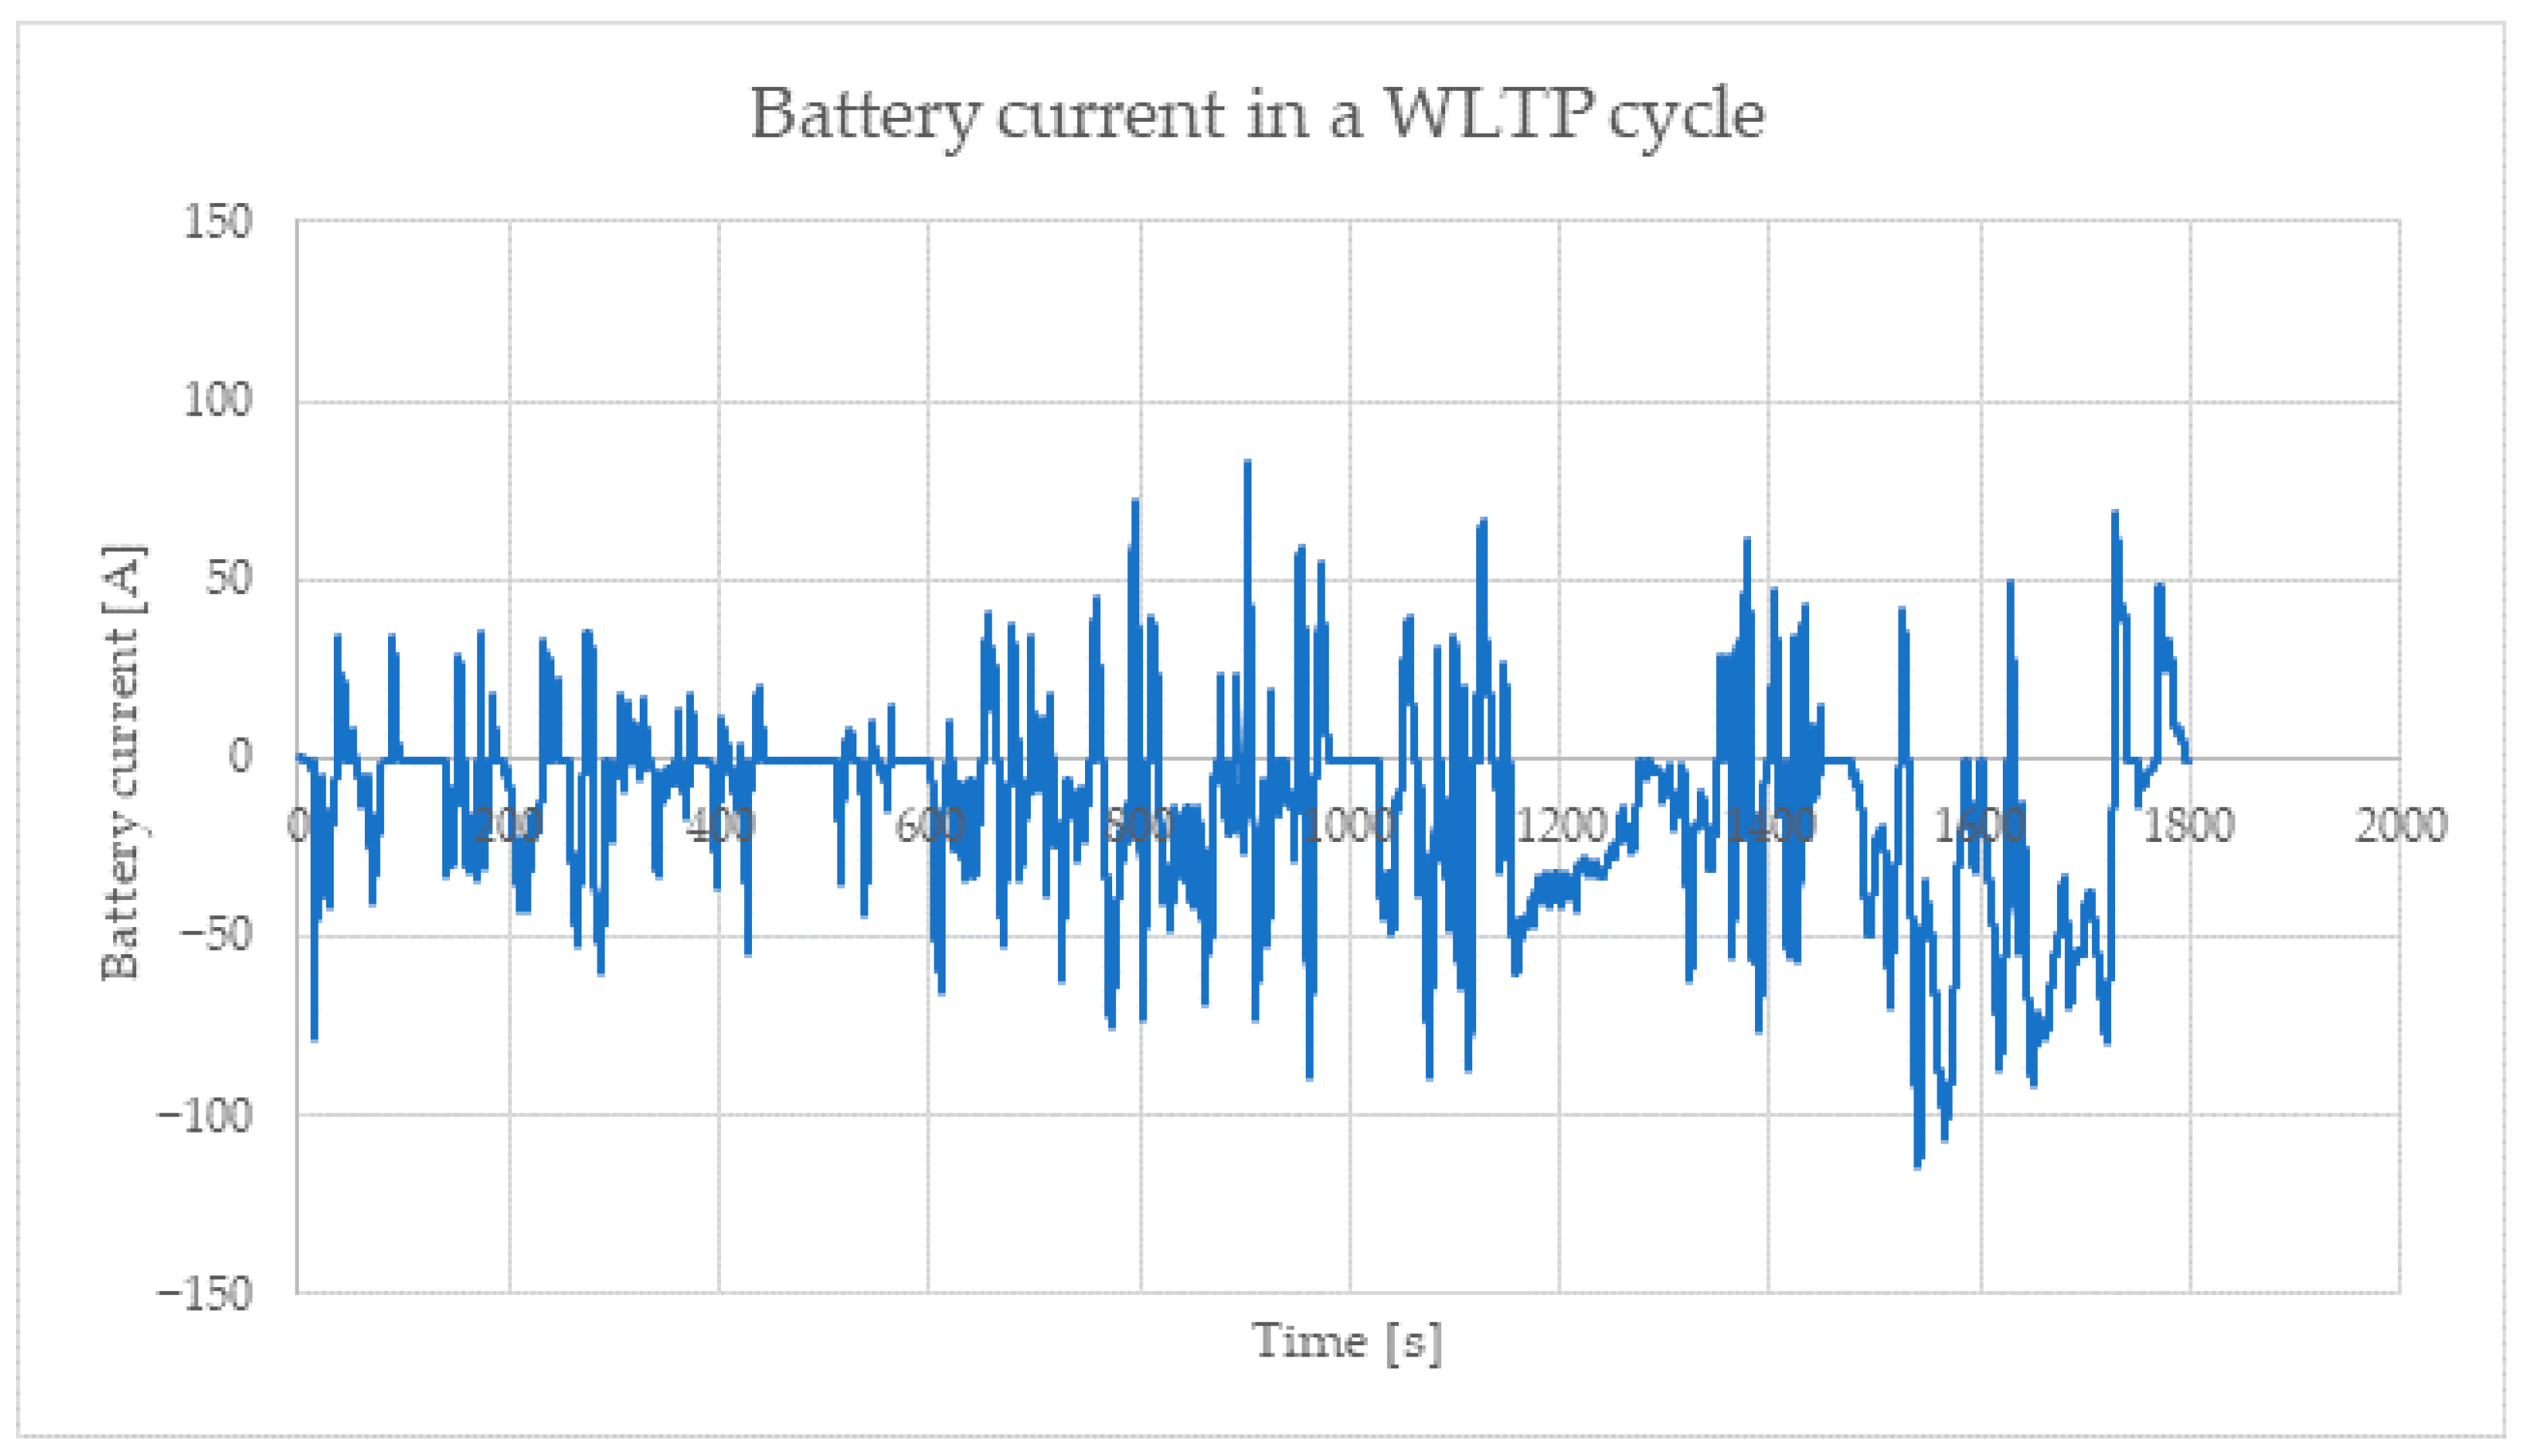
In this study, we measured the traction current demand of a high-performance electric vehicle while driving on a WLTP cycle, as represented in Figure 2. A direct approach to creating a mission profile for an urban or semi-urban driver for the traction battery is to extend the WLTP current profile to the entire lifetime of the battery [3,5,6]. Assuming an annual driving distance of 20,000 km, a user would complete approximately 860 full WLTP cycles per year, providing a useful reference point for estimating the number of standard-discharge events experienced by the battery.
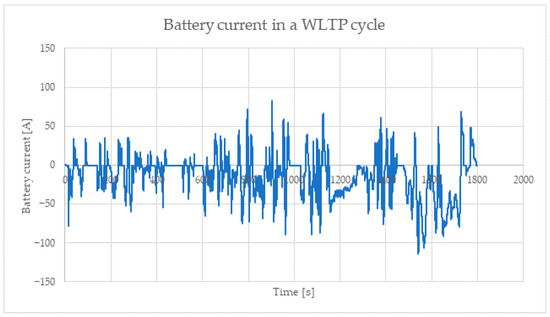
Figure 2.
The current consumption of the traction subsystem during a WLTP driving scenario. The data is measured on a real vehicle.
2.2.2. Real-Life Edge-Case-Driven Use Cases
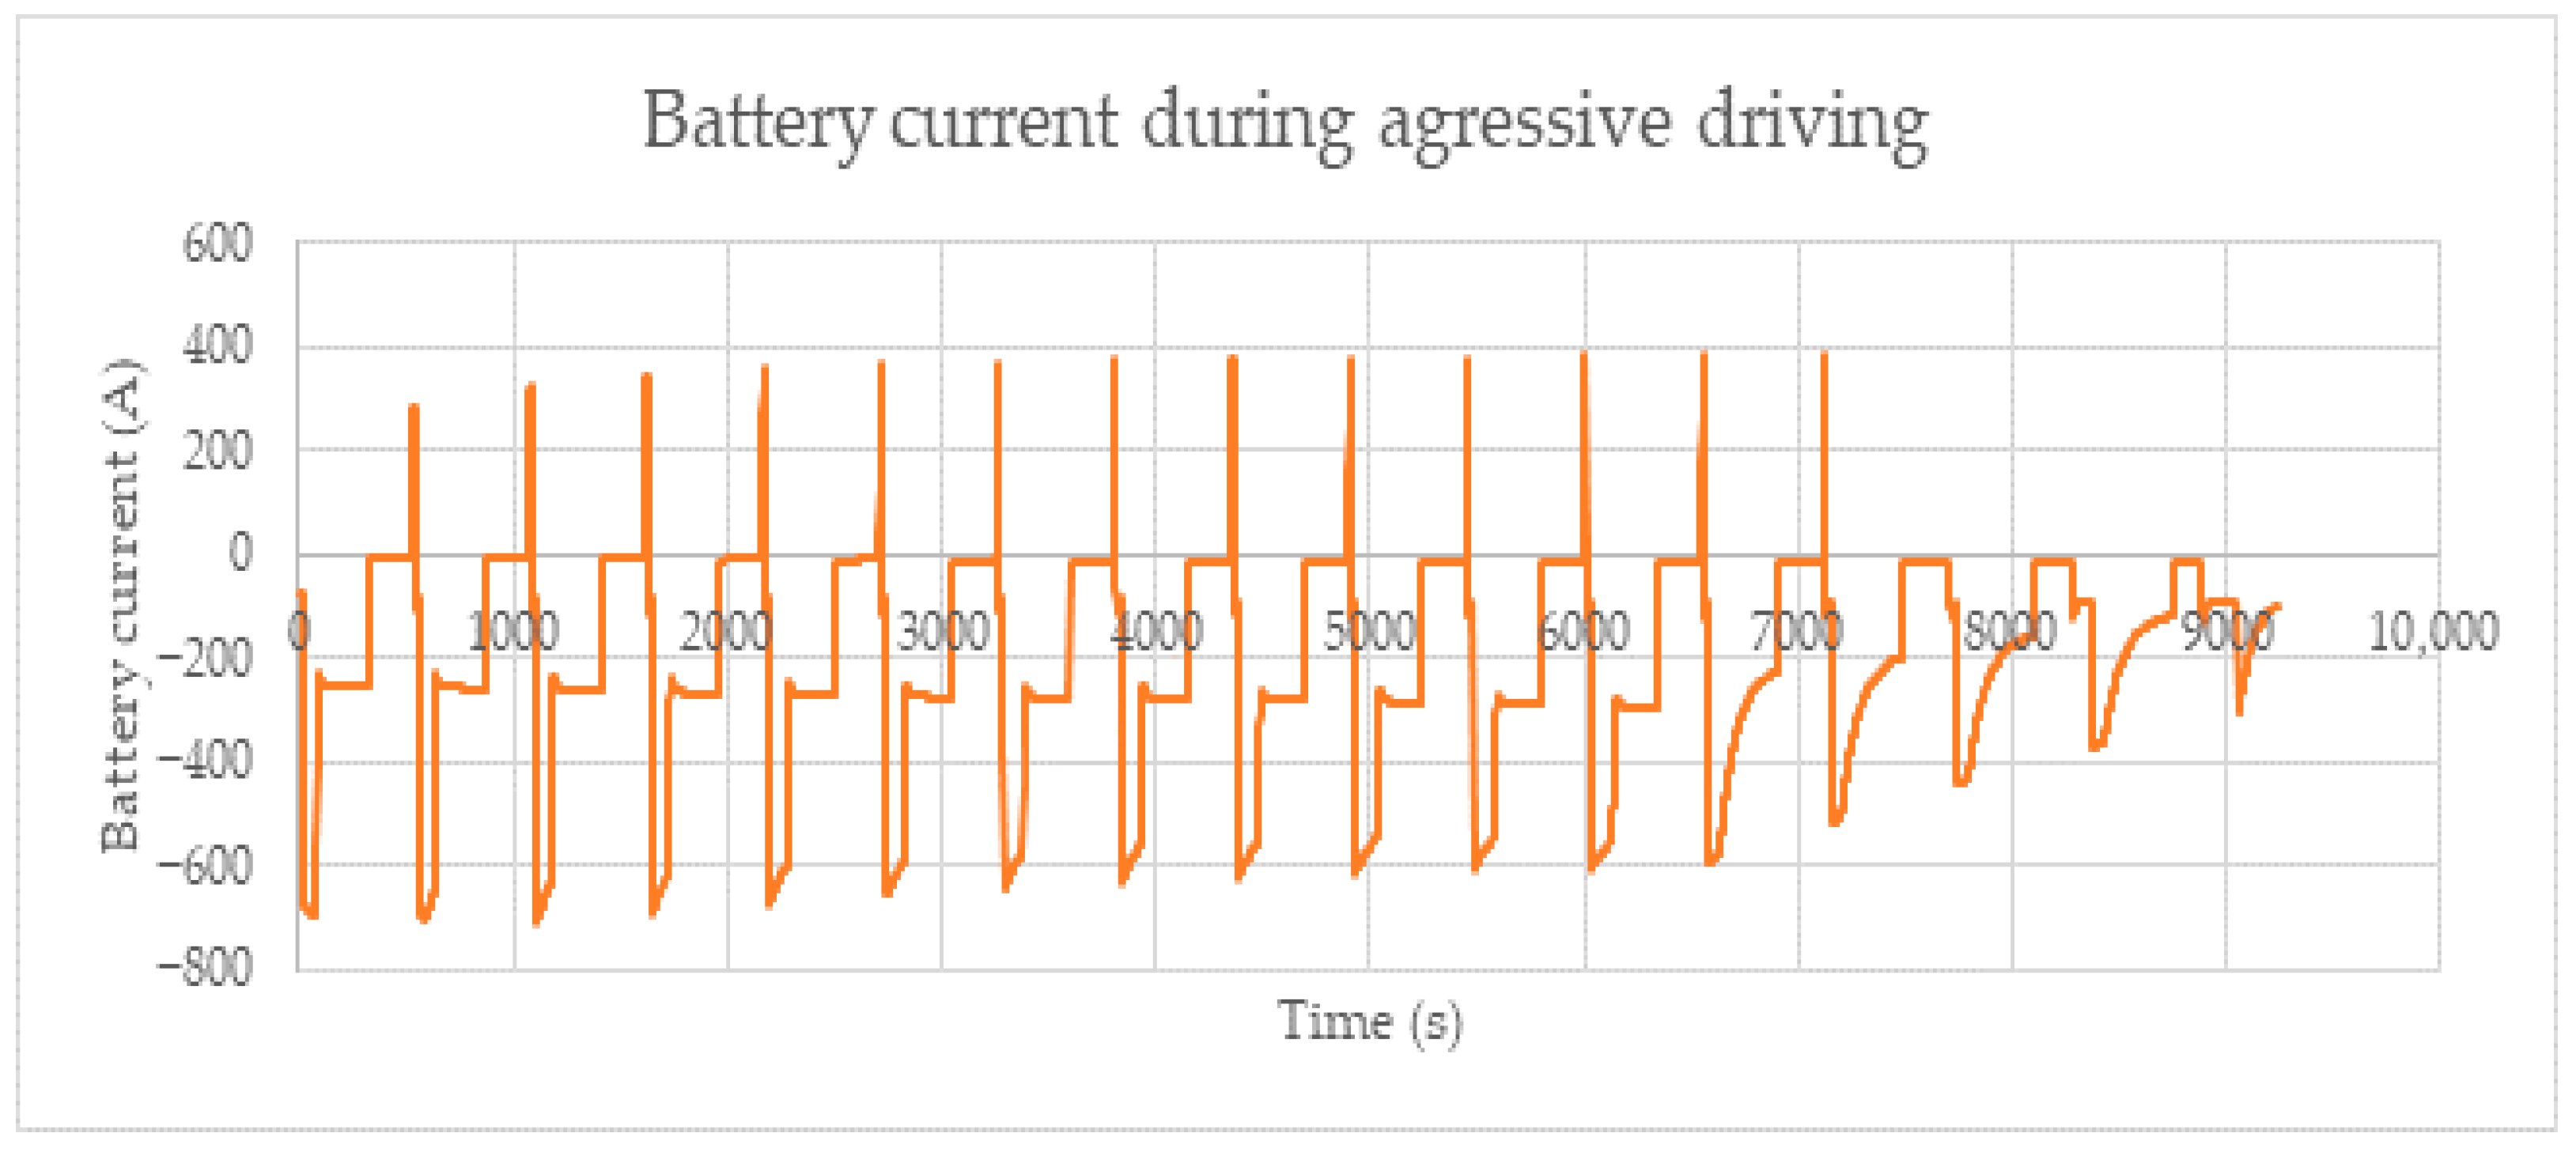
We measured an aggressive driving profile on the motorway, consisting of a series of highly dynamic acceleration and braking events [7,8]. Figure 3 shows the resulting current profile, with the same 80% starting SoC as the WLTP measurements. Comparing the current values with those from the WLTP measurements in Figure 2 reveals that aggressive driving profiles can demand significantly higher currents from the battery [5,9].
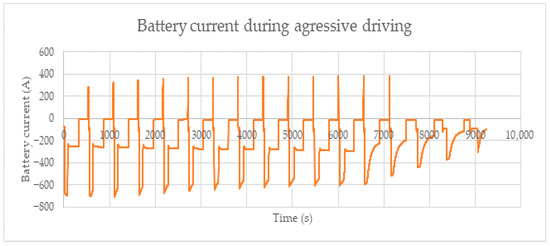
Figure 3.
The current consumption of the traction subsystem during a highway scenario composed of dynamic acceleration and braking events. The data is measured on a real vehicle.
2.2.3. Load Profile of the Thermal Subsystem
While driving, the thermal subsystem is required to cool main components, such as electric machines and traction batteries, and to provide the driver-requested cabin temperature. The thermal subsystem may increase annual energy consumption by 12–15%. This research analyzed two edge cases, the hot climate and the cold winter cases. Both increase 2 kW constant power consumption to the overall electric load [10]. When the ambient temperature does not lead to a constant thermal demand, the thermal subsystem adds 1 kW electric load to the vehicle. In our study, due to the continental climate, we considered a six-month excessive and six-month mild climate subsystem usage for the examined vehicles.
2.2.4. Sleep-State Load Profile
In the sleep state, this research assumed a constant power consumption of the vehicle, and periodic wake-ups were not considered in this analysis. Based on publicly available data and a verification measurement on a Tesla Model 3, Tesla vehicles appear to have a 1% SoC loss per day [11] which results in a constant 2mA current draw from the traction battery.
2.3. Comparison with Existing Load Modeling Approaches
Most existing battery mission profile studies rely on standard driving cycles or generalized usage assumptions. In contrast, our method integrates behavioral and environmental variability using a clustering approach, which enables scenario-based and probabilistic lifetime estimation. This adds a level of personalization and predictive power not addressed in conventional models [3,12,13,14].
3. Results and Discussion
The comparison between home charging and fast charging, as well as between the WLTP profile and the aggressive driver profile, illustrates that the mission profile for the traction battery can encompass a combination of very different profiles. Previous research has established that fast charging accelerates battery aging [14,15]. The overall mission profile can be expressed in terms of power or current, as the comprehensive mission profile includes the battery’s entire lifecycle’s energy requirements, including safe-state power needs and current demands, which influence all other parameters.
The construction of a realistic mission profile for the traction battery which accurately reflects real-life power consumption can be formulated as follows:
where P(t) is the overall mission profile, Pt is the power demand of the traction subsystem, P_ch is the power supplied by the charging system, P_c is the power consumed by the thermal subsystem, and P_a is the power requirement of the auxiliaries.
P(t) = P_t (t) + P_ch (t) + P_c (t) + P_a (t)
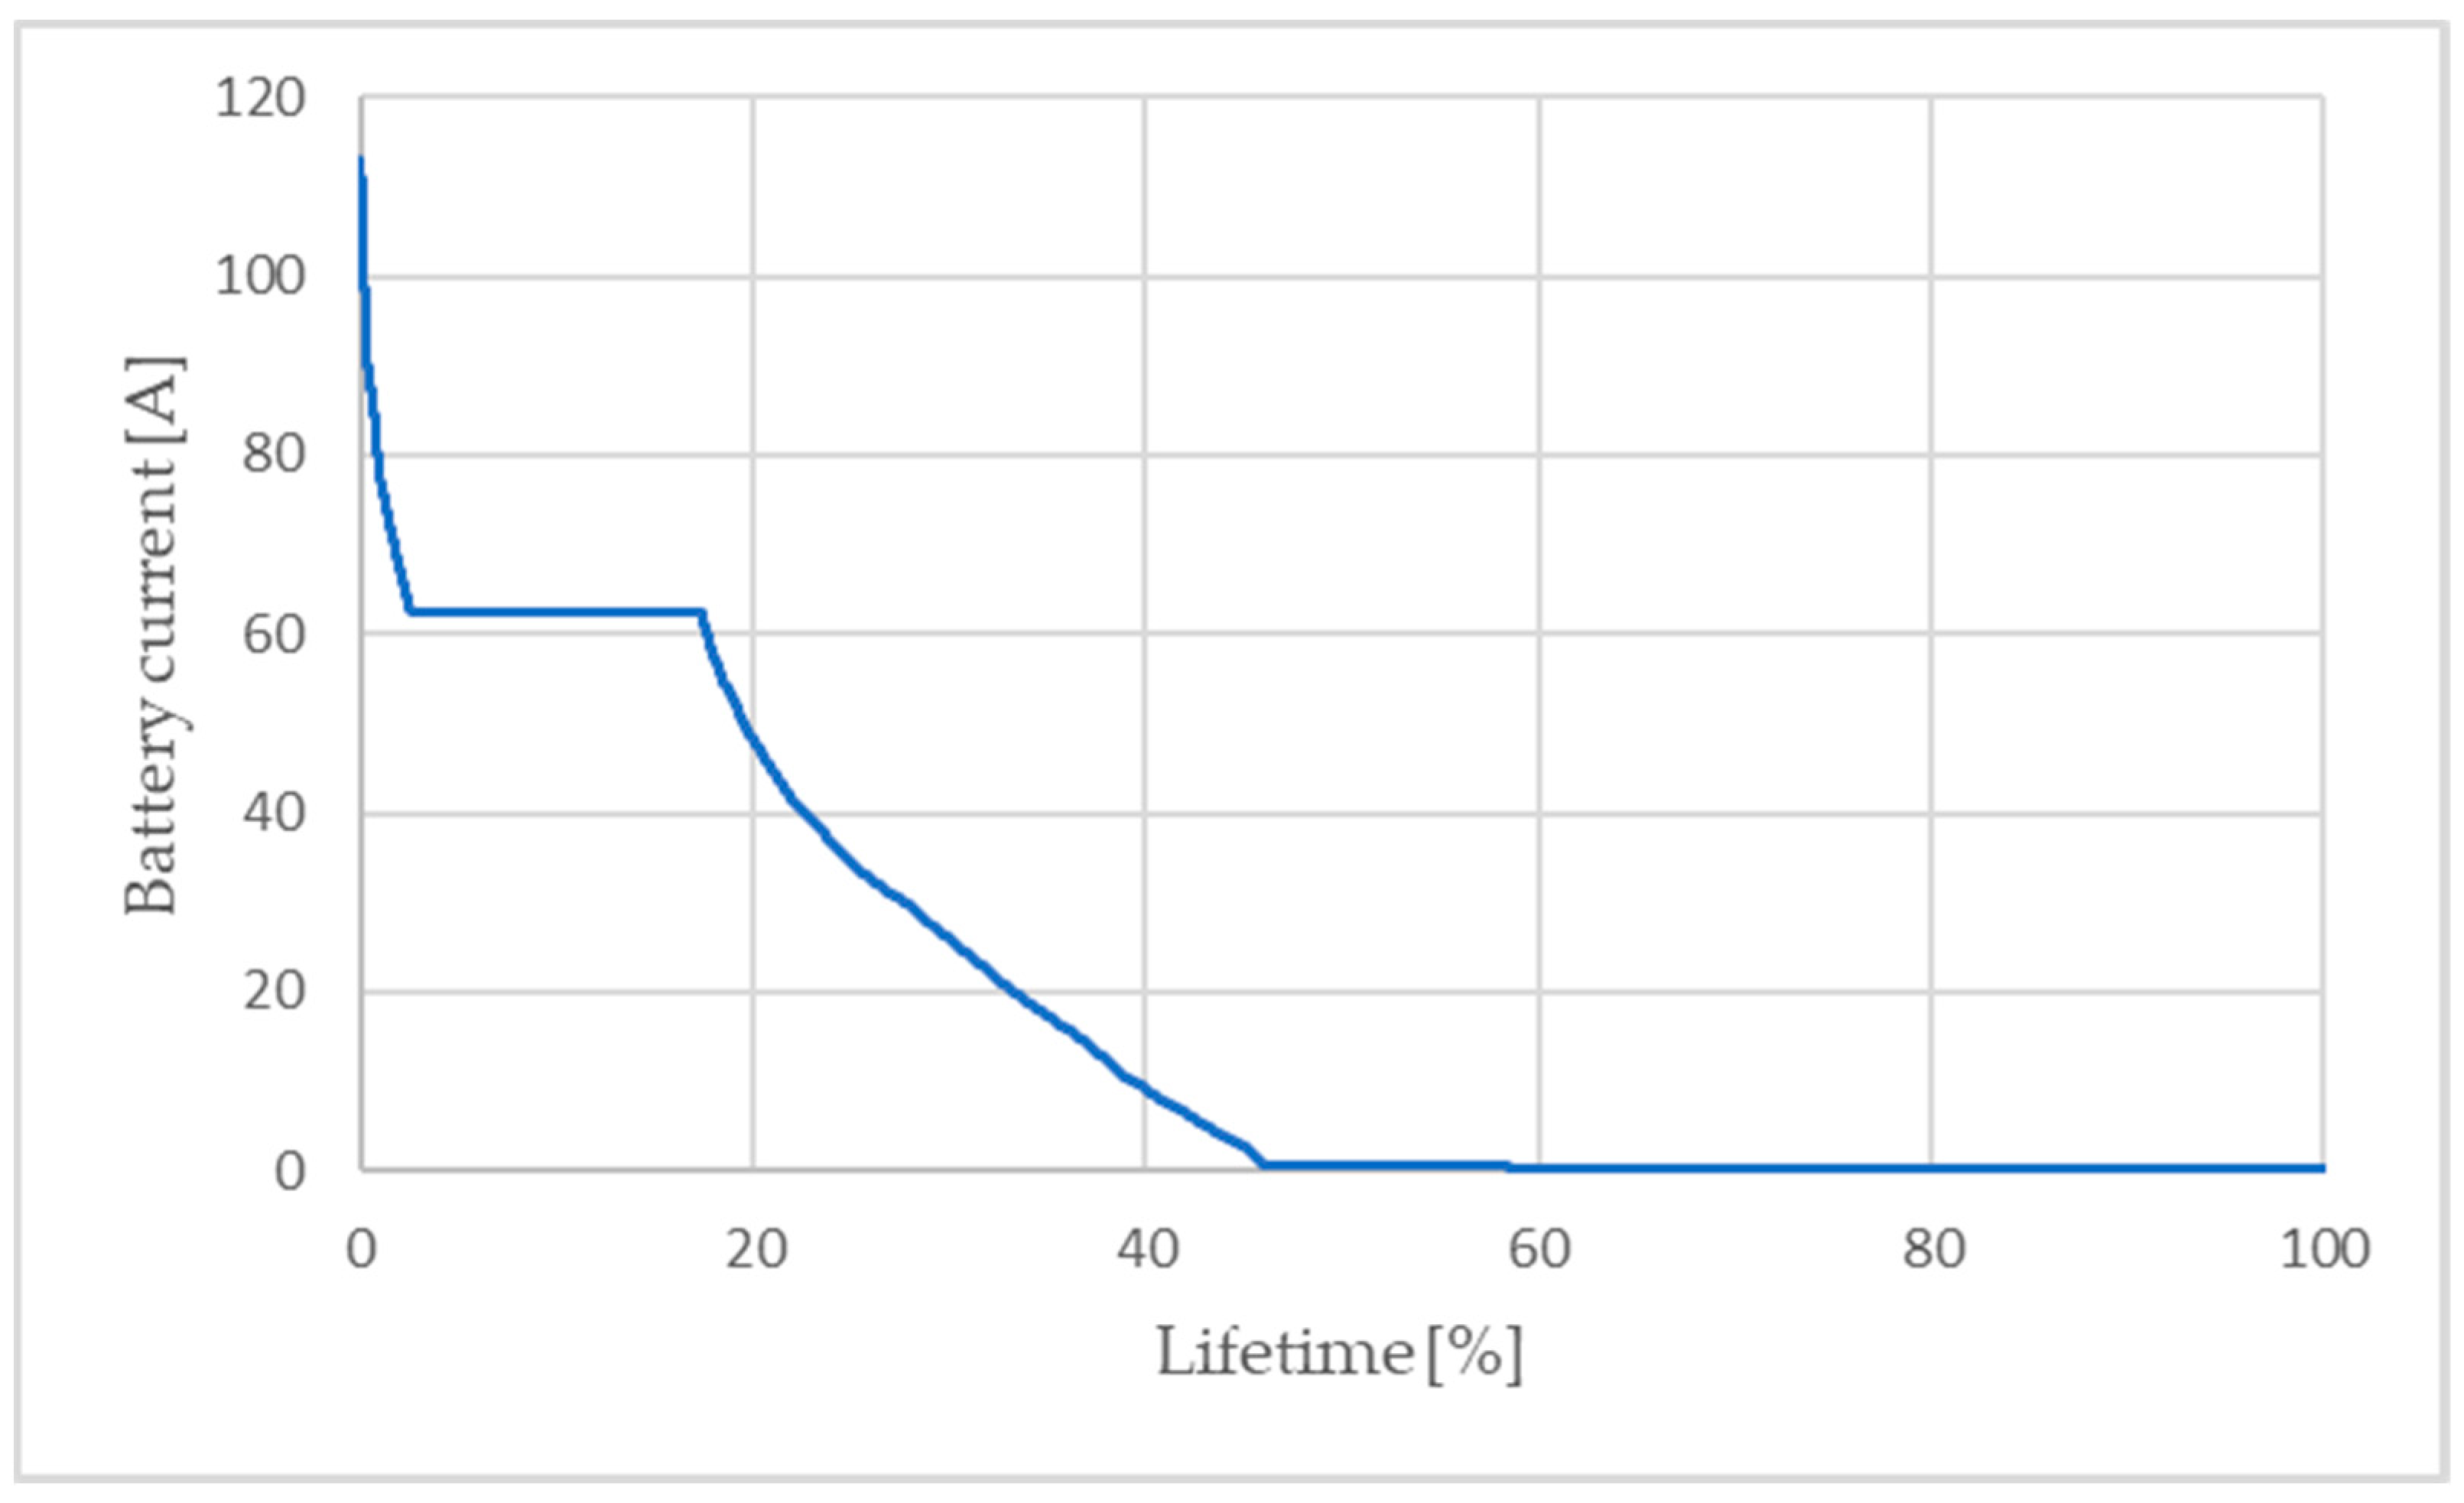
In Figure 4 we provide a measurement-based estimation of the lifetime current demand of a vehicle, considering a balanced mixture of home, public, and fast charging. As result we can observe is that the vehicle consumes its peak current only in a very small percentage of its lifetime. The lifecycle current profile presented in Figure 4 was synthesized by linearly superimposing measured current profiles from standardized driving cycles (WLTP), aggressive highway scenarios, and typical charging events, including home, public, and fast charging. The weighting of each segment was based on representative annual vehicle usage data (15,000–20,000 km/year), charging frequencies derived from user behavior studies, and seasonal thermal subsystem activity, assuming 50% of operation in high thermal demand conditions; temporal scaling and statistical averaging were applied to reflect proportional lifetime energy consumption across use cases. This motivates closer investigation of typical (non-edge case) operational power demand. To quantify the usage distribution, we calculated that fast-charging events (e.g., 65 A plateau) represent approximately 5–8% of the vehicle’s lifetime operation time, while low-load or idle states account for over 70%. These proportions underline the need for edge-case-specific stress testing, despite their relative rarity.
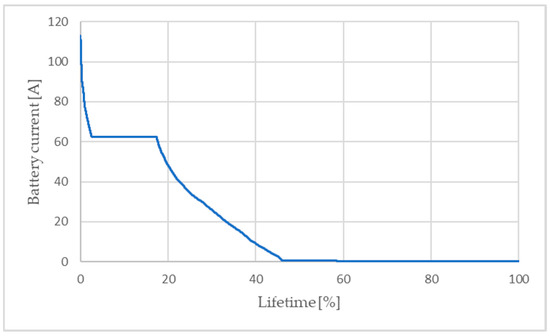
Figure 4.
Estimated absolute current demand of the traction battery over the vehicle’s lifetime, constructed from representative use case weighting. Periods of near-zero current indicate low-load or sleep-state phases, illustrating the predominance of low-stress and charging operation in the overall BEV usage profile.
The extended periods where the current draw appears to be near 0 A in Figure 4 represent vehicle idle times or low-consumption phases, including sleep states and idle, and lower power-mode conditions with minimal subsystem activation. This highlights the dominance of low-stress operational phases in the typical BEV lifecycle, which substantially reduce cumulative aging effects compared to high-power transient events. Notably, the plateau observed in the first 20% of the lifetime profile at 65 A reflects the predominance of constant current charging phases within the CC-CV charging strategy, particularly during fast-charging events.
For a private customer primarily using the vehicle for city commuting and occasional long drives, the profiles will mostly involve home charging and WLTP-like driving profiles, resulting in minimal state-of-health (SoH) loss [16,17]. However, for customers with use cases significantly different from this combination, the mission profile will involve more frequent use of the battery, up to its performance limits. As shown in Figure 2, during fast charging, current limitations are active more than 50% of the time, pushing the battery to its performance limits. Similarly, during aggressive braking, the regenerative current can reach levels that correspond to the battery’s limits [18].
To synthesize a lifetime mission profile of a traction battery, we propose to linearly decompose the vehicle to its individual subsystems. By the addition of the individual subsystems and independent analysis of the subsystems, the inaccuracy of the final mission profile can be minimized. We suggest incorporating probabilistic modelling as well into power consumption data. Such a stochastic power distribution can help identify driver behavior patterns that may accelerate battery aging.
As a case study, we model Hungarian environmental conditions characterized by a continental climate with high cooling demand in the summer and significant heating demand in the winter. Accordingly, we model an additional 2 kW thermal load during 50% of the drive cycles to reflect seasonal extremes. Based on publicly available data, the average vehicle usage in Hungary ranges from 15,000 to 20,000 km per year with an average speed of 60 km/h, which translates to an annual discharging time between 250 and 330 h. Assuming an average energy consumption of 15 kWh/100 km and an average charging power of 3.5 kW, the corresponding annual charging time is estimated to be 650–850 h; these consumption assumptions are based on [4]. Due to increased thermal demand in extreme climate conditions, total vehicle energy consumption—and thus charging frequency—tends to be higher in edge cases. Hungarian conditions were selected as representative of a typical Central European continental climate, providing relevance for broader regional applications. The ‘idealized driver’ model serves as a reproducible simplification of real-world behavior, enabling consistent scenario modeling; future work will incorporate population-level behavioral diversity to enhance prediction accuracy. As a key result, this case study supports the necessity of use-case-based battery lifetime prediction, offering actionable insights for estimating the total cost of ownership, particularly for fleet operators and non-private users.
4. Conclusions
In this work, we provided a method to decompose the vehicle into subsystems, analyze the load profiles and demands of these subsystems individually, and then combine them into an overall traction battery mission profile. The primary motivation for developing this mission profile is to enable more accurate predictions of the battery lifetime and total cost of ownership. Using these mission profiles, novel test scenarios and aging tests can be defined to reduce the risk of accelerated aging due to driver behavior or environmental parameters such as temperature. Additionally, this method allows for the implementation of real-life-based test scenarios to fine-tune state-of-the-art aging tests. Furthermore, it enables the assessment and prediction of time intervals when the battery will operate with limited performance due to high power demands, such as during fast charging and highly dynamic motorway driving.
The proposed profiling approach enables OEMs and fleet operators to forecast battery health impacts in real-world user clusters. This can support more accurate residual value estimates, optimize battery warranty strategies, and reduce unexpected service costs.
As an outlook based on these results, we plan to conduct cell-level tests to compare the aging differences between a vehicle used by a city commuter and a car rental vehicle.
Author Contributions
Conceptualization, J.G.P.; methodology, J.G.P.; software, K.E.; validation, Z.S.; formal analysis, K.E.; investigation, J.G.P.; resources, Z.S.; writing—original draft preparation, J.G.P.; writing—review and editing, K.E.; visualization, Z.S.; supervision, K.E. All authors have read and agreed to the published version of the manuscript.
Funding
This publication was created within the framework of the Széchenyi István University’s VHFO/416/2023-EM_SZERZ project entitled “Preparation of digital and self-driving environmental infrastructure developments and related research to reduce carbon emissions and environmental impact” (Green Traffic Cloud).
Institutional Review Board Statement
Not applicable.
Informed Consent Statement
Not applicable.
Data Availability Statement
The data used in this publication are not publicly available online.
Conflicts of Interest
The authors declare no conflict of interest. The funders had no role in the design of the study; in the collection, analyses, or interpretation of data; in the writing of the manuscript; or in the decision to publish the results.
References
- Rental Company Sixt Phases Out Tesla EVs From Fleet. Available online: https://insideevs.com/news/699689/tesla-sixt-ev-fleet/ (accessed on 15 July 2024).
- Pazmany, J.G.; Rechberger, K.; Baeker, B. Filter Design in the High Voltage System of Electric Vehicles with Respect to Ripple Limits. In Proceedings of the AmE 2020—Automotive Meets Electronics; 11th GMM-Symposium, Dortmund, Germany, 9–10 September 2020; VDE: Berlin, Germany, 2020. [Google Scholar]
- Liu, X.; Zhao, F.; Hao, H.; Chen, K.; Liu, Z.; Babiker, H.; Amer, A.A. From NEDC to WLTP: Effect on the Energy Consumption, NEV Credits, and Subsidies Policies of PHEV in the Chinese Market. Sustainability 2020, 12, 5747. [Google Scholar] [CrossRef]
- Sonderangebot mit Liefer-Engpass: Der VW e-Up im ADAC Test. Available online: https://www.adac.de/rund-ums-fahrzeug/autokatalog/marken-modelle/vw/vw-e-Up/ (accessed on 10 July 2024).
- Piepenbrink, H.; Flämig, H. Analysis of 160 Real-World BEV: Why the WLTP Undermines User Acceptance and How It Should Be Adjusted for Electric Vehicles. In Proceedings of the European Transport Conference (ETC 2023), Milan, Italy, 6–8 September 2023. [Google Scholar]
- Abdel-Monem, M.; Trad, K.; Omar, N.; Hegazy, O.; Van den Bossche, P.; Van Mierlo, J. Influence Analysis of Static and Dynamic Fast-Charging Current Profiles on Ageing Performance of Commercial Lithium-Ion Batteries. Energy 2017, 120, 179–191. [Google Scholar] [CrossRef]
- Singirikonda, S.; Yeddula Pedda, O. Investigation on Performance Evaluation of Electric Vehicle Batteries under Different Drive Cycles. J. Energy Storage 2023, 63, 106966. [Google Scholar] [CrossRef]
- Shelly, T.J.; Weibel, J.A.; Ziviani, D.; Groll, E.A. Comparative Analysis of Battery Electric Vehicle Thermal Management Systems under Long-Range Drive Cycles. Appl. Therm. Eng. 2021, 198, 117506. [Google Scholar] [CrossRef]
- Hu, L.; Dong, J.; Lin, Z. Modeling Charging Behavior of Battery Electric Vehicle Drivers: A Cumulative Prospect Theory Based Approach. Transp. Res. Part C Emerg. Technol. 2019, 102, 474–489. [Google Scholar] [CrossRef]
- Zhu, Q.; Huang, Y.; Lee, C.F.; Liu, P.; Zhang, J.; Wik, T. Predicting Electric Vehicle Energy Consumption from Field Data Using Machine Learning. IEEE Trans. Transp. Electr. 2025, 11, 2120–2132. [Google Scholar] [CrossRef]
- Ahmed, S.; Imtiaz, M.A.; Ahmad, B.; Ahmed, J.; Soomro, A.A.; Majeed, M.K.; Anjam, F.; Rafique, M. Next-Level System Design: Advanced and High-Performance System Architectures for the Future of Electric Vehicles. Spectrum Eng. Sci. 2025, 3, 262–282. [Google Scholar]
- Sitnik, L.J. A Method for Energy Consumption Assessment by Operation of BEVs in Different Road Conditions. J. KONES 2019, 26, 121–127. [Google Scholar] [CrossRef]
- Tewiele, S.; Driesch, P.; Weber, T.; Schramm, D. Clustering of Real BEV Driving Data with Subsequent Driving Cycle Construction Using Markov Chains. In Proceedings of the AmE 2018—Automotive Meets Electronics; 9th GMM-Symposium, Dortmund, Germany, 12–13 September 2018; VDE: Berlin, Germany, 2018. [Google Scholar]
- Schuster, S.F.; Brand, M.J.; Campestrini, C. Correlation Between Capacity and Impedance of Lithium-Ion Cells During Calendar and Cycle Life. J. Power Sources 2016, 305, 191–199. [Google Scholar] [CrossRef]
- Berzi, L.; Delogu, M.; Pierini, M. Development of Driving Cycles for Electric Vehicles in the Context of the City of Florence. Transp. Res. Part D Transp. Environ. 2016, 47, 299–322. [Google Scholar] [CrossRef]
- Das, D.; Ramesha, P.A.; Jana, M.; Basu, S. Generation of Drive Cycles for Electric Vehicles. In Proceedings of the 2021 IEEE Transportation Electrification Conference (ITEC-India), New Delhi, India, 16–18 December 2021; IEEE: Piscataway, NJ, USA, 2021. [Google Scholar]
- Martyushev, N.V.; Malozyomov, B.V.; Sorokova, S.N.; Efremenkov, E.A.; Qi, M. Mathematical Modeling the Performance of an Electric Vehicle Considering Various Driving Cycles. Mathematics 2023, 11, 2586. [Google Scholar] [CrossRef]
- Anseán, D.; González, M.; Viera, J.C.; García, V.M.; Blanco, C.; Valledor, M. Fast Charging Technique for High Power Lithium Iron Phosphate Batteries: A Cycle Life Analysis. J. Power Sources 2013, 239, 9–15. [Google Scholar] [CrossRef]
Disclaimer/Publisher’s Note: The statements, opinions and data contained in all publications are solely those of the individual author(s) and contributor(s) and not of MDPI and/or the editor(s). MDPI and/or the editor(s) disclaim responsibility for any injury to people or property resulting from any ideas, methods, instructions or products referred to in the content. |
© 2025 by the authors. Licensee MDPI, Basel, Switzerland. This article is an open access article distributed under the terms and conditions of the Creative Commons Attribution (CC BY) license (https://creativecommons.org/licenses/by/4.0/).

