Abstract
This study proposes a new micro-scale damage assessment method of laminated carbon fiber-reinforced plastics based on the thermal diffusivity measurement. This measurement was conducted by the laser-spot-periodic-heating method using lock-in thermography. Measured samples were subjected to the tension fatigue test at a relatively low load and high cycle. As a result, the thermal diffusivity showed a decreasing trend with an increase in the load cycles. It was shown that this method can detect the effect of the minute fatigue damage at a level that cannot be seen with a microscope.
1. Introduction
Carbon fiber-reinforced plastics (CFRP) are widely used for strengthening purposes in aircrafts and automobiles due to their high specific strength, corrosion resistance and fatigue tolerance. On the other hand, the prediction of their fatigue life is more difficult than metal materials such as aluminum alloys because of their composite system of carbon fiber and resin. In order to clarify the fatigue characteristics that lead to the life prediction, microscale observation is necessary to quantify the initiation and progression of the fatigue damage. The authors have established a method for evaluating the internal fiber structure of composite materials with thermal diffusivity obtained by the laser-spot-periodic-heating method using lock-in thermography [1]. By using this method, non-contact measurement can be conducted for sheet-like materials in a short period of time. It has been demonstrated that thermal diffusivity is dependent on the fatigue damage, such as transverse cracks, that can be seen with the optical microscope [2]. However, in most cases, the fatigue damage that occurs at a low load and high cycle is only detected by nanoscopic synchrotron radiation X-ray CT [3]. In such high-resolution measurement, the inspection area becomes very narrow, and it is necessary to cut out the sample in the order of millimeters. This study shows the feasibility of the thermal diffusivity measurement method to evaluate low-load, high-cycle fatigue damage. During the progression of fatigue in composite materials, interfaces are generated at the minute cracks or the delamination. The effective thermal diffusivity in the composite material is considered to decrease locally, because this interface can have thermal resistance. In this study, the effective thermal diffusivities in the thickness direction of CFRP were measured to quantify the relationship between load cycles and thermal diffusivity.
2. Materials and Methods
2.1. Materials
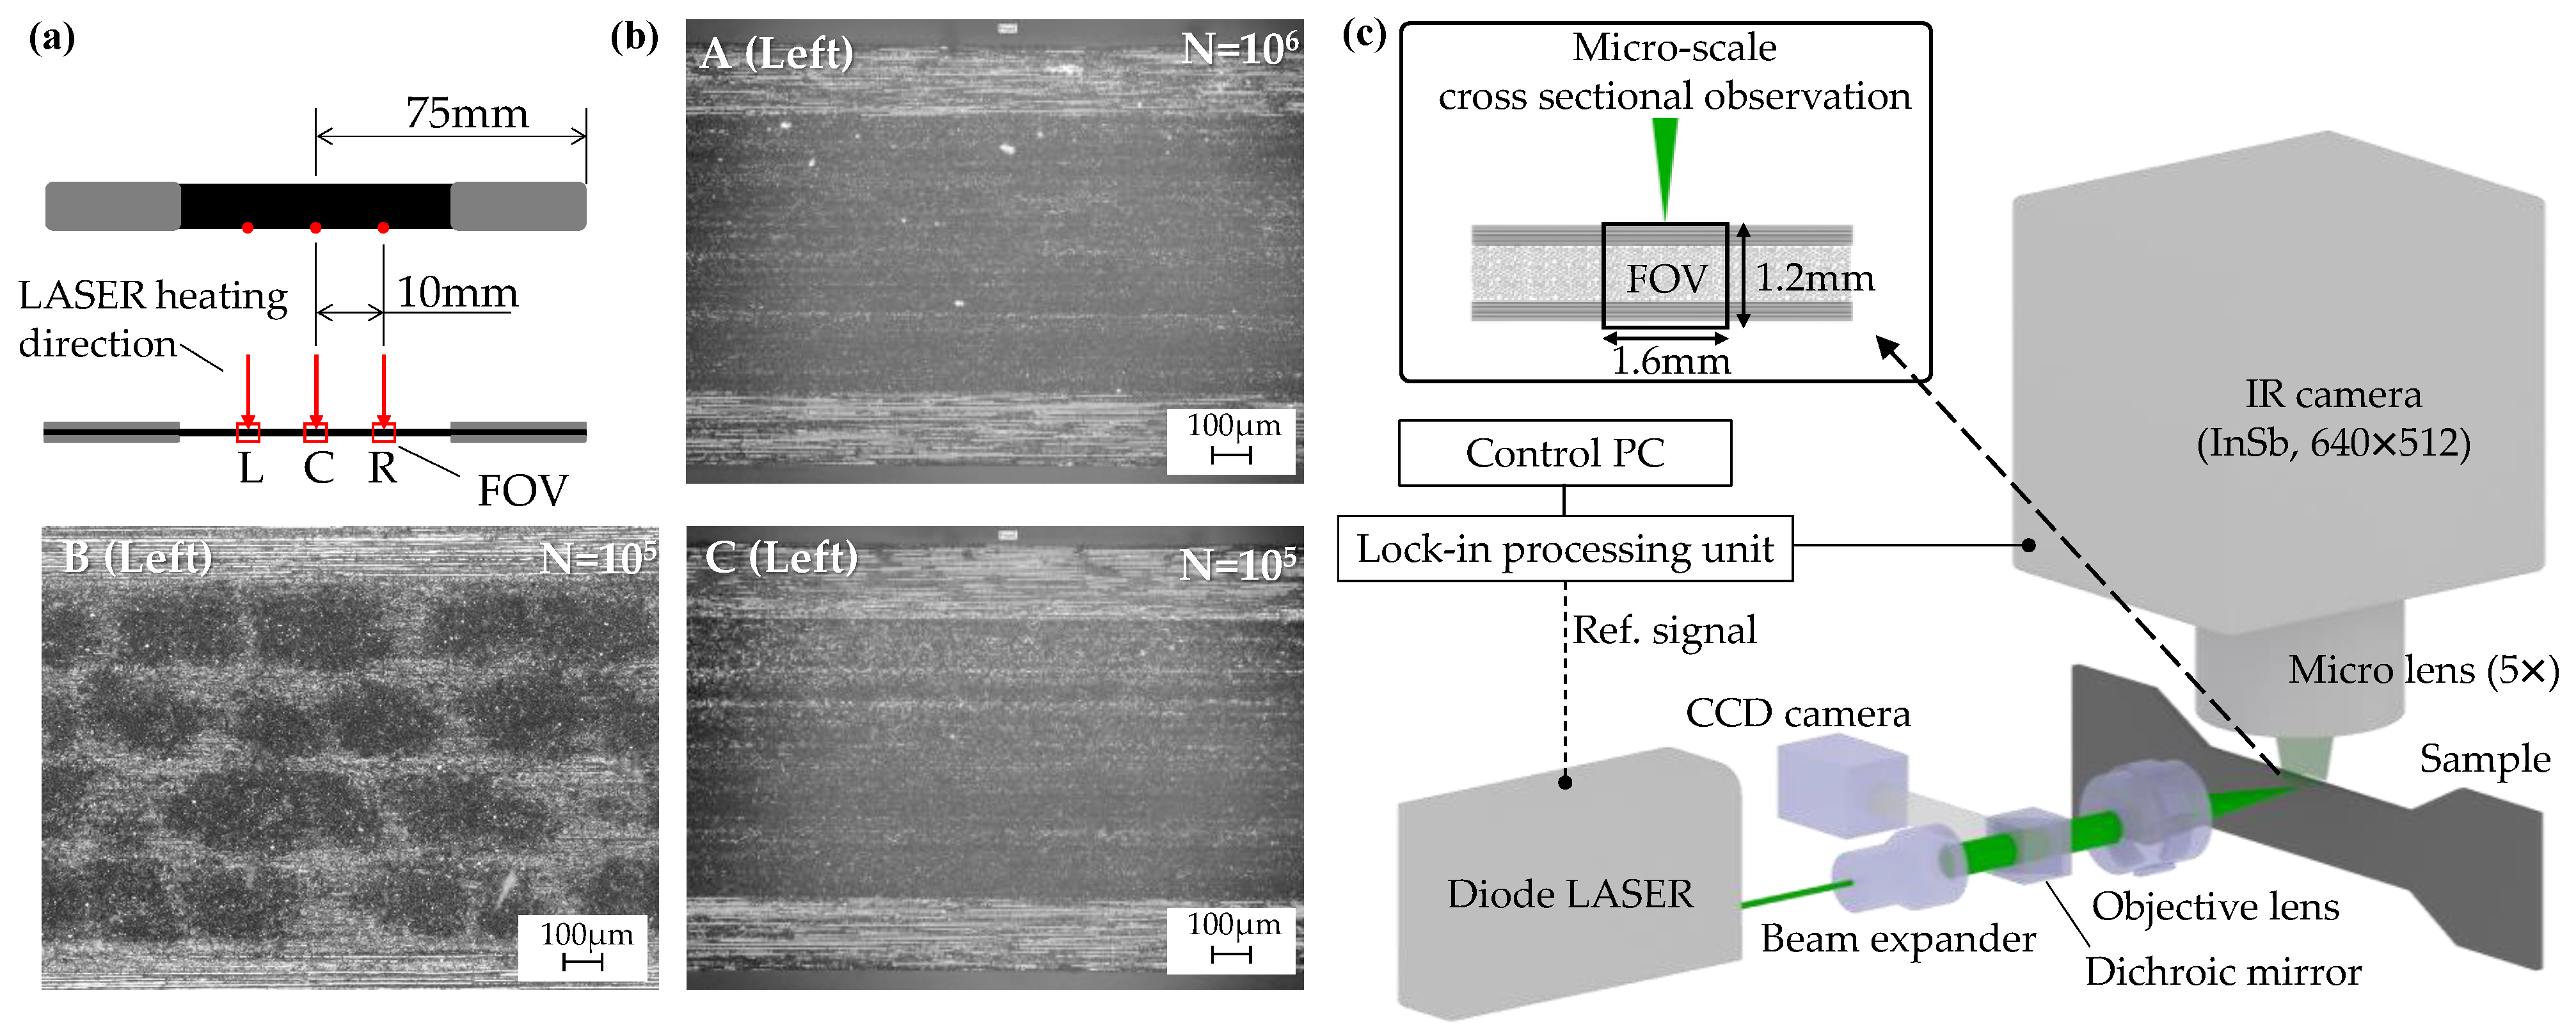
Measured CFRP samples were subjected to the tensile fatigue test with different load cycles. This sample had a laminated structure of [0/90_4/0]. Table 1 shows the sample specifications. The size of the fatigue test samples was 150 mm × 10 mm × t1.02 to t1.17 mm. There were three types of samples. Type A and type C were CFRP consisting of carbon fiber and epoxy resin, and type B was a carbon fiber-reinforced thermoplastic (CFRTP) consisting of carbon fiber and nylon 6 resin (PA6). Each type was subjected to the fatigue test at four different loading cycles: N = 0, N = 103, N = 104, N = 105 (only type A was additionally conducted on N = 106). In addition, the maximum load of each type was different. For A, it was 25% of the load that caused initial damage in the static load test, for B it was 50%, and for C it was 80%. The frequency of load cycles was 2 Hz with a sine wave. Figure 1a shows the location of the measurement position. There were three measurement positions for the sample; left, center, and right. Figure 1b shows the digital microscope image at the same position as the measurement position on the fatigue test sample. Only the image of the B sample clearly shows that the carbon fibers are aggregated akin to a bundle. It was confirmed that this had already occurred in the manufacturing process. Other than that, defects such as voids and transverse cracks were not confirmed at all measurement positions and samples. It can be said that it is a fatigue test piece that simulates the fatigue state at a low load and high cycle.

Table 1.
Sample configurations.
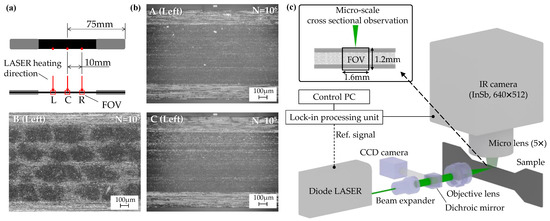
Figure 1.
(a) Measurement locations in fatigue test sample; (b) cross-sectional images of measurement location obtained by optical digital microscope; (c) experimental apparatus.
2.2. Methods
In this method, the surface of the material was periodically heated by the point heating source formed by the diode laser and objective lens, and the thermal diffusivity in the out-of-plane direction was measured from the periodic temperature response generated on the side surface of the sample. Figure 1c shows the measurement apparatus. Here, when there is a periodic heat source of on the surface of the continuous medium, the temperature response at a distance is expressed by [1].
where is the density, is the specific heat capacity, is the heating frequency, is the input heat rate, and is thermal diffusivity. The phase lag between the heat source and sensing point is defined as
By using the distance dependence of the phase lag , the out-of-plane thermal diffusivity is calculated as given in the next equation,
This theory is only valid under appropriate heating frequencies, because the actual phenomenon is affected by the finite size of the sample [1]. In the measurement apparatus as shown in Figure 1c, a point heat source was generated on the sample edge by the diode laser and objective lens. The infrared camera measured the temperature response on the side surface of the sample and sent it to the lock-in processing unit. The lock-in processing unit performed the lock-in analysis to obtain the phase lag between the reference signal, which was used as the power control of the diode laser, and temperature oscillations. Finally, the control PC obtained 2-dimensional phase lag distribution. Table 2 shows the thermal diffusivity measurement conditions.
Table 2.
Measurement conditions.
3. Results and Discussion
Figure 2a shows the two-dimensional phase lag distribution of the left-hand side measurement point in the type A sample. The point heating source was located in the middle of the upper side in the image. Figure 2b shows the distance dependence of the phase lag along the center line as shown in Figure 2a. The out-of-plane thermal diffusivity is obtained from the linear gradient, shown as the liner approximation curve in Figure 2a.
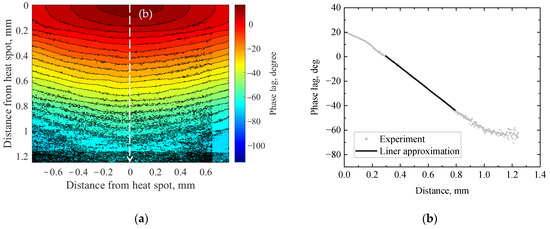
Figure 2.
(a) Phase lag distribution on left side of type A sample (Load cycle N = 106); (b) Distance dependence of phase lag on center line of (a) distribution.
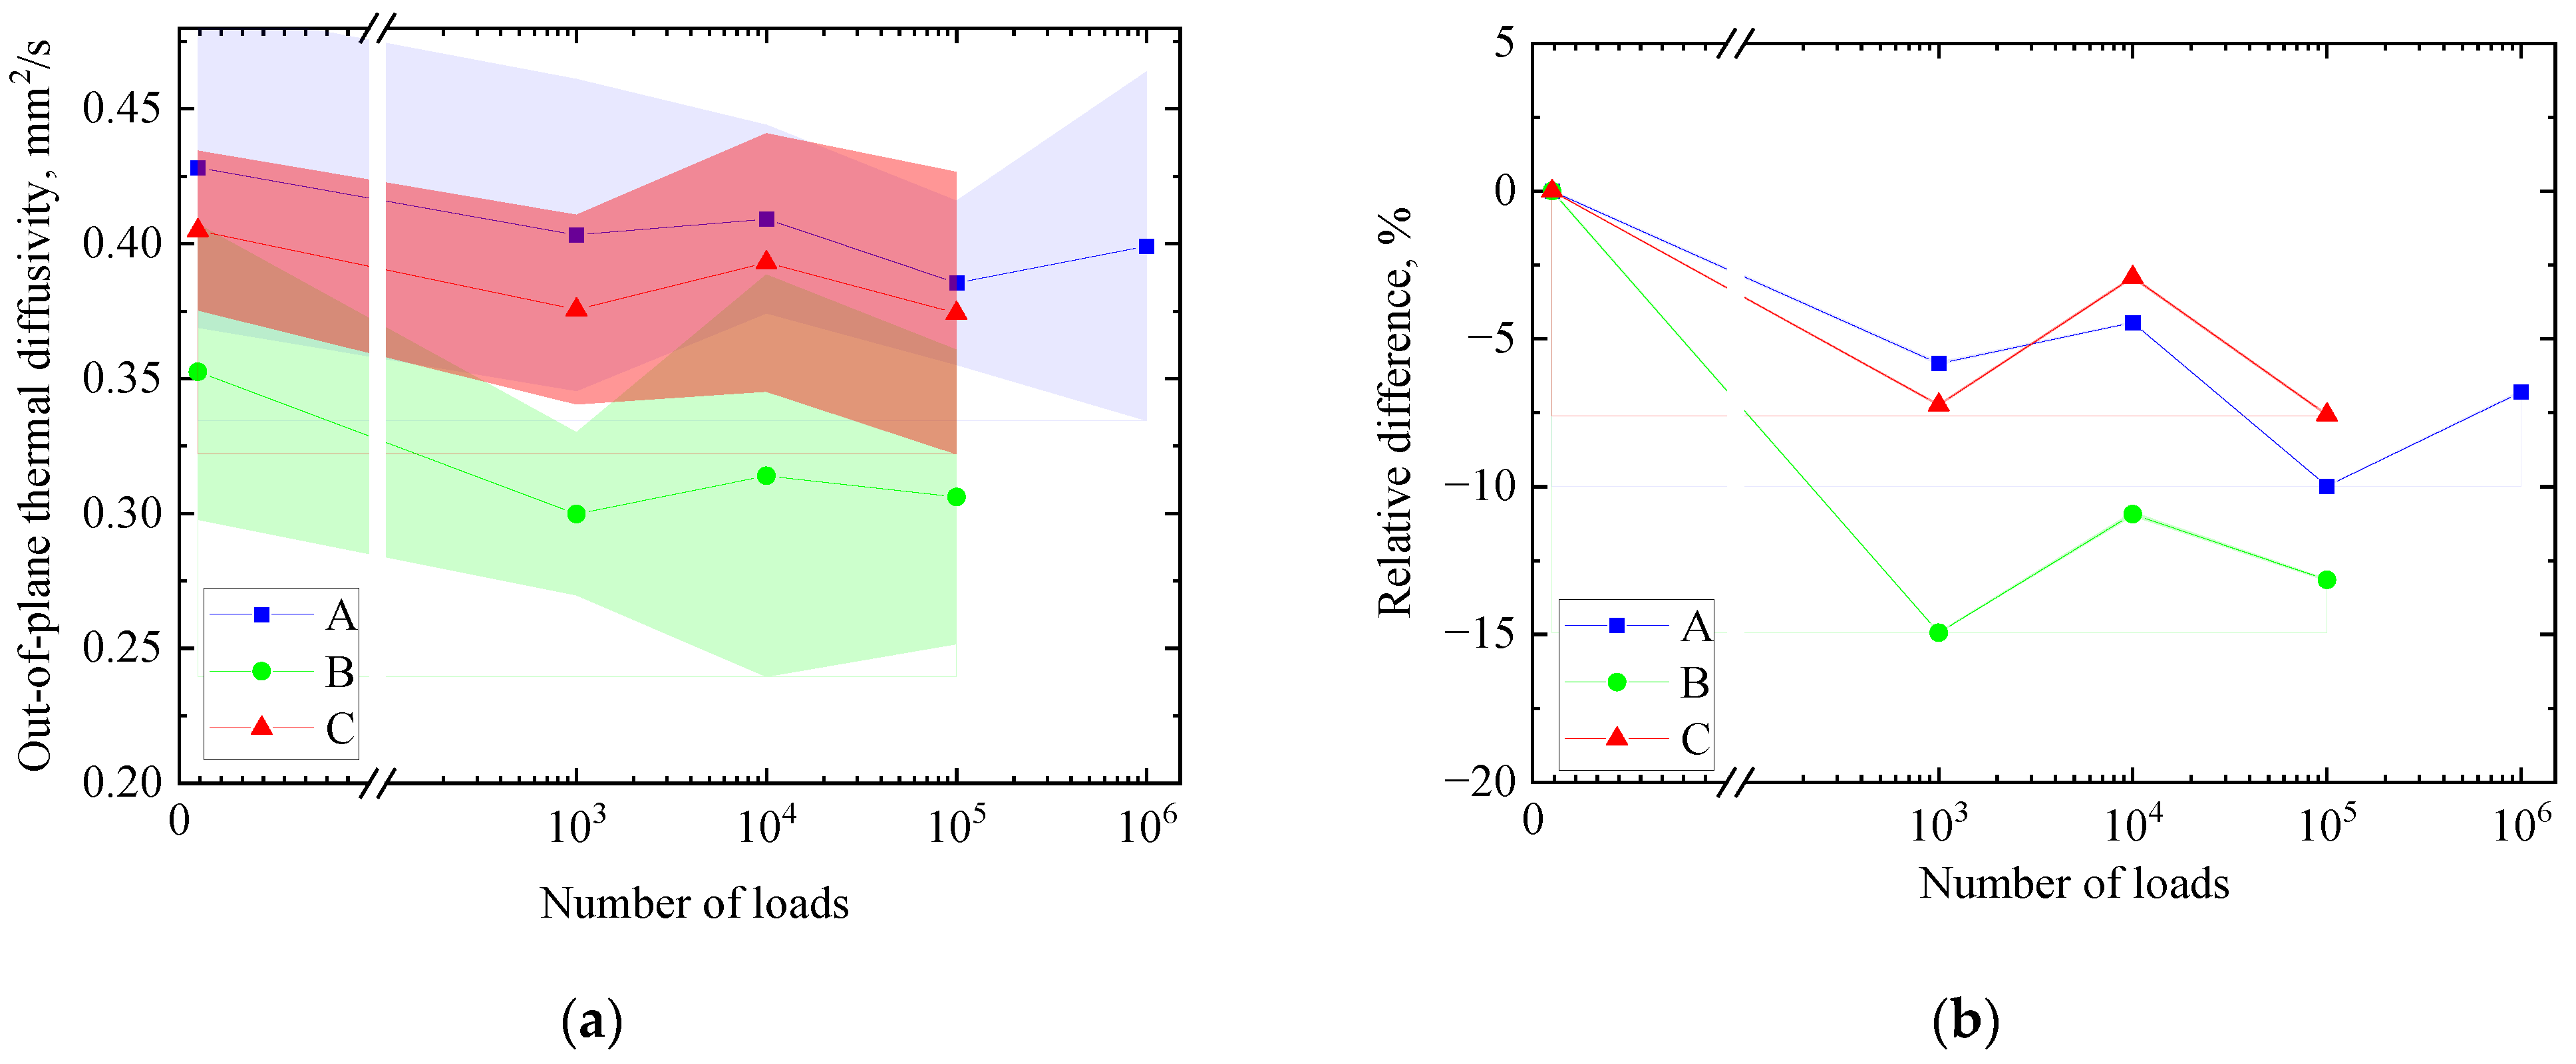
Figure 3a shows the relationship between the number of loads and the average value of out-of-plane thermal diffusivity in each sample type. Figure 3b shows the relative difference between undamaged sample and the others. The filled area in the graph shows the 3 standard deviation of each sample, which includes the deviation of the iteration. As a result, the average value decreases by 10% in Type A, 15% in Type B, and 8% in Type C at most. Additionally, the results show a decreasing trend with regard to the load cycles. This result may indicate that the thermal diffusivity decreased with an increasing minute fatigue damage in every type of sample.
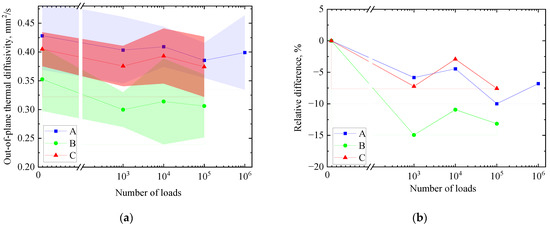
Figure 3.
(a) Out-of-plane thermal diffusivity depending on number of load cycles; (b) Relative difference compared to undamaged sample.
4. Conclusions
The effect of minute fatigue damage generated at a low load and high cycle on the thermal diffusivity was obtained. As a result, it was shown that this method can detect minute fatigue damage at a level that cannot be seen with a microscope by changing the thermal diffusivity. In the future, further analysis is necessary to identify the location of the damage by constructing a multi-layer heat conduction model. In addition, fixed-point observation using the same sample should be performed to eliminate individual differences.
5. Patents
A Japanese patent is going to be certified as a result of this work.
Funding
This research was funded by JST-Mirai Program (ID 20349575).
Data Availability Statement
The data that support the findings of this study are available from the corresponding author, R.F., upon reasonable request.
Conflicts of Interest
The authors declare no conflict of interest.
References
- Fujita, R.; Nagano, H. Novel fiber orientation evaluation method for CFRP/CFRTP based on measurement of anisotropic in-plane thermal diffusivity distribution. Compos. Sci. Technol. 2017, 140, 116–122. [Google Scholar] [CrossRef]
- Fujita, R.; Nagano, H.; Yokozeki, T. Evaluation of Fatigue Damage in CFRP Laminates Based on Periodic Heating Method using Lock-in Thermography. In Proceedings of the M&M conference 2021, Nagoya, Japan, 15–17 September 2021. OS0137. [Google Scholar]
- Kimura, M.; Watanabe, T.; Takeichi, Y.; Niwa, Y. Nanoscopic origin of cracks in carbon fibre-reinforced plastic composites. Sci. Rep. 2019, 9, 19300. [Google Scholar] [CrossRef]

Publisher’s Note: MDPI stays neutral with regard to jurisdictional claims in published maps and institutional affiliations. |
© 2021 by the authors. Licensee MDPI, Basel, Switzerland. This article is an open access article distributed under the terms and conditions of the Creative Commons Attribution (CC BY) license (https://creativecommons.org/licenses/by/4.0/).