1. Introduction
Thermal contact resistance (TCR) is a phenomenon where heat flow is impeded at the contact interface between two materials. A reduction in TCR is critical for efficiently discharging electronic heat waste, particularly for power semi-conductors. However, TCR reduction is difficult because the TCR occurring mechanism is not fully understood. This is due to the complexity of its physical properties and geometrical and mechanical factors. To understand TCR, we evaluated its factors and measured the local TCR. The steady state method, which is generally used in this case, was used to measure the averaged TCR value across the contact interface of a bulk sample. Additionally, as unsteady methods, the thermo-reflectance [
1] method and the 3 ω method [
2,
3] were studied to measure the TCR of a homogenous thin film sample. However, a method to measure local TCR in the contact interface has not yet been established. For this reason, the authors propose a new measurement method of the local TCR and its distribution, using a periodic heating method with lock-in thermography (LIT). So far, we have developed a theoretical model and measurement apparatus with LIT and an IR microscope. It was demonstrated that by using the proposed method, a local TCR can be visually measured [
4]. In this paper, to further develop this method, a new method to measure a line distribution of TCR was reported. At first, a theory of measurement was derived by drawing comparisons between the two heat conduction equations that govern each layer of the laminated and glued sample. A measurement apparatus was also constructed with LIT and an IR microscope. The experiment was conducted on an isotropic graphite sample, then, the local TCR and its distribution was obtained.
2. Measurement Theory
The measurement method was carried out using the two layers system, consisting of two thin plates, A and B, that have TCR at their interface, as shown in
Figure 1. When a point distant from the edge of the A layer surface is heated periodically by a laser focused on a spot, the temperature response is expressed as the following [
4]:
where,
T is the temperature, the subscribe A, B represents layer A and B, r is the distance in the radial direction, z is the distance in the thickness direction, t is time, i is imaginary number unit, ω is angular frequency, “hat” denotes the Hankel transform, k is the Hankel variable, s is the Laplace variable, J0 is the zeroth order Bessel function, Q0 is the heat source constant, a is the heating radius, λ is the thermal conductivity, d, L are the thickness of A layer and whole sample, R is the TCR, and D is the thermal diffusivity, . The sample surface and the back surface are assumed to be insulated.
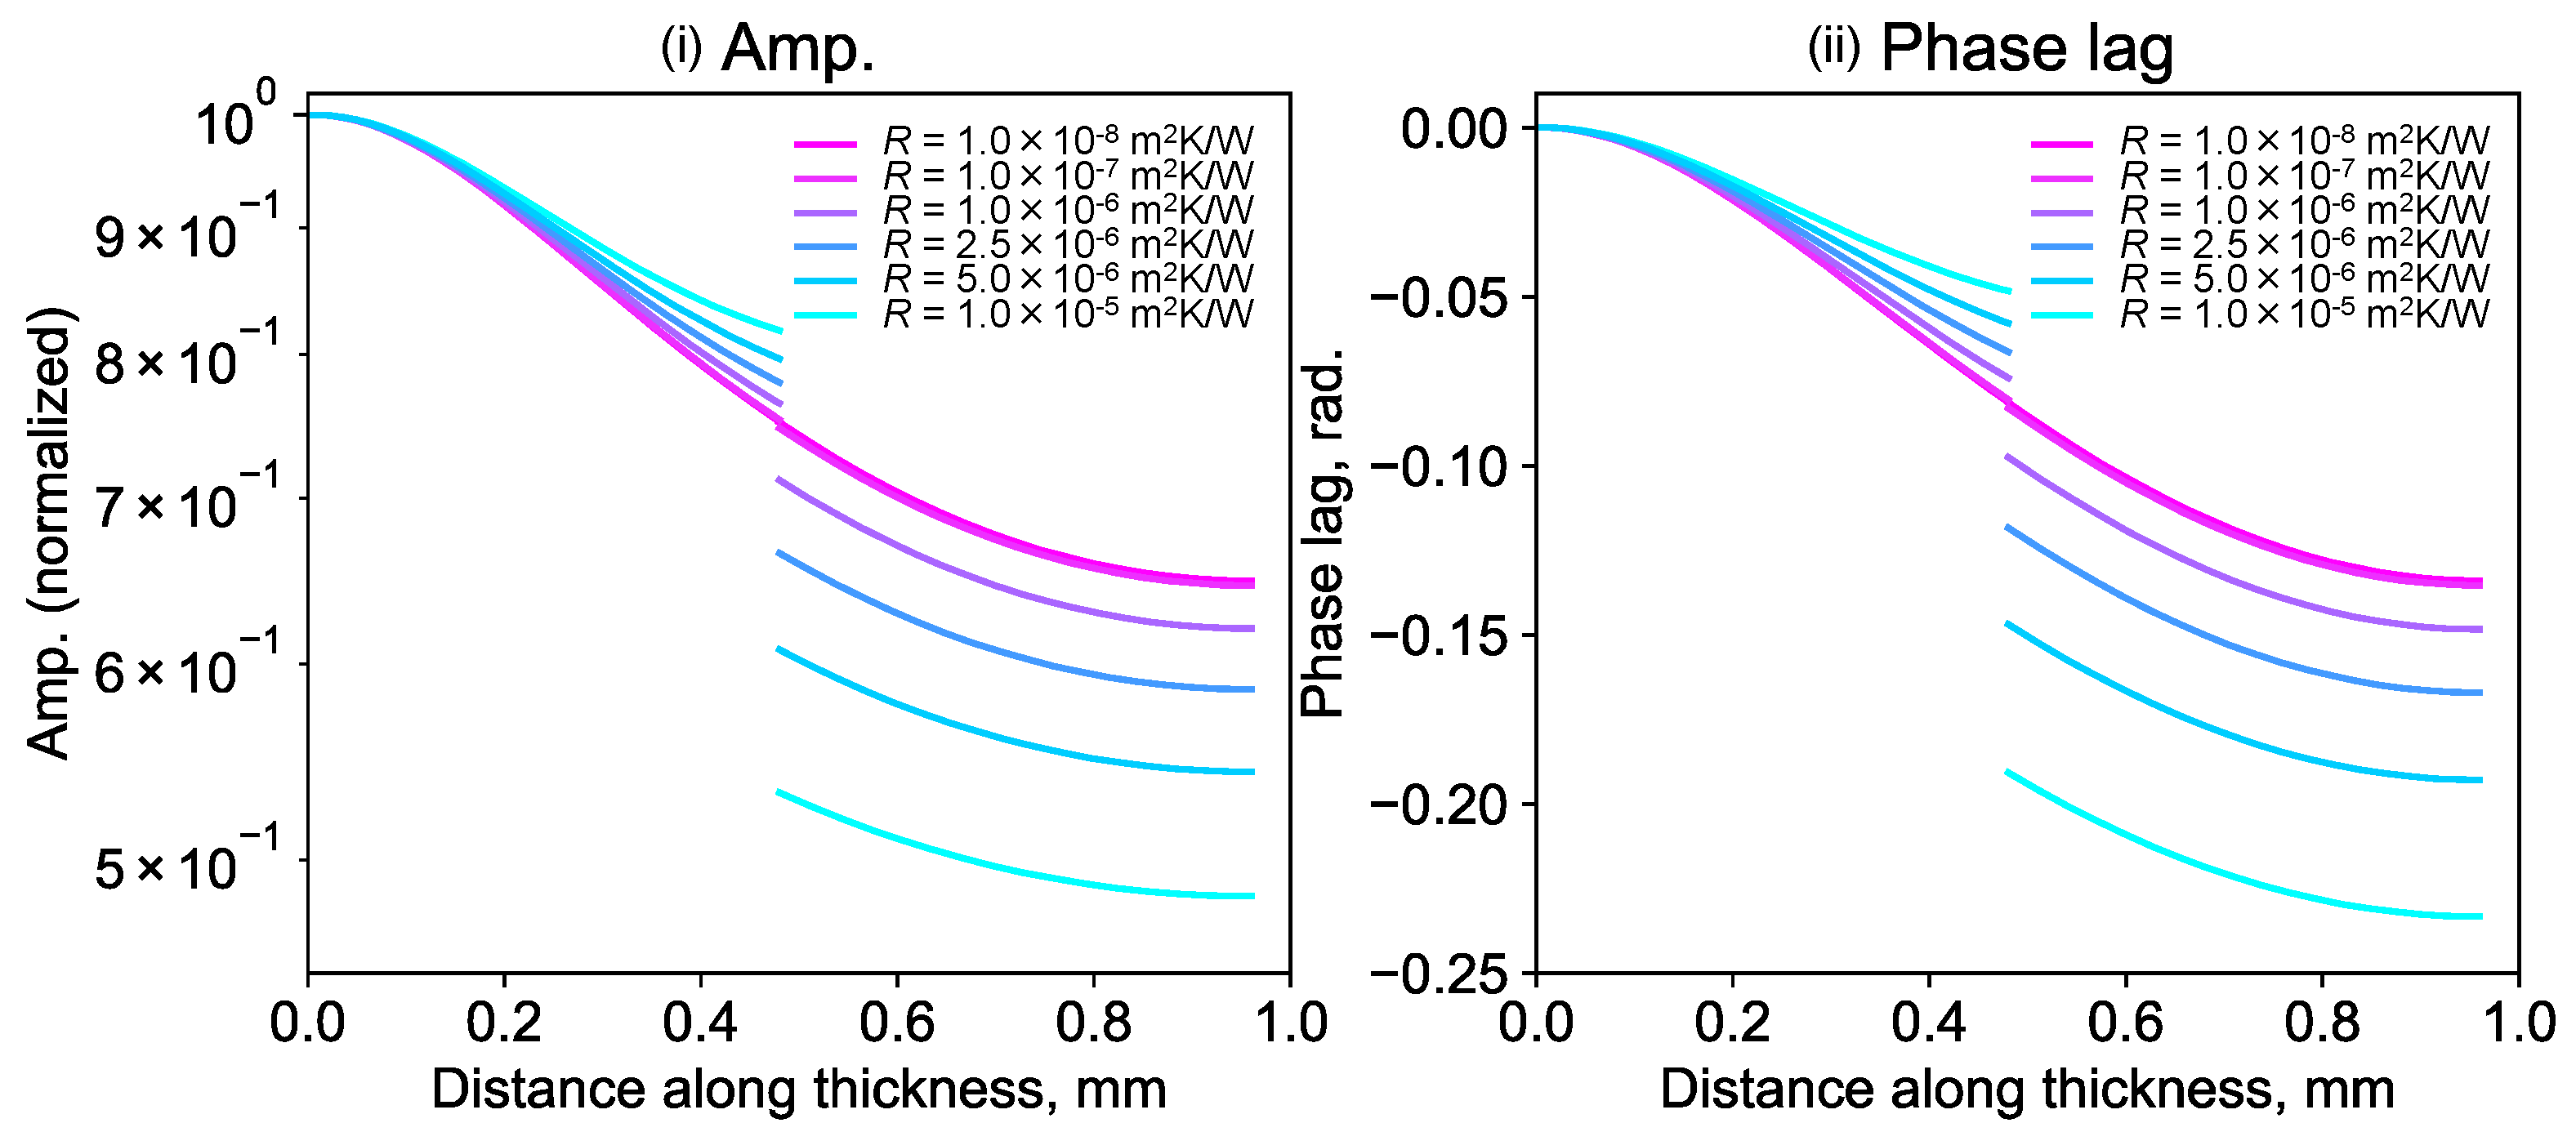
Figure 2 shows the theoretical curve of the amplitude and the phase lag in the sample side surface for the different TCR (denoted by
R) with the following applied values:
r =
rw = 400 mm,
f = 1 Hz,
d = 0.48 mm,
L = 0.96 mm,
DA =
DB = 102 mm
2/s,
λA =
λB = 126 W/(m·K),
a = 100 μm, and
R = 1.0 × 10
−8−1.0 × 10
−5 m
2K/W. At the contact interface (
z =
d), the amplitude and the phase lag jump depending on TCR. Therefore, TCR is analyzed by solving the inverse problem with the measured phase lag by LIT. Since LIT of the IR detector array of 512 × 640 can acquire the phase lag distribution of the side surface, we acquired 640 sets of experimental data of the relation between the phase lag and the thickness directional distance. Consequently, TCR distribution from 640 analyses is obtained by the analyses along the contact interface with
r corresponding to the distance from the sample edge.
3. Measurement Apparatus, Sample and Condition
The measurement apparatus is shown in
Figure 3. It is based on a sample surface spot heating−side surface detecting system in microscale using IR microscope, which has a spatial resolution of 2.5 μm. A sample was made by bonding and laminating two isotropic graphite IG-110 plates (thickness is 0.480 mm). The total thickness of the prepared sample was 0.965 mm. The thermal conductivity and the thermal diffusivity of IG-110 are 126 W/(m·K) and 102 mm
2/s [
5]. The measurements were conducted in the conditions of 1.0 Hz. The frame rate of LIT was 99 Hz. The measurement was conducted at room temperature under atmospheric pressure. Heating points were located for the three points of 500 μm pitch along the sample edge to assess the validity of the distribution analysis.
4. Discussion
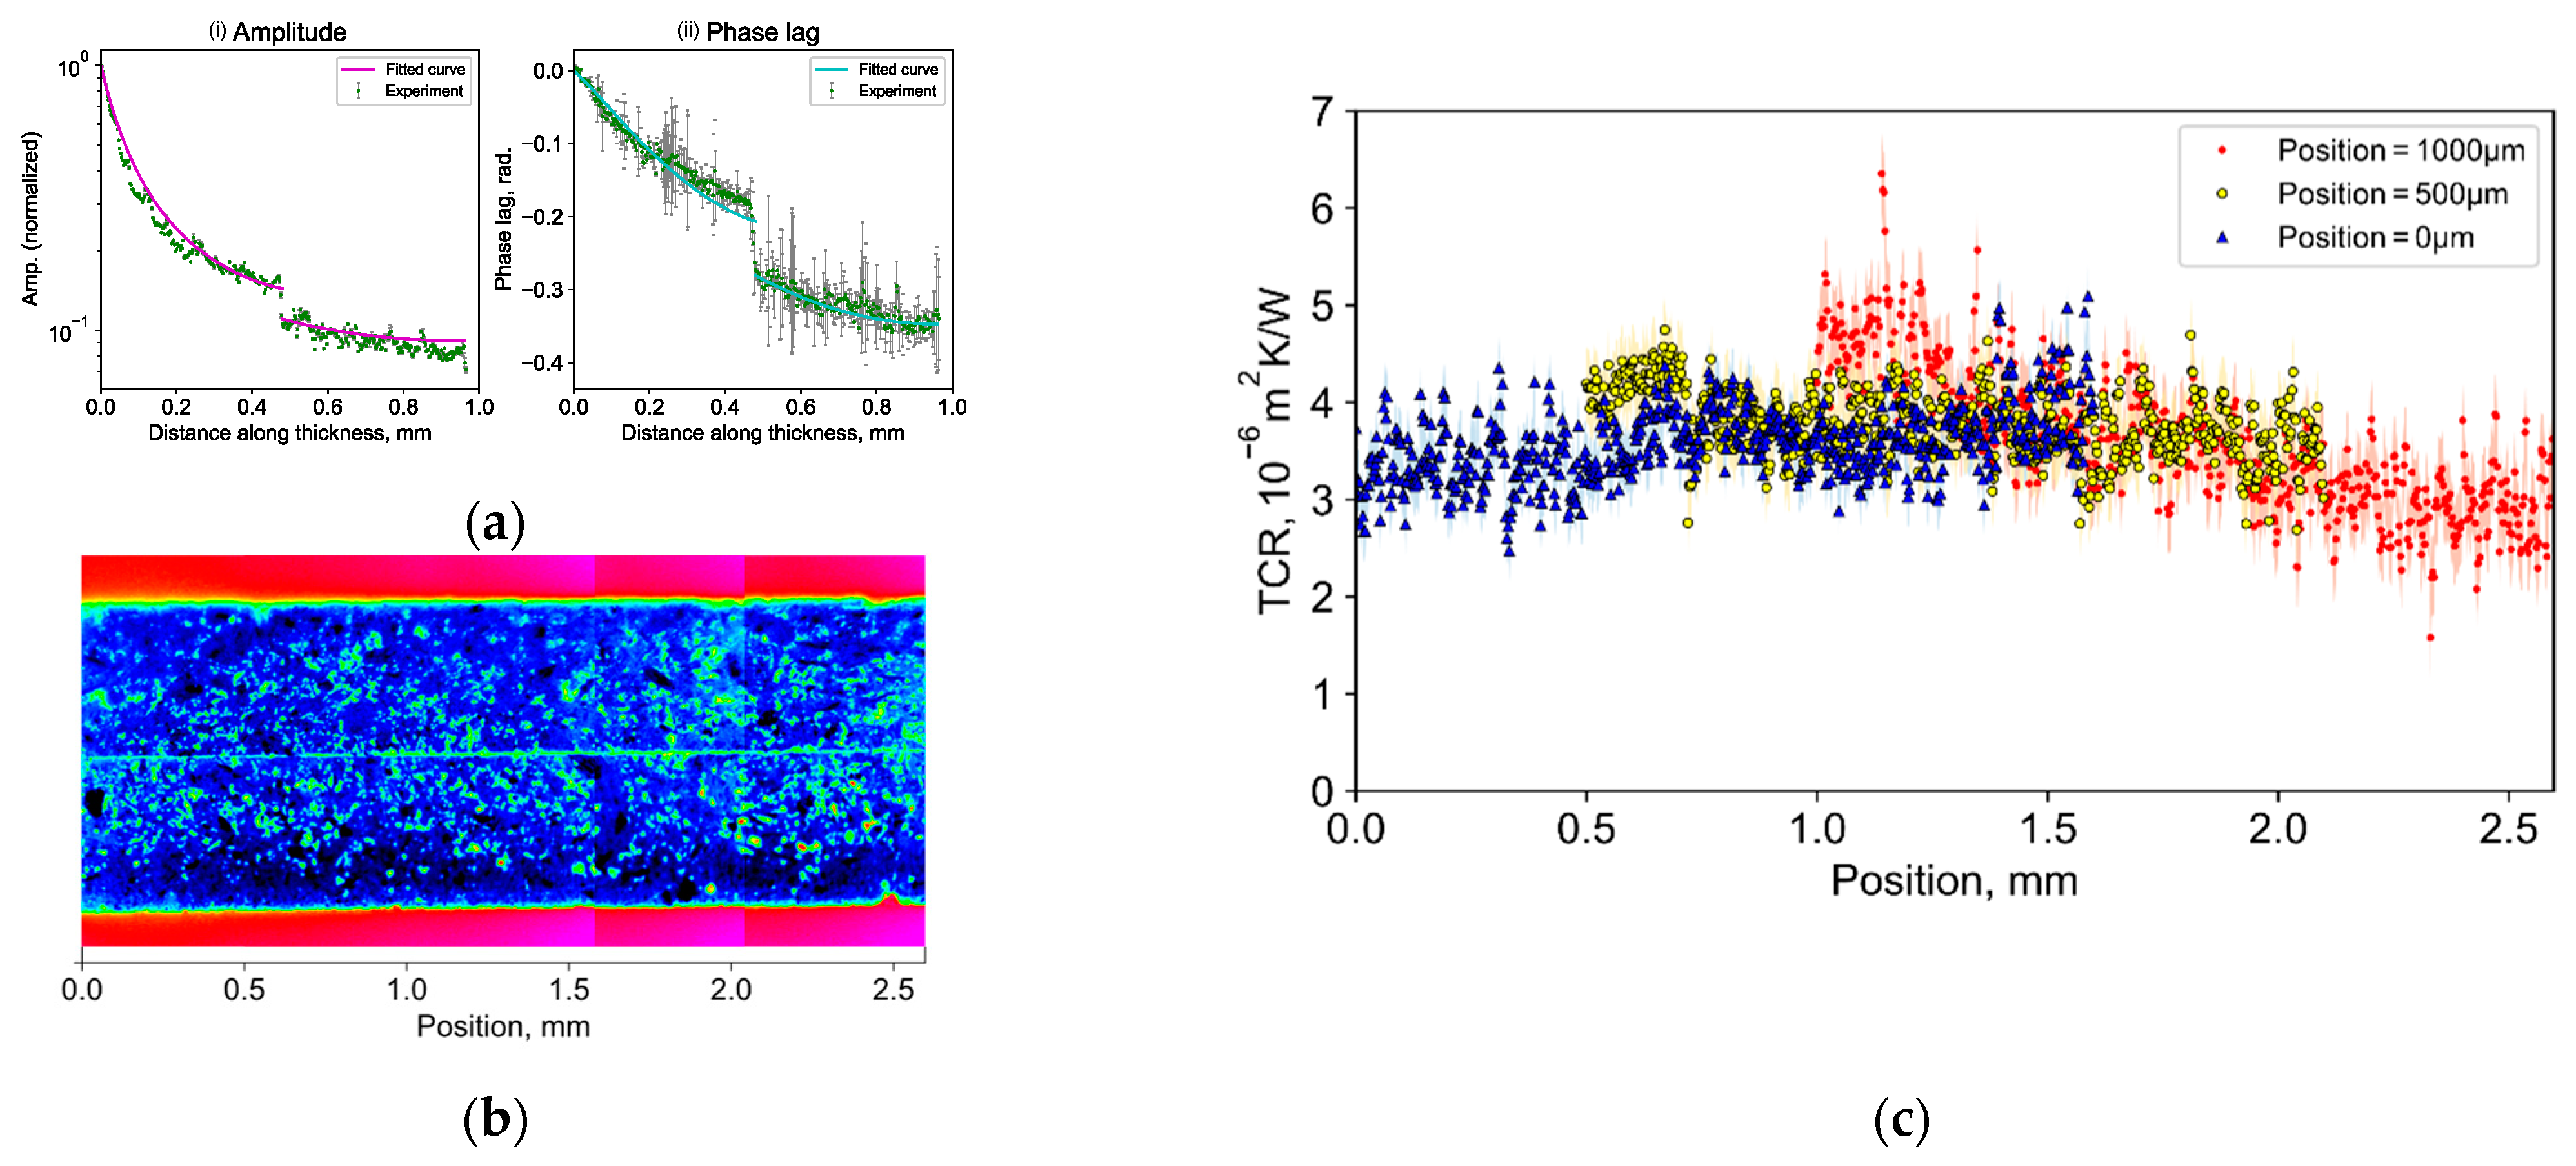
Figure 4 shows the TCR measurement result: (a) TCR fitting result for a typical analysis position [
4]; (b) IR image of the sample side surface; (c) distribution analysis result.
Figure 4a shows the extracted measurement plots and the fitted theoretical curves with error bars showing the standard error rate: ((i) amplitude, (ii) phase lag). The fitting analysis was conducted using the least square method for both the amplitude and phase lag plots. The theoretical curve and experimental plots show a good level of agreement. Thus, the obtained TCR values were (2.7 ± 1.5) × 10
−6 m
2K/W. This result was inferred to provide reasonable values because both were similar to the measurement results of Feng et al. who measured the averaged TCR of a whole contact interface, using the FDTR method with a silicon–silicon contact interface bonded with thermal grease [
6]. While the amplitude plots have a smaller standard error rate, TCR is more sensitive to amplitude. Therefore, both the amplitude and phase lag, not only the amplitude, were used for the fitting analysis.
Then, the distribution was obtained in the range of 1.6 mm by one measurement.
Figure 4b shows the results of the three measurement points at 500 μm pitch. The colored shaded area represents the standard error. The validity of the distribution analysis was confirmed by the agreement of the results in the overlapping regions. As a result, it is shown that this measurement method enables the evaluation of the local TCR with a resolution of 2.5 μm, which matches the spatial resolution of LIT. It was also revealed that there is a difference of about 30% of TCR distribution in a small area of about 2.6 mm.
5. Conclusions
A new measurement method of the local TCR and its distribution was proposed. The measurement theory and apparatus were constructed based on the sample surface spot heating−side surface detecting system in microscale. Then, the validity of the measurement and analysis was confirmed by the experiments with the sample made from isotropic graphite plates. Consequently, the TCR fitting analysis result was (2.7 ± 1.5) × 10−6 m2K/W, and it was confirmed to be a reasonable value in comparison of the reference. The values and behavior of the distribution analysis coincided among the results for three measurement points of 500 μm pitch. As a result, the distribution analysis revealed that there is a difference of about 30% of TCR distribution in a small area of about 2.6 mm.
6. Patents
A Japanese patent will be certified for the result of this work: JP2019-094934.


