1. Introduction
The availability of clean, safe water is a basic human right. Maintaining the standard of water delivery systems is crucial to public health and more so if they pertain to the pharmaceutical industry. Our study addresses the development and implementation of a comprehensive framework for water system standardization, specifically designed to comply with the World Health Organization’s (WHO) guidelines [
1], in light of the global water quality crisis and the urgent need for standardized water quality management. This paper explores the technique of our approach to create a robust system to ensure that the system is designed in such a way that standards are met. Specifically, we integrate a Process and Instrumentation Diagram (P&ID) [
2] with an Excel tool that has been meticulously designed.
Like many underdeveloped countries, Pakistan has enormous obstacles in terms of providing its people with access to clean water. Water supply systems vary greatly in quality, and waterborne infections are common [
3]. We realized that in order to address these issues, a methodical strategy to evaluate and raise water system standards was required. The urgency of addressing concerns related to water quality, improving public health outcomes, and harmonizing with worldwide standards promoted by the World Health Organization spurred the development of our framework.
Our methodology is based on the combination of an Excel-based application and a thorough P&ID. The P&ID provides a thorough visual depiction of the water purification process, including the design and all of the equipment currently in use. A comprehensive insight into the system is made possible by this graphical representation, which also helps to identify possible areas for development. The P&ID also includes water standards for each step, which provide a convenient reference for evaluating the output quality of water.
Our Excel application transforms WHO annexure standards into a useful scoring system to support the P&ID. Every item in the annexure relates to a certain aspect of the functioning of the water system, and these factors are systematically assessed in comparison to the procedures and infrastructure of our company. The end product is a thorough evaluation that identifies any departures from WHO guidelines as well as areas of conformity.
By ensuring that water systems continuously fulfill international standards, a standardized approach lowers the risk of waterborne illnesses and improves public health in general. In addition, it promotes sustainable growth, eases regulatory compliance, and builds trust in the quality of the water supply.
In summary, this study hopes to formulate a framework which can be used on an industrial scale for the standardization (as per any regulatory body) of various systems installed.
RQ1: How to design a robust ‘systems’ implementation tool on an industrial scale.
2. Related Studies
The development of analytical tools for industrial standardization has been an area of active research, with numerous studies addressing various aspects of tool design, implementation, and impact. This section provides an overview of the relevant research conducted in this domain.
2.1. Tool Development Methodologies
Several studies have focused on methodologies for developing analytical tools tailored to industrial standardization needs. For instance, ref. [
4] proposed a systematic approach for designing analytical tools to support standardization efforts in manufacturing industries. Their methodology emphasized the importance of user-centered design principles and iterative feedback loops to ensure tool usability and effectiveness.
2.2. Implementation Case Studies
Case studies have provided valuable insights into the practical implementation of analytical tools for industrial standardization. For example, ref. [
5] presents a case study of a multinational corporation that developed and deployed an analytical tool to streamline standardization processes across its global operations. The study highlighted the challenges and successes encountered during the tool’s implementation and demonstrated its impact on enhancing organizational efficiency and standardization compliance. Additionally, ref. [
6] conducted a comparative analysis of water management practices in the pharmaceutical sector, uncovering differences in regulatory compliance approaches and highlighting areas for improvement.
2.3. Future Directions and Emerging Trends
Research in this area has also explored emerging trends and future directions for analytical tool development in industrial standardization. Ref. [
7] proposed leveraging artificial intelligence and machine learning algorithms to enhance the predictive capabilities of analytical tools, enabling proactive decision-making and continuous improvement in standardization processes. Similarly, ref. [
8] advocated for the integration of blockchain technology to enhance data security and traceability in standardization frameworks, paving the way for more transparent and reliable standardization practices in complex industrial ecosystems.
Initially aimed at rectifying the water system, our project expanded to encompass the design of a versatile structure suitable for implementing various guidelines or regulations.
3. Methodology
3.1. Designing Process and Instrumentation Diagram (P&ID)
The first step involved in our research was the creation of a comprehensive Process and Instrumentation Diagram (P&ID) for the entire water system layout of the industry under study as depicted in
Figure 1. This diagram provides a visual representation of the various components, connections, and flow paths within the system. To accomplish this, we meticulously analyzed the existing infrastructure, including pipelines, pumps, valves, tanks, and other relevant equipment. Through collaboration with industry experts and referencing technical documentation, we accurately depicted the layout and interconnections of these elements. The P&ID served as a foundational blueprint for understanding the operational dynamics and flow of materials within the water management system.
3.2. Assessment of Working Conditions and Parameters
Following the creation of the P&ID, our research focused on assessing the working conditions, parameters, and operations of each equipment component installed within the water system, in adherence to Standard Operating Procedures (SOPs). Through a combination of on-site inspections, data collection, and interviews with maintenance personnel and operators, we gathered detailed information regarding the functionality and performance of individual equipment units. Key parameters such as pressure, temperature, flow rates, and quality metrics were systematically analyzed. Any deviations from expected working conditions or operational parameters were meticulously documented.
3.3. Compilation of Comprehensive Documentation
The culmination of our research efforts involved compiling all the acquired data, observations, and analyses into a single comprehensive document. This document now serves as an invaluable resource containing detailed information on the industry’s water management system. Drawing upon the insights gained from the P&ID design and equipment assessments, we organized the information in a structured format for easy reference and accessibility.
Each section of the document provides a thorough overview of specific aspects of the water system, including equipment specifications, operating procedures, maintenance protocols, troubleshooting guides, and safety considerations.
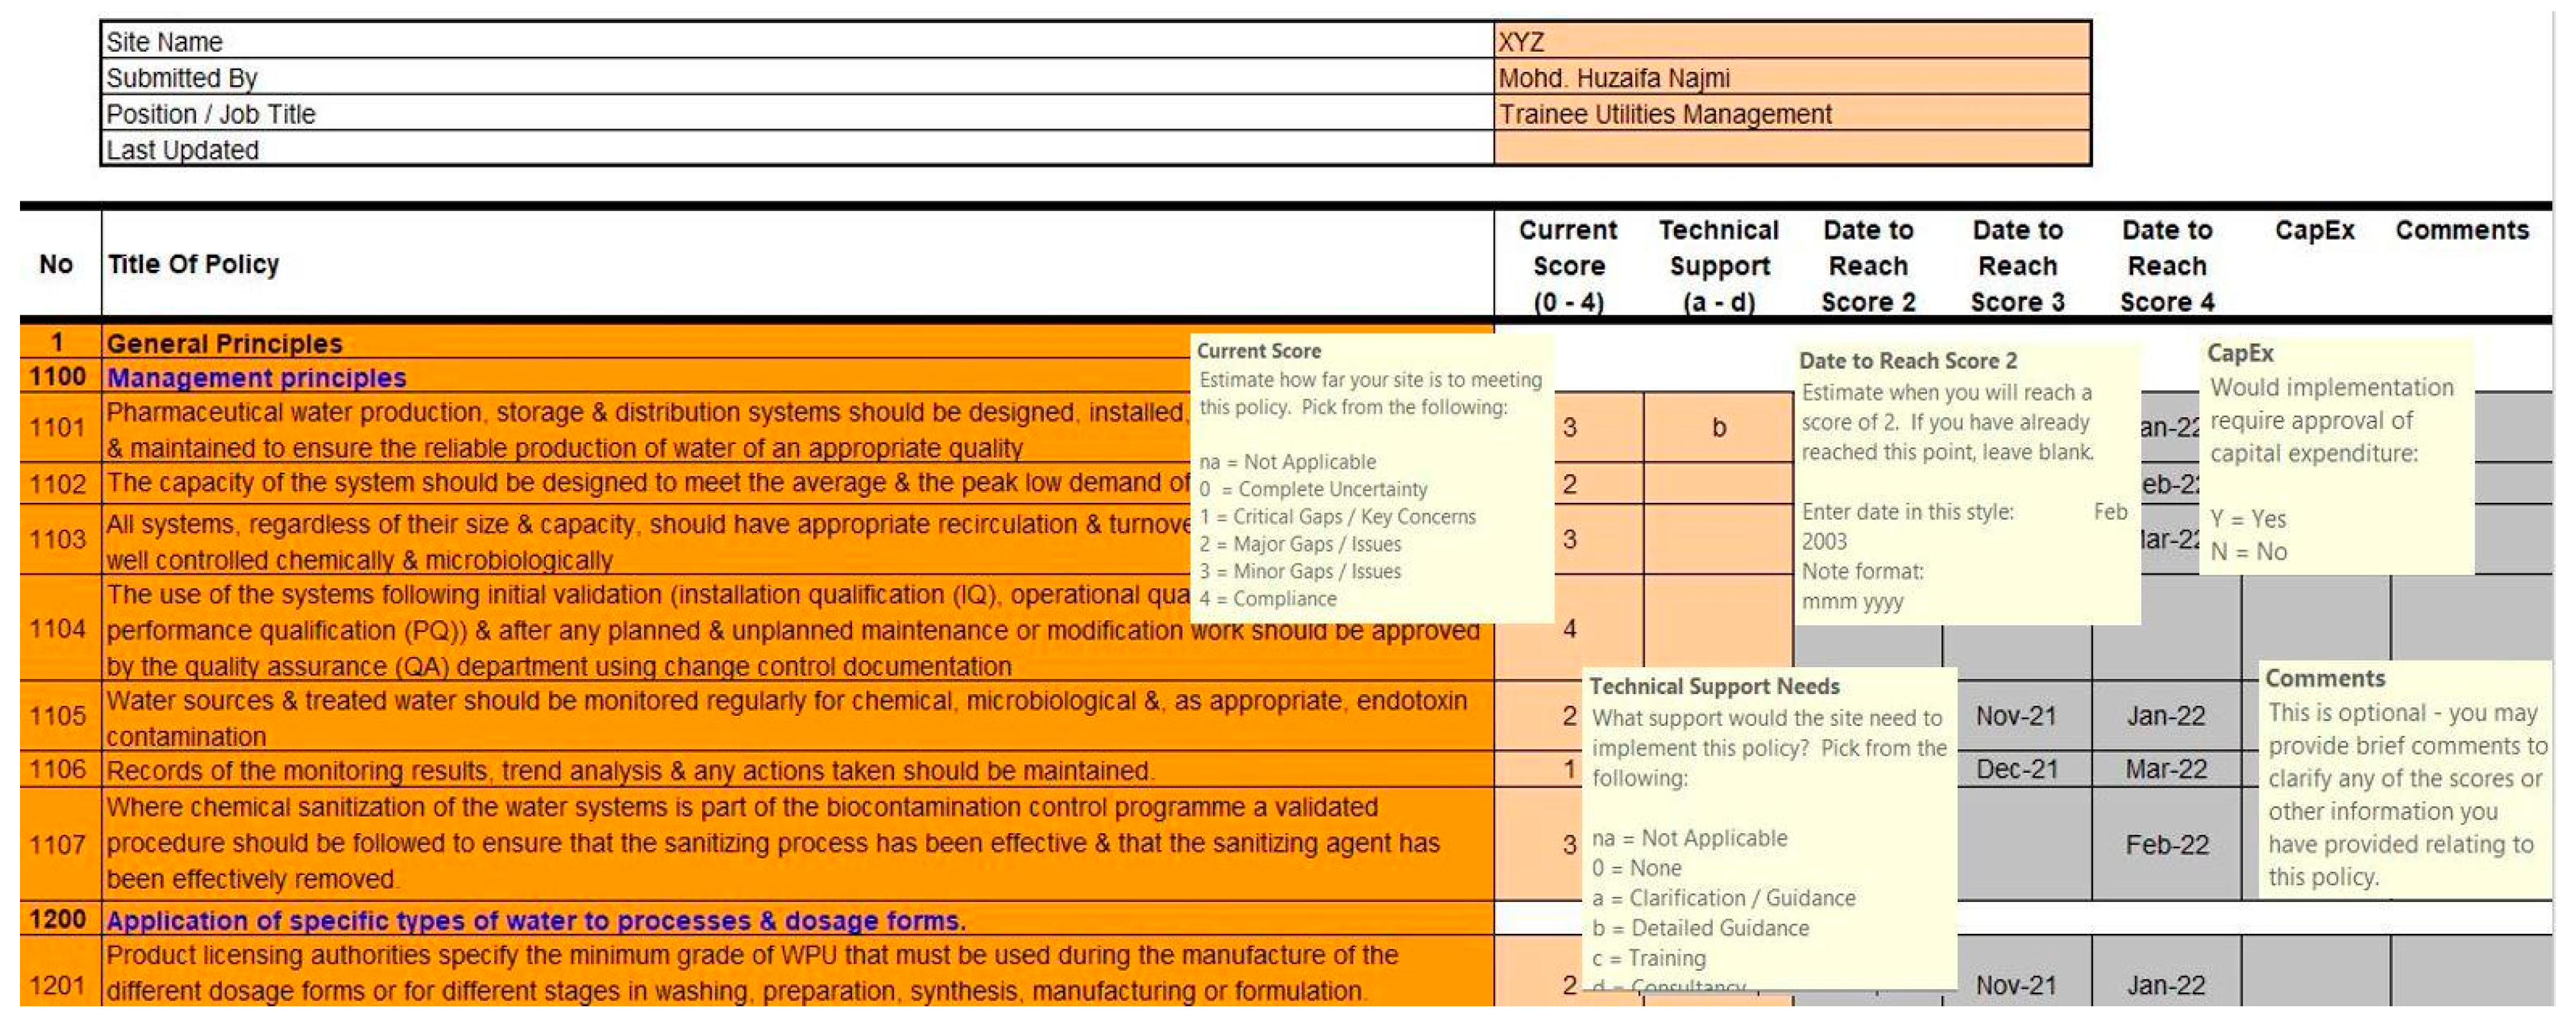
3.4. Consultation of Guidelines
We accessed the latest WHO guidelines on ‘Water for Pharmaceutical Use’ (annexure) to establish a benchmark for evaluating the water management system against industry standards. Each chapter of the guidelines was carefully reviewed, and the paragraphs were broken down into individual points for clarity and ease of reference. These points were then organized into corresponding categories within an Excel tool, facilitating the systematic assessment and identification of gaps in compliance. An extract is attached in
Figure 2.
3.5. Development of Evaluation Tool
An Excel-based evaluation tool was developed to streamline the assessment process and facilitate efficient gap analysis. The tool consists of separate tabs for each chapter of the guidelines, with points listed under each category. Stakeholders can input relevant data and observations against each point, adhering to regulatory requirements.
3.6. Technical Support Identification
A dedicated section within the evaluation tool allows stakeholders to identify the technical expertise required to address identified gaps and achieve compliance with WHO guidelines. This ensures that necessary resources and expertise are identified upfront, streamlining the implementation of corrective measures.
3.7. Projection of Improvement
Another feature of the evaluation tool is the ability to project the timeline for improving the current compliance score. Managers can input anticipated timelines for addressing identified gaps and achieving desired levels of compliance, facilitating strategic planning and resource allocation.
3.8. Assessment of Capital Expenditure
The evaluation tool includes functionality to assess whether capital expenditure will be required to address identified gaps. Boards can indicate whether investments in equipment, infrastructure, or other resources are necessary to achieve compliance, aiding in budgetary planning and decision-making.
3.9. Integration of Stakeholder Comments
Lastly, the evaluation tool allows for the addition of comments against each point, providing valuable insights, observations, and recommendations. This promotes collaboration and ensures that diverse perspectives are considered in the gap analysis and compliance improvement process. This methodology, coupled with the development of a comprehensive evaluation tool, enables a structured and systematic approach to assessing regulatory compliance and facilitating efficient operations as per WHO guidelines for water used in pharmaceutical processes.
3.10. Development of Graphical Spiderweb Layout
In addition to the Excel-based evaluation tool, a graphical spiderweb layout was developed to visually represent the scores of each point against the WHO guidelines. The spiderweb layout provides a clear and intuitive visualization of the compliance status, both individually for each point and collectively for each chapter. Each point is represented by a node on the spiderweb graph, with lines connecting the nodes to form a web-like structure. The length of each line corresponds to the score of the respective point, allowing stakeholders to quickly identify areas of strength and weakness within the water management system. By examining the graph for each chapter, involved parties can ascertain which specific points require improvement and which departments or stakeholders are responsible for addressing them.
3.11. Utilization of a Gantt Chart for Compliance Projection
In addition to the spiderweb layout (
Figure 3a), a Gantt chart was employed (
Figure 3b) to visually depict the timeline for achieving 100% compliance with the WHO guidelines, with milestones and tasks organized chronologically. The Gantt chart serves as a dynamic planning tool, enabling stakeholders to adjust timelines and priorities as needed to optimize the compliance improvement process.
This consolidated document not only serves as a repository of knowledge for internal stakeholders but also functions as a practical reference guide that can be consulted whenever there is a need to identify, understand, or address issues related to the water management system.
4. Considerations and Constraints
4.1. Limited Flexibility
While the Excel tool provides a structured framework for evaluation, its rigid format may limit adaptability to evolving regulatory requirements or organizational needs. Modifications to accommodate new guidelines or additional evaluation criteria could be challenging without significant restructuring.
4.2. Complexity of Use
The tool’s complexity, especially for users with limited Excel proficiency, may hinder its effective utilization. Without proper training or guidance, stakeholders may struggle to navigate the tool efficiently, potentially leading to errors or incomplete assessments
4.3. Data Integrity Concern
As an Excel-based solution, the tool may be susceptible to data integrity issues, such as accidental deletion, formula errors, or version control problems. Without robust data validation mechanisms or centralized control, maintaining data accuracy and consistency could be challenging, compromising the reliability of the assessment outcomes
4.4. Limited Collaboration Features
Collaboration among stakeholders may be constrained by the Excel tool’s lack of built-in collaboration features. Real-time collaboration, document sharing, and tracking changes may require additional tools or manual coordination, potentially slowing down the assessment process and impeding effective communication.
4.5. Dependency on Manual Inputs
The tool heavily relies on manual inputs from stakeholders, increasing the risk of human error and inconsistency. Without automated data capture or integration with other systems, stakeholders may spend considerable time and effort inputting data, potentially leading to data entry errors or delays.
4.6. Limited Visualization Options
While the spiderweb layout and Gantt chart provide valuable visualizations, the Excel tool may lack advanced visualization options for interpreting and presenting complex data. Alternative visualization tools or platforms may offer more sophisticated graphical representations, enhancing insights and decision-making capabilities.
4.7. Difficulty in Tracking Changes
Without robust change management features or audit trails, stakeholders may struggle to monitor and document the evolution of compliance efforts effectively.
Addressing these deficiencies may require exploring alternative software solutions or enhancements to the existing Excel tool, prioritizing usability, data integrity, collaboration, scalability, and visualization capabilities. Regular reviews and updates to the tool’s design and functionality can help ensure its effectiveness in supporting compliance improvement efforts.
5. Future Research Directions
5.1. Development of Automated Assessment Tools
Future research efforts could focus on developing automated assessment tools or software solutions equipped with advanced algorithms for data analysis and scoring. These tools could offer enhanced accuracy, efficiency, and scalability compared to manual evaluation methods.
5.2. Integration with IoT and Data Analytics
Leveraging Internet-of-Things (IoT) technologies and data analytics capabilities could enable the real-time monitoring and predictive analysis of water management systems. Research in this area could explore ways to integrate IoT sensors and predictive modeling algorithms with compliance assessment tools to provide actionable insights and early warning systems for potential issues.
5.3. Enhanced Customization and Adaptability
Future research could aim to enhance the customization and adaptability of compliance assessment tools to accommodate the diverse needs and requirements of different industries and organizations. This could involve the development of modular frameworks or customizable templates that allow users to tailor the tool to their specific contexts and operational environments.
5.4. Integration with Regulatory Databases
Research efforts could focus on integrating compliance assessment tools with regulatory databases and repositories to ensure up-to-date access to relevant standards, guidelines, and best practices. This would facilitate seamless alignment with evolving regulatory requirements and enable automated updates to assessment criteria within the tool.
5.5. User Training and Support
Future research could explore strategies for providing comprehensive user training and support to ensure the effective utilization of compliance assessment tools. This could involve the development of user guides, training modules, and interactive tutorials to enhance user proficiency and promote consistent and accurate assessment practices.
6. Conclusions
Through the development of a structured Excel-based evaluation tool, coupled with graphical representations such as spiderweb layouts and Gantt charts, we sought to systematically identify gaps in compliance with WHO guidelines and chart a course toward achieving and maintaining regulatory adherence. Challenges such as complexity of use, data integrity concerns, and scalability issues underscore the need for the ongoing refinement and enhancement of evaluation methodologies and tools.
In essence, our research underscores the critical role of comprehensive evaluation methodologies and innovative tools in driving continuous improvement and ensuring regulatory compliance within the pharmaceutical industry’s water management systems. By embracing a culture of proactive risk management and regulatory adherence, organizations can enhance patient safety, mitigate operational risks, and uphold the highest standards of quality and integrity in pharmaceutical production.
Author Contributions
Conceptualization, M.H.N.; methodology, M.H.N.; software, M.H.N.; validation, M.H.N. and S.A.K.; formal analysis, M.H.N.; investigation, M.H.N.; resources, M.H.N.; data curation, M.H.N.; writing—original draft preparation, M.H.N.; writing—review and editing, M.H.N.; visualization, M.H.N.; supervision, S.A.K.; project administration, S.A.K.; funding acquisition, S.A.K. All authors have read and agreed to the published version of the manuscript.
Funding
University of Regina Research Funding.
Institutional Review Board Statement
Not applicable.
Informed Consent Statement
Not applicable.
Data Availability Statement
Data is unavailable due to privacy restrictions.
Conflicts of Interest
The authors declare no conflict of interest.
References
- Available online: https://www.who.int/docs/default-source/medicines/norms-and-standards/guidelines/production/trs970-annex2-gmp-wate-pharmaceutical-use.pdf?sfvrsn=39eb16b8_0 (accessed on 20 November 2021).
- Kang, S.O.; Lee, E.B.; Baek, H.K. A digitization and conversion tool for imaged drawings to intelligent piping and instrumentation diagrams (P&ID). Energies 2019, 12, 2593. [Google Scholar] [CrossRef]
- Daud, M.K.; Nafees, M.; Ali, S.; Rizwan, M.; Bajwa, R.A.; Shakoor, M.B.; Arshad, M.U.; Chatha, S.A.S.; Deeba, F.; Zhu, S.J.; et al. Drinking water quality status and contamination in Pakistan. BioMed Res. Int. 2017, 2017, 7908183. [Google Scholar] [CrossRef] [PubMed]
- Nguyen, H.N.; Lasa, G.; Iriarte, I.; Atxa, A.; Unamuno, G.; Galfarsoro, G. Human-centered design for advanced services: A multidimensional design methodology. Adv. Eng. Inform. 2022, 53, 101720. [Google Scholar] [CrossRef]
- Goel, K.; Bandara, W.; Gable, G. Conceptualizing Business Process Standardization: A Review and Synthesis. Schmalenbach J. Bus. Res. 2023, 75, 195–237. [Google Scholar] [CrossRef]
- Chaturvedi, U.; Sharma, M.; Dangayach, G.S.; Sarkar, P. Evolution and adoption of sustainable practices in the pharmaceutical industry: An overview with an Indian perspective. J. Clean. Prod. 2017, 168, 1358–1369. [Google Scholar] [CrossRef]
- Bharadiya, J.P. The role of machine learning in transforming business intelligence. Int. J. Comput. Artif. Intell. 2023, 4, 16–24. [Google Scholar] [CrossRef]
- Centobelli, P.; Cerchione, R.; Del Vecchio, P.; Oropallo, E.; Secundo, G. Blockchain technology for bridging trust, traceability and transparency in circular supply chain. Inf. Manag. 2022, 59, 103508. [Google Scholar] [CrossRef]
| Disclaimer/Publisher’s Note: The statements, opinions and data contained in all publications are solely those of the individual author(s) and contributor(s) and not of MDPI and/or the editor(s). MDPI and/or the editor(s) disclaim responsibility for any injury to people or property resulting from any ideas, methods, instructions or products referred to in the content. |
© 2024 by the authors. Licensee MDPI, Basel, Switzerland. This article is an open access article distributed under the terms and conditions of the Creative Commons Attribution (CC BY) license (https://creativecommons.org/licenses/by/4.0/).


