Abstract
This study introduces a system that merges AI with low-power IoT (Internet Of Things) technology to enhance environmental monitoring, with a specific focus on accurately predicting forest fires through time series analysis. Utilizing affordable sensors and wireless communication technologies like LoRa (Long Range), environmental data have been gathered. One of the key features of this approach is the comparison of the real-time local environmental data with meteorological service environmental data to ensure accuracy. This comparison informs a feedback loop that improves the model’s predictive accuracy. The research also delves into detailed time series analysis, incorporating the Autoregressive Integrated Moving Average (ARIMA) model to identify the best windows of opportunity for communication and to provide future forecasting. Finally, a decision tree model serves as the last step, providing a comprehensive assessment of fire risk due to its straightforward application and clarity. Validation of the fire detection component remains a critical future task to confirm its effectiveness and reliability.
1. Introduction
With the urgent need for enhanced environmental monitoring highlighted by the escalating threat of forest fires, this research emphasizes the important role of innovative technology, in addressing these challenges [1]. Leveraging IoT, specifically through LoRa technology, a the system collects critical environmental data, offering a comprehensive view of ecosystem health. High-quality data are crucial for accurate long-term predictive models. LoRa networks are used to relay sensor information from edge nodes to the cloud, supporting reliable communication while maintaining low power consumption. To minimize data loss, the system employs a communication protocol that transmits information when conditions are optimal or high-priority data are available [2]. This integration enables not just early fire detection but also advances in forecasting and anomaly detection in environmental time series, which is crucial for forecasting. By comparing sensor data with large weather forecast models, predictive analytics are refined, enhancing accuracy in detecting environmental disturbances and potential fire outbreaks. This approach, supported by machine learning and ARIMA models for data analysis, represents a multifaceted strategy towards environmental management, blending immediate fire detection objectives with broader monitoring goals for a sustainable future. Through the deployment of a sensor network capable of navigating the complexities of forest environments, the study navigates through data reliability challenges, ensuring robust predictions even under variable conditions.
2. Background and Related Work
Forest fires are a significant environmental concern worldwide, leading to immense ecological damage. The 2019 Amazon wildfires witnessed a dramatic increase in fires across Brazil, Bolivia, Paraguay, and Peru, with Brazil’s INPE (National Institute for Space Research) reporting a 77% rise to over 80,000 fires, including 40,000 in the Amazon. This led to 906,000 hectares of the Amazon biome being lost to fires [3]. In Europe, the situation was similarly alarming. As of August 10, 2021, Turkey, Greece, and Italy had seen extensive increases in the total area burned by fires larger than 30 hectares, far exceeding the 2008–2020 average. Turkey was particularly affected, with over 175,000 hectares burned compared to the historical average of nearly 39,000 hectares. Greece, Italy, and Spain also faced significant fire outbreaks, highlighting the severity and global scale of this growing threat. In Figure 1 and Figure 2, the number of wildfires recorded in Amazon between 2013 and 2019 [4] and the change in damaged areas between 2021 and the average of 2008–2020 in the highest wildfire risk European countries [5] were presented, respectively.
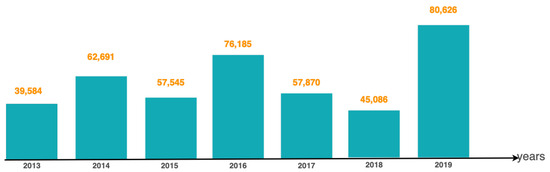
Figure 1.
Number of wildfires recorded in Amazon by year between months January and August in years 2013–2019.
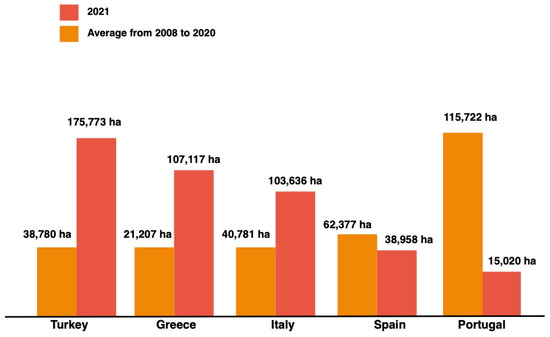
Figure 2.
Total area burned by fires larger than 30 hectares in European countries most at risk of wildfires.
These disasters highlighted the urgent need for improved fire management strategies, including advanced warning, early detection, and rapid response to protect communities and minimize damage. Extinguishing fires proves challenging due to various factors, including limited firefighter access to forested areas, the influence of wind on fire behavior, and delayed intervention from specialized firefighting teams. A potential solution lies in the timely detection of fire outbreaks facilitated by modern wireless systems. Today, the planet’s best surveillance system is artificial geostationary satellites, which instantly signal the outbreak of a fire. NASA’s satellite tools are often the first to detect fires that are burning in distant regions and new fire locations are sent directly to field managers around the world within a few hours of satellite travel [6]. However, despite these advancements, the devastation caused by wildfires underscores the inadequacy of current detection and response measures in effectively mitigating their impact.
This recognition of the limitations in current fire management strategies aligns with an increasing focus on environmental data acquisition. Enhanced monitoring efforts aim to provide a more comprehensive understanding of ecosystem health, track air quality, and leverage machine learning to improve forecasting models, incorporating ARIMA for effective analysis and prediction of environmental data trends. Such efforts are important because environmental conditions affect our daily lives, society, economy, and overall environment. Weather events affect approximately 33% of global GDP, underscoring the broad implications of environmental changes [7]. As shown in Figure 3, the proposed system presents a sensor technology to gather critical environmental data, offering insights into various ecological parameters beyond fire detection, such as temperature fluctuations, humidity levels, atmospheric pressure, etc. This system incorporates large weather forecast models to predict environmental conditions for specific locations by using an AI model.
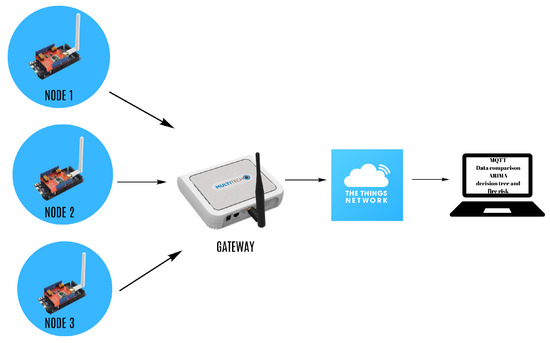
Figure 3.
Basic structure of fire detection system.
Complementing this approach, study [8] developed a cost-effective LoRa-based network system that similarly leverages environmental sensors to assess and visualize fire risk in real-time. Their field tests in rural areas demonstrate the system’s capability to provide expansive coverage, significantly contributing to IoT-driven environmental monitoring and forest fire detection.
Similar work [9] uses a LoRa wireless mesh topology to ensure reliable data transmission over large, remote areas typically lacking conventional network infrastructure. Their system installs multiple sensor nodes across forest terrains, capturing critical data points such as temperature, humidity, and smoke levels, which are crucial for early fire detection and situational awareness.
Building on recent advancements, this paper [10] utilizes artificial neural networks with key meteorological parameters like temperature, humidity, and wind speed to predict wildfires across various U.S. forest types. This relevant research showcases the model’s responsiveness to environmental fluctuations, enhancing the monitoring efficiency and timeliness for early preventative actions against fires. Such findings are crucial for improving predictive models. The alternative solution presented in this paper is utilizing LoRa (Long Range IoT) technology coupled with a BME280 sensor (BOSCH, Reutlingen, Germany) for data collection and machine learning algorithms for predictive analysis. By integrating a network of low-cost, high-efficiency sensors, this system is designed to provide a comprehensive view of the forest ecosystem, enabling not just early fire detection but also contributing valuable data for anomalies in environmental data time series enhancing forecasting capabilities. The methodology involves deploying LoRa Dragino sensor nodes in remote forest areas to gather environmental data, which is then transmitted to a central server via the LoRa Multitech gateway and The Things Network (TTN). Enhancements to this system include the ability to collect and analyze location-specific data, enabling targeted monitoring and predictive analysis of environmental conditions. By identifying anomalies in the data, such as sudden temperature spikes, humidity drops, particles in the air, CO2 or unusual patterns, the system can alert to potential fire outbreaks or environmental disturbances, offering a proactive approach to disaster prevention and environmental anomalies. Through the collection of comprehensive, location-specific environmental data and the identification of anomalies, this offers a forward-thinking solution to environmental monitoring and protection.
Additionally, the integration of ARIMA models for time series analysis enhances the predictive capabilities of the system, enabling more accurate forecasts and early detection of environmental anomalies. IoT, defined as a network of physical devices connected to the Internet and able to communicate with one another, is making inroads into various industries and markets. One of the applications is in the field of Smart Cities to monitor different variables such as traffic, pollution, and water systems [8]. To support the Internet of Things (IoT), recent developments in communication technologies have given rise to a Low-power Wide-area Network (LPWAN) [11]. LPWAN provides a wide range of communication, consumes a small amount of power, and proves to be very appropriate to applications requiring low data rates of transmission [2]. Among LPWAN technologies, LoRa stands out for enabling long-distance communication with low power consumption, ideal for environmental monitoring like forest fire detection. Sensors equipped with LoRa can gather a wide range of environmental data, including temperature, humidity, wind speed, and more from inaccessible areas. The integration of BME280 sensors across a network of nodes allows for the collection of detailed, real-time environmental data. These sensors, when deployed throughout a forest, can continuously monitor conditions of forest fire risk by sending these data to a central system for analysis, they enable real-time monitoring and early warning capabilities. The integration of ARIMA models into this system can further refine the analysis of environmental data.
The integration of ARIMA for time series analysis into this framework enhances the precision of detecting anomalies. ARIMA was chosen due to its simplicity and suitability for edge implementation, making it an efficient tool for accurate and real-time analysis. An ARIMA model is typically represented as (p, d, q), where p represents the number of auto-regressive terms, q indicates the number of moving average terms, and d signifies the number of differences required to achieve stationarity. The initial step in applying the ARIMA model involves identifying the time series. Utilizing an Augmented Dickey–Fuller unit-root test helps determine the stationarity of the dataset. If a unit root is present, the time series is deemed non-stationary. Additionally, insights into the lag structure can be obtained from examining the correlogram, autocorrelation function (ACF), and partial autocorrelation function (PACF) of the time series [12]. ARIMA’s capacity to model and forecast time series data allows it to predict future values based on past trends. Additionally, its ability to integrate differencing in the modeling process helps stabilize the mean of time series data, making it particularly useful for handling non-stationary data typically found in environmental monitoring [13]. Lastly, a decision tree-based machine learning algorithm is developed and evaluated for its effectiveness in predicting forest fires, offering an alternative approach to environmental monitoring. This model employs a hierarchical structure of decisions based on an extensive set of variables, including temperature, humidity, and other environmental factors. Refer to Figure 4 for a visual representation. The sequential application of the decision tree model exemplifies a strategic deployment of data mining techniques in our research. Data mining, an iterative process of extracting hidden patterns from large data sets and a critical component of the knowledge discovery process, consists of a collection of automated and semiautomated techniques for modeling relationships and uncovering hidden patterns in large data repositories [14]. This methodology, coupled with the classification of the datasets into risk levels such as high-risk and low-risk, underscores the comprehensive approach to forest fire prediction and management.
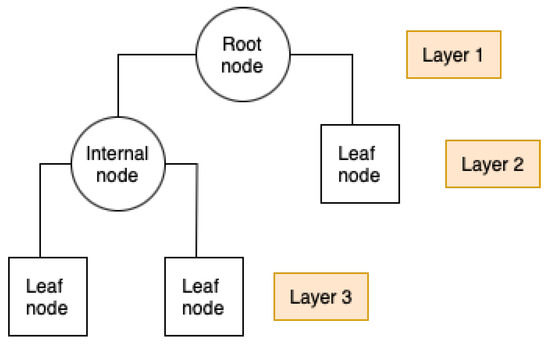
Figure 4.
Basic structure of a decision tree.
In conclusion, this study introduces a method that combines LoRa technology with machine learning to improve forest fire detection and environmental monitoring. By integrating a network of low-cost sensors with predictive analytics, this system can not only predict forest fires but also enhance environmental data collection and analysis. This approach allows for early detection of anomalies in environmental time series, leading to timely interventions against ecological threats like forest fires.
3. Efficient Detection of Fires through Low Power Environmental Data Monitoring and AI
An alternative system has been developed to detect forest fires at an early stage using low-power IoT technologies and artificial intelligence. The system integrates LoRa technology with BME280 sensors, which monitor crucial environmental parameters such as temperature, humidity, and air pressure. The collected data are processed and compared against regional weather patterns provided by Met Éireann to verify sensor accuracy and enhance predictive modeling. Moreover, the system incorporates ARIMA models for analyzing time series data. A decision tree-based machine learning algorithm enhances the accuracy of fire prediction by analyzing a comprehensive set of environmental factors alongside the provided datasets. The architecture of the system is provided in Figure 5.
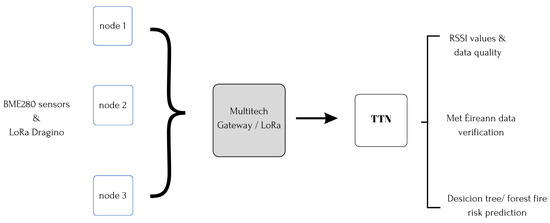
Figure 5.
Network architecture.
3.1. Environmental Monitoring for Forecasting
The methodology begins by strategically deploying sensor nodes across selected terrains. Each node is equipped with BME280 sensors to capture comprehensive environmental data. These nodes use LoRa technology for data transmission to The Things Network via a Multitech LoRa Gateway.
The base station collects and analyzes the data from these sensors through the Multitech Gateway, which then forwards the data package to The Things Network (TTN). From there, the data become available for further analysis via MQTT (Message Queue Telemetry Transport), a highly efficient messaging protocol that supports a broad spectrum of data applications and insights. MQTT is an extremely lightweight messaging protocol. MQTT has just 4 bytes of fixed header overhead and is the only IoT protocol that has QoS (Quality of Service) options up to 3 levels. The referenced study by Yoon et al. introduces a smart farm model integrating LoRa and MQTT technologies, aligning effectively with the established criteria for smart farms [15]. Once extracted, data are saved into a file to ensure traceability and future utility. The primary focus of this data analysis is on examining key environmental parameters such as temperature, humidity, time, air pressure, SNR (Signal-to-Noise Ratio), and RSSI (Received Signal Strength Indicator) values. Initially, data quality is assessed by analyzing RSSI values, which reflect the signal strength between sensors and the Gateway, as well as SNR values, which measure the quality of the signal itself. Optimal RSSI and SNR values are essential for ensuring the reliability and clarity of the data. By analyzing both RSSI and SNR values, high data transmission quality is maintained, potential degradation caused by physical obstructions is mitigated, and the conditions are set for initiating the second stage of data processing. These parameters might also have some correlation with the atmospheric and environmental data conditions, as described in Figure 6, for all validation step details.
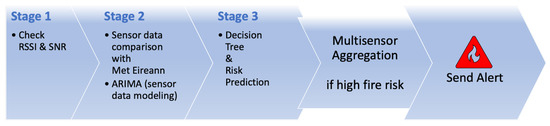
Figure 6.
Validation steps.
3.2. Time Series Analyses and Forecasting
In the second stage, the collected data are compared with Met Éireann’s weather data, which itself is sourced from the University College Cork Atmospheric Monitoring Station, approximately 1 km away from the testing point at University College Cork Electrical and the Electronic Engineering Building. This comparison helps validate and refine the accuracy of the measurements, supporting effective forecasting through time series analysis. This validation process ensures the reliability and consistency of the predictive models. The comparison not only confirms the precision of the collected data but also highlights the challenges faced during implementation. One such challenge arises from the difference in data frequency: Met Éireann provides hourly weather data, forecasting future values, whereas the base station sensor data are available on a minute basis. This discrepancy requires adjustments in data formatting to ensure accurate comparisons. When comparing on an hourly basis, it is necessary to fetch time data and align it with corresponding values. As the sensors provide data every minute, a practical solution involves aggregating these minute-level measurements by calculating the median. Additionally, the base station retrieves Met Éireann’s hourly weather data every 24 h, saving it for comparison. This dataset covers the subsequent 24 h forecast period, enabling a thorough comparison. Real-time data from the environmental sensors accumulate, with comparisons initiated every 60 s to continuously validate and refine the predictive models. Review Figure 7 for the real-time sensor data and Met Éireann’s weather data alignment graph. The differences between environmental forecasting and meteorological data are saved into a file for future analysis and for making better decisions regarding past events.
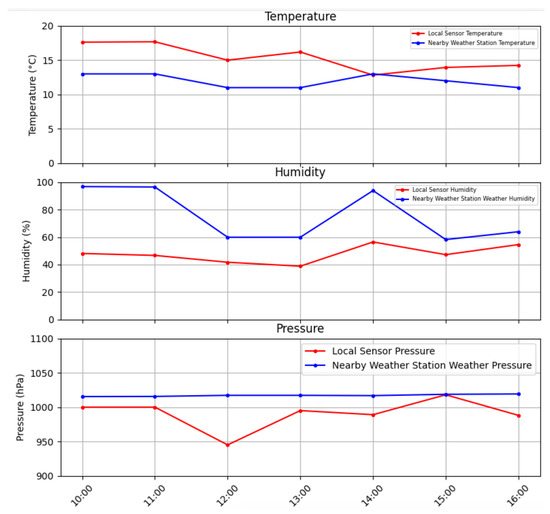
Figure 7.
Real-time sensor data and Met Éireann’s weather data alignment graph.
This effective environmental forecasting through time series analysis also includes another alternative model application: Autoregressive Integrated Moving Average (ARIMA) models. By evaluating the patterns observed in historical data, ARIMA models enhance the system’s capability to predict future environmental conditions. This is particularly evident in the analysis of humidity, temperature, and pressure. The graphs depicting the ARIMA model’s output reflect this predictive accuracy, where the predicted values are mapped along with a 95% confidence interval, derived from historical trends (solid blue line). The dashed blue line with markers represents the actual future values. The comparison highlights the alignment between the predicted and actual future data, validating the model’s accuracy. See Figure 8 and Figure 9 for details.
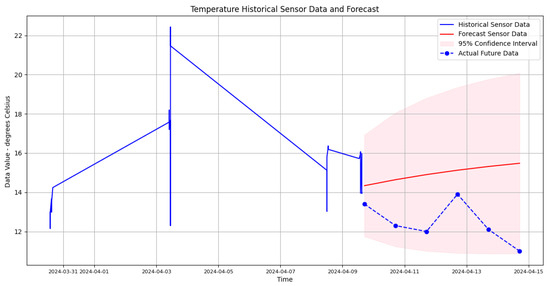
Figure 8.
Temperature data forecasting by ARIMA are shown with a solid red line representing predicted values and a pink shaded area showing the 95% confidence interval.
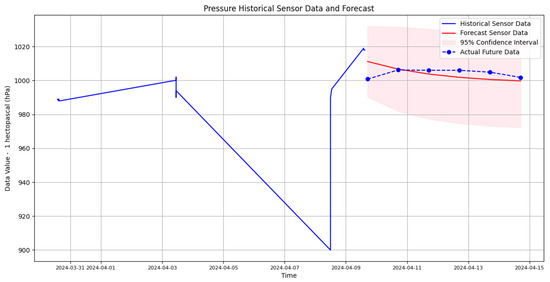
Figure 9.
Pressure data forecasting by ARIMA is shown with a solid red line representing predicted values and a pink shaded area showing the 95% confidence interval.
The Autocorrelation Function (ACF) graph, showing a decline after the initial peak, suggests that the model prioritizes recent data, indicating the dynamic nature of environmental patterns. The Partial Autocorrelation Function (PACF) underscores the importance of the most recent observations by displaying a significant spike at the first lag. This graphical interpretation feeds back into the system, ensuring that the accumulated real-time sensor data, compared every 60 s, is validated and refined through continuous ARIMA modeling. Graphical insights, paired with the iterative validation process, make the forecasting model stronger. See Figure 10 for details.
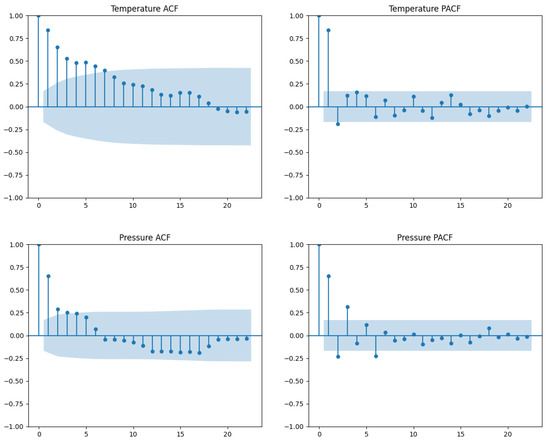
Figure 10.
(Top): the Autocorrelation Function (ACF) graph for temperature, showing a decline after the initial peak. (Bottom): the Autocorrelation Function (ACF) graph for pressure shows a decline after the initial peak, while the Partial Autocorrelation Function (PACF) shows a significant spike at the first lag.
3.3. Prediction with Decision Tree Algorithm
Following the validation steps, if an anomaly is detected in the time series, the forest fire prediction algorithm is activated. Referencing the Irish government’s forest fire warning system, which can be traced back to 2021, the decision tree algorithm utilizes both high-risk and low-risk datasets to assess fire threats [16]. Real-time environmental data from the base station are analyzed, determining the level of fire risk. Upon identifying potential threats, the system promptly issues alerts, enhancing the readiness and response to forest fires.
Referring to Table 1, a structured dataset designed for risk prediction analysis is presented. The table is divided into three main sections: “High-Risk Data”, “Low-Risk Data”, and “Real-Time Data”. Within each section, measurements for three essential environmental variables are recorded: temperature, humidity, and air pressure.

Table 1.
Risk prediction data.
These variables are important in assessing environmental conditions and are key factors in risk evaluation processes. Additionally, a target variable labeled “Target” is provided, indicating the predicted risk level based on the recorded environmental measurements. The entries in this column represent the outcomes of risk prediction, with “High” and “Low” denoting the respective risk categories. The structure of the table implies the utilization of a decision tree algorithm, suggesting a machine learning approach employed to classify instances based on the provided environmental features. This dataset serves as a valuable resource in informing risk management strategies and decision-making processes, particularly in contexts where environmental factors significantly impact risk assessment procedures.
4. Conclusions and Future Work
In this study, an integrated system combining low-power Internet of Things (IoT) technologies with artificial intelligence (AI) and advanced time series forecasting methods, specifically Autoregressive Integrated Moving Average (ARIMA) models, has been developed to predict the occurrence of forest fires with greater precision. The ARIMA models are particularly adept at handling and predicting based on the non-stationary time series data collected by the sensors, which significantly enhances the system’s predictive capabilities. The system uses both small and large models collaboratively to facilitate system evolution, with the ARIMA models determining the best times for data transmission. The presented results showcase the system’s ability to closely align sensor data with regional weather data from Met Éireann. The current deployment involves testing the sensor networks and performing validation steps, positioned approximately 1 km from the nearest Met Éireann weather station, providing a rich set of environmental data (see Figure 11). The proximity to Met Éireann’s data point enables the validation of sensor accuracy and the calibration of the system against established weather patterns, ensuring high reliability and performance of the system.
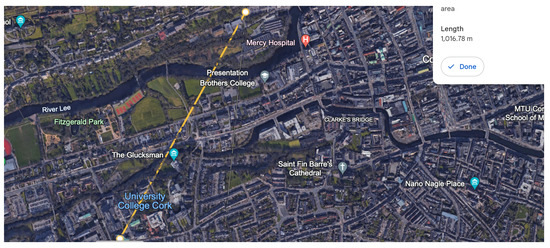
Figure 11.
The path between the UCC Atmospheric Monitoring Station and the UCC Electrical and Electronics Building [17].
Future work will aim to expand the dataset and refine the AI algorithms to enhance the predictive power of the system. The ongoing development and wider testing are expected to validate the system’s effectiveness in real-world settings across various forest environments. An important yet pending task is the validation of the fire detection component, which is essential to establish its reliability and efficiency in detecting fires. Additionally, the integration of satellite communications will be explored to augment coverage in areas lacking GSM connectivity, aiming to broaden the system’s applicability and ensure more inclusive environmental surveillance. This expansion is crucial for achieving comprehensive monitoring, particularly in remote and challenging regions, thereby enhancing the system’s capacity for early detection and management of forest fires. Furthermore, to enhance the system’s effectiveness, the communication protocol will be improved based on feedback and predictions from meteorological services.
Author Contributions
Conceptualization, İ.Ü. and E.P.; methodology, İ.Ü., E.P and P.L.; software, İ.Ü.; validation, İ.Ü., P.L. and E.P.; formal analysis, İ.Ü.; investigation, İ.Ü.; resources, E.P. and P.L.; data curation, İ.Ü.; writing—original draft preparation, İ.Ü.; writing—review and editing, P.L. and E.P.; visualization, İ.Ü.; supervision, E.P.; project administration, E.P.; funding acquisition, E.P. All authors have read and agreed to the published version of the manuscript.
Funding
This research received no external funding.
Institutional Review Board Statement
Not applicable.
Informed Consent Statement
Not applicable.
Data Availability Statement
Data supporting reported results can be made available upon reasonable request from the corresponding author.
Acknowledgments
The authors acknowledge Met Éireann for providing meteorological data that were crucial for this study and also express gratitude to Qualcomm for their financial support, which made this research possible.
Conflicts of Interest
The authors declare no conflicts of interest.
References
- Chew, Y.J.; Ooi, S.Y.; Pang, Y.H.; Wong, K.-S. A Review of Forest Fire Combating Efforts, Challenges and Future Directions in Peninsular Malaysia, Sabah, and Sarawak. Forests 2022, 13, 1405. [Google Scholar] [CrossRef]
- Calvert, S.; Popovici, E.; Leahy, P. Using Environmental Data-Based Communication Protocol for Improved Quality of Service in LoRaWAN Applications. In Proceedings of the 2021 32nd Irish Signals and Systems Conference (ISSC), Athlone, Ireland, 10–11 June 2021. [Google Scholar]
- Benzekri, W.; Moussati, A.E.; Moussaoui, O.; Berrajaa, M. Early Forest Fire Detection System using Wireless Sensor Network and Deep Learning. Int. J. Adv. Comput. Sci. Appl. (IJACSA) 2020, 11. [Google Scholar] [CrossRef]
- McCarthy, N. Record Number of Wildfires Burning in the Amazon. Statistica 2019. Available online: https://www.statista.com/chart/19089/number-of-wildfires-recorded-in-brazils-amazon-rainforest/ (accessed on 6 February 2024).
- Richter, F. Wildfires in Europe: Turkey, Greece and Italy Battle Historic Fires. Statistica 2021. Available online: https://www.statista.com/chart/25504/hectares-burned-in-wildfires-in-europe/ (accessed on 6 February 2024).
- Petrescu, R.V.; Aversa, R.; Abu-Lebdeh, T.; Apicella, A.; Petrescu, F.I. NASA satellites help us to quickly detect forest fires. Am. J. Eng. Appl. Sci. 2018, 11, 288–296. [Google Scholar] [CrossRef][Green Version]
- Himanshi, J.; Raksha, J. Big data in weather forecasting: Applications and challenges. In Proceedings of the International Conference on Big Data Analytics and Computational Intelligence, Chirala, India, 23–25 March 2017. [Google Scholar]
- Vega-Rodríguez, R.; Sendra, S.; Lloret, J.; Romero-Díaz, P.; Garcia-Navas, J.L. Low cost LoRa based network for forest fire detection. In Proceedings of the 2019 Sixth International Conference on Internet of Things: Systems, Management and Security, Granada, Spain, 22–25 October 2019; pp. 177–184. [Google Scholar]
- Adnan, A.; Salam, A.E.U.; Arifin, A.; Rizal, M. Forest Fire Detection using LoRa Wireless Mesh Topology. In Proceedings of the 2018 2nd East Indonesia Conference on Computer and Information Technology, Makassar, Indonesia, 6–7 November 2018; pp. 184–187. [Google Scholar]
- Sadatrazavi, A.; Motlagh, M.S.; Noorpoor, A.; Ehsani, A.H. Predicting Wildfires Occurrences Using Meteorological Parameters. Int. J. Environ. Res. 2022, 16, 106. [Google Scholar] [CrossRef]
- Ismail, D.; Rahman, M.; Saifullah, A. Low-power wide-area networks: Opportunities, challenges, and directions. In Proceedings of the Workshop Program of the 19th International Conference on Distributed Computing and Networking, Varanasi, India, 4–7 January 2018; pp. 1–6. [Google Scholar]
- Deya, B.; Roya, B.; Dattab, S.; Ustunc, T.S. Forecasting ethanol demand in India to meet future blending targets: A comparison of ARIMA and various regression models. In Proceedings of the 9th International Conference on Power and Energy Systems Engineering, Kyoto, Japan, 9–11 September 2022. [Google Scholar]
- Kale, M.P.; Mishra, A.; Pardeshi, S.; Ghosh, S.; Pai, D.S.; Roy, P.S. Forecasting wildfires in major forest types of India. Front. For. Glob. Chang. 2022, 5, 882685. [Google Scholar] [CrossRef]
- Maksimović, M.; Vujović, V. Comparative analysis of data mining techniques applied to wireless sensor network data for fire detection. J. Inf. Technol. Appl.-APEIRON 2013, 6. [Google Scholar] [CrossRef]
- Yoon, H.W.; Weon, C.; Kim, D.J.; Smith, A.; Lee, M. L&M Farm: A Smart Farm based on LoRa & MQTT. In Proceedings of the 2020 International Conference on Omni-layer Intelligent Systems (COINS), Barcelona, Spain, 31 August–2 September 2020. [Google Scholar]
- Fire Management. Available online: https://www.gov.ie/en/publication/01773-fire-management/ (accessed on 10 April 2024).
- Google Earth. Available online: https://earth.google.com/ (accessed on 10 May 2024).


Disclaimer/Publisher’s Note: The statements, opinions and data contained in all publications are solely those of the individual author(s) and contributor(s) and not of MDPI and/or the editor(s). MDPI and/or the editor(s) disclaim responsibility for any injury to people or property resulting from any ideas, methods, instructions or products referred to in the content. |
© 2024 by the authors. Licensee MDPI, Basel, Switzerland. This article is an open access article distributed under the terms and conditions of the Creative Commons Attribution (CC BY) license (https://creativecommons.org/licenses/by/4.0/).