Abstract
The applications of image classification are useful, especially in the prediction of object categories at a high accuracy rate. The technique helps industrial designers classify the existing products by product appearance and assess the extent to which newly designed products belong to their brand or product family. By doing this, designers classify products by typicality. Yet, the application of image classification of products and brand styles based on typicality is still limited. Thus, we presented a case study in which the extent to which a chair was recognized as a typical Apple product was predicted. In the technique, Waikato Environment for Knowledge Analysis (WEKA) was used. The results show that the industrial designer can use product typicality for the image classification of products to manage the style of a brand and its products.
1. Introduction
Deep learning (DL) is a method of artificial intelligence (AI) used to process data in a brain-inspired way. The DL model identifies complex patterns in pictures, words, sounds, and other means for more accurate insights and predictions. At present, many applications of the DL model to industrial design concern data analysis and the integration of production information. However, few applications of image classification with deep learning in industrial design have been found at present.
Product development needs to design new products according to the brand strategy with new product appearances from the market demands, retaining the brand style elements. The products of Apple, in the past ten years, have maintained their unique style and thus established stable customer loyalty with innovative shapes and materials in different products. One of the most critical tasks of industrial design is to create novel products with the design elements of the original brand, as this is beneficial to judge the brand degree of products. Analysis of brand characteristics refers to finding consistent design characteristics and enabling the brand to be more stable in the market. However, with time, the epidemic factors and aesthetic preferences of different periods change rapidly. Therefore, regular data collection and analysis are needed to ensure the accuracy of the time effectiveness.
A complete product design needs to show a brand-friendly style in response to a variety of styling changes. Unique styling features enhance the product’s recognizability and the loyalty of consumers. Product styling is the most direct way to attract consumers and the motivation for consumers to purchase. Based on the aesthetics of the product with appropriate novelty in appearance, the highest level of design can be achieved. Typicality and novelty are the key elements of the aesthetic design of a product in a brand [1]. The brand typicality presents a distinct difference between competitors [2]. Product differentiation is the key to the rise and fall of a brand. The visual typicality of a brand is used to express its goals and core values. We used the image classification of DL by training the prediction model according to the typicality of brand style as the classification benchmark, taking the Apple brand as the experimental object. The detrended fluctuation analysis (DFA) method was used to capture the brand features, apply the features to different types of products, and predict the brand style typicality.
Designers rely on their aesthetics and experience to design products, more or less with the subjective consciousness of miscellaneous designers to choose product directions. It is difficult to objectively verify whether its design direction conforms to the development direction proposed earlier. Using machine DL, we applied the product appearance of industrial design to a new application and explored brand typicality of product shape to create new product design strategies and improve design capability.
2. Related Work
2.1. Important Influence Elements of Product Appearance and Brand Style
A solid brand image improves brand value, identity, and brand characteristics in the market and encourages the interaction between brands and consumers. Therefore, brand style plays a vital role in the development of companies [3]. A design characteristic reflects the brand’s essence, so design features need to explicitly and implicitly be embedded in product design so that customers can perceive and recognize the features [4]. Brand image is closely linked with product style and the typical DNA of brand style, shown in product design. Brand image intuitively affects consumers and brand awareness. Thus, it is necessary to study the typicality of products and brand styles in the industrial design of aesthetic concepts and styles [1,2,5]. Companies must also retain their brand style to meet the market trend and improve product development. Therefore, by adjusting the value between style typicality and novelty, the development of a new product design is conducted. Based on these, the concept of typicality is used as the criterion for the classification of brands and to predict the brand style in products’ appearance.
2.2. Image Classification with DL
DL is a cutting-edge technique that has gained popularity for its ability to handle traditional computer images. This is because DL automatically learns valuable features for a specific task and eliminates the need for manual feature selection. The convolutional neural network (CNN), a type of DL architecture, can be used for product design using the mammalian visual system. It is commonly used for image recognition and segmentation due to its ability to consider the relationship between nearby pixels [6]. CNN layers are classified into convolutional, pooling, and fully connected layers. Waikato Environment for Knowledge Analysis (WEKA) is a collection of machine learning (ML) algorithms for data mining that is efficient and powerful and does not require separate coding. It contains tools for data preparation, classification, regression, clustering, association rule mining, and visualization.
In this study, WEKA was used to allow for the application of image classification of DL without coding. Texture and line make product appearance obvious and characteristic. Hence, image classification with DL was used to identify the features with specificity as the criterion of product brand classification for training a prediction model.
2.3. Apple Chair
Girelli Studio, an industrial product design company, designs products for companies venturing into the world of furniture. They designed a chair considering the concept of Apple AirPods Max as the style of Apple’s brand. This example represents style typicality. No matter the shape or size of the product’s appearance, as long as the design shows the style characteristics, it maintains style consistency. Image classification with DL is used to predict brand styles by training a model on a dataset of images of products associated with brand styles. Once the model is trained, it is used to predict the appearance of a new product based on its image. DL is used to improve the productivity of designing products. Therefore, we used image classification with DL without coding so that all designers could learn and use it.
There were many published research results [7,8,9] showing examples of industrial design [10]. However, most of the DL studies showed industrial process development with data mining and data-driven design. However, there were not many studies on product appearance and design style [11,12]. Therefore, the relationship between ML and product appearance design was determined to enable a closer connection between product design and technology. In this study, we specified the typicality of products of a certain brand for training models to predict the product brand, demonstrated the image classification process of using WEKA for no-code designers, and summarized the opportunities to apply ML technology to product design and development.
3. Methods
Chairs were selected to predict the style, and the brand, Apple was used for analyzing the brand product style and design. This study was conducted in two stages. In the first stage, an appropriate brand-style training set was selected, and its features were quantified using WEKA’s image filter. Model training was carried out for classification, and the parameters were adjusted to obtain the most efficient model sample. In the second stage, the known brand styles were used to redesign products in different categories, and the accuracy of the classification model was evaluated for the redesigned samples.
3.1. DFA to Extract Features
DFA was developed by Warell (2001) to explore design features in various products and explicit design clues for visual recognition [2]. In this study, the features of the product style of Apple were determined using DFA. The results showed that the product design features included rounded corners, symmetry, and simplicity. After obtaining the features, 150 training sets, including pictures of Apple products, were used to train the model for typical, novel, and non-Apple style features. WEKA ImageFilter was used to learn Apple brand product features in the model. After training, two senior designers selected 10 Apple brand-specific chairs based on rounded corners, symmetry, and simplicity and blended 20 non-Apple-style chairs into the test set.
3.2. Labeling Characteristics of Brand Style
The supervised ML method was used to train the model using the image label. The classification model was trained for WEKA classification, and the dominance of the brand style features in the image was rated according to the image level. According to the features of Apple’s brand style [2], rounded outline, simplicity, and symmetry were chosen as the three most dominant adjectives. We collected 32 groups of pictures of Apple products from 2018 to 2022 (Figure 1 and Figure 2). The product pictures were labeled using the three adjectives. The rules of extraction are shown in Figure 3, Figure 4 and Figure 5. Pictures labeled for the three adjectives were considered with typical Apple brand styles. Pictures for two adjectives were considered novel Apple brand styles. Pictures for one adjective were considered non-Apple style. A total of 150 images with the features of Apple products were collected in the training set.
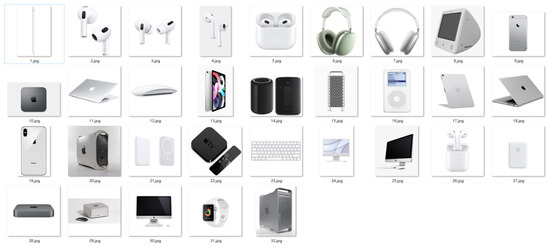
Figure 1.
Apple product images.
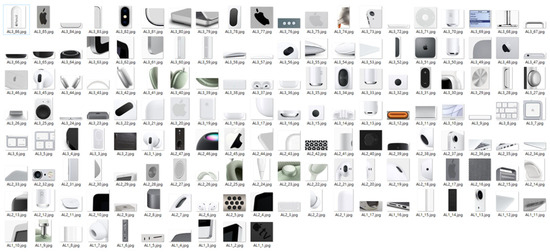
Figure 2.
Feature set of Apple products.
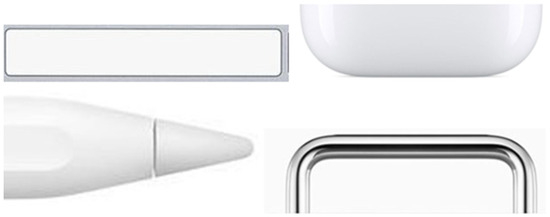
Figure 3.
Typical brand style (rounded, symmetrical, and simple).
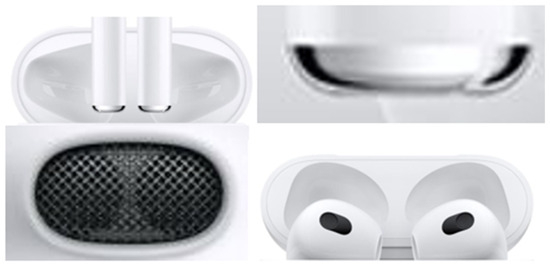
Figure 4.
Novel brand style (rounded and symmetrical).
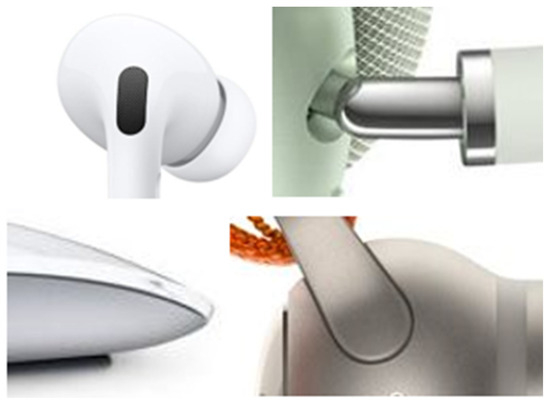
Figure 5.
Non-Apple style (rounded corners).
3.3. Model Accuracy
In this study, the rule for selecting chairs in the test set was Apple brand features. The test set consisted of 30 chairs, with 10 chairs having brand styles and the remaining 20 chairs having non-brand styles (Figure 6 and Figure 7). The previous classification model was used to evaluate the accuracy of the model.
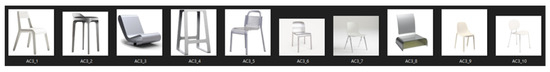
Figure 6.
Chairs with brand style (10 pics).
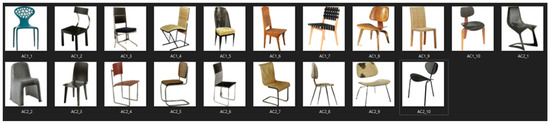
Figure 7.
Chairs with non-Apple brand style (20 pics).
4. Results
4.1. Feature Extraction
An image filter was used to quantify image features, including geometric, frame, color, shape, histogram, and local binary pattern features. We used DFA to define brand features. The number of texture features was more than the number of color features. Thus, we used the texture image filter of WEKA and assigned features in a feature map to compare the performance to select the best prediction model. The texture filters available in WEKA included the PHOG-Filter, BinaryPatternsPyramid-Filter, EdgeHistogram-Filter, Gabor-Filter, and FCTH-Filter. The image training results showed that the PHOG-Filter, BinaryPatternsPyramid-Filter, and EdgeHistogram-Filter showed an accuracy of 100% in prediction after training with the training set. The FCTH filter with color and texture showed an accuracy of 86.333%. However, the Gabor-Filter performed the worst, with an accuracy of 43.333% (Table 1).

Table 1.
Model accuracy using different image filters.
Most of the filters using texture units in feature extraction showed high accuracies. Thus, these filters were efficient in color extraction because they used the product edge lines of each image to convert them into quantified values. The PHOG-Filter is based on HOG values. In extraction, the image was considered colorless. The number and location of edge gradient directions were calculated so that features could be closely related to location. The process was performed on local cell units of the image to keep invariance to the geometric and optical deformation of the image. The BinaryPatternsPyramid-Filter was similar to the PHOG-Filter. In feature extraction, it divided image pixels into 16 × 16 cell units to compare them with those in the surrounding 8 units and save them as binary values. After normalizing the histogram, the quantified image feature was obtained. The EdgeHistogram-Filter extracts the features of MPEG7 edge histograms from images. The edges are generated according to color opposition or discontinuity. The Gabor-Filter is based on the Gabor wavelet transform texture value and analyzes specific frequency content in a particular direction in a local area around a point or area in an image. The FCTH-filter uses color and texture values to retrieve blurry color and texture features from images and unify color and histogram features in the highest 72-tuple pixels.
The least expected texture filter was the Gabor-Filter. Because the Gabor filter was similar to the filter of the human visual system, it could not perform the expected classification, and its accuracy was 43.333%. The other texture filters were effective in extracting quantified data for product features. Filters not based on histogram features were not efficient in the extraction.
4.2. Feature Extraction of Image Filters
According to the test results in this study, the classification model to predict the brand style was trained by ML and was used by designers. The application was conducted in three phases: image data collection, quantitative image collection, and classification and image prediction. In phase 1, designers collected products with style and appearance. In addition, DFA was used to define characteristic adjectives. In this phase, designers paid attention to the hierarchical arrangement of adjectives to define an appropriate number of adjectives. In phase 2, the adjectives in the previous phase were used to capture the product images in the image set, label brand typicality, and input the image into WEKA to filter the features. The user determined the product details in the feature in this phase by dividing the image into grade intervals. In this phase, attention had to be paid to selecting the characteristics of the image set to select appropriate filters. In phase 3, the features were input into the classification for the classification model, and the target design product was input into the test set to predict the typicality of the product style. The designer could modify the features. The classification model’s performance depended on the adjustment of parameters and classification methods, and the accuracy in the prediction of the model was improved by adding training sets and cross-validation.
5. Conclusions
We introduced ML to use the product appearance to capture features and predict the target style after constructing the classification model. As a result, the method of the feature extraction of product style sand labeling rules for ML was established to guide and adjust models in a human–machine interface. The design process can be taught to students. The result of this study confirmed that DL could be applied to product development, and designers could use ML methods to modify product features according to brand typicality and optimize the design process. Many image filters and methods performed well in extracting the features from product images and training classification models. It is recommended to use more images with different angles, lightness, and positions to obtain better performance in the model.
Author Contributions
Conceptualization, H.-H.W.; methodology, H.-H.W.; resources, Y.-Y.L. and H.-T.H.; Data curation, Y.-Y.L. and H.-T.H.; validation, H.-H.W.; writing—original draft preparation, Y.-Y.L. and H.-T.H.; writing—review and editing, H.-H.W.; experiments conducted, Y.-Y.L. and H.-T.H.; supervision, H.-H.W. All authors have read and agreed to the published version of the manuscript.
Funding
This research was funded by NSTC, Taiwan, R.O.C., via grant 111-2410-H-027-019-MY2.
Institutional Review Board Statement
Not applicable.
Informed Consent Statement
Not applicable.
Data Availability Statement
Data are unavailable due to privacy reasons.
Acknowledgments
The authors gratefully acknowledge the financial support of NSTC, Taiwan, R.O.C., via grant 111-2410-H-027-019-MY2.
Conflicts of Interest
The authors declare no conflict of interest.
References
- Hung, W.-K.; Chen, L.-L. Effects of novelty and its dimensions on aesthetic preference in product design. Int. J. Des. 2012, 6, 81–90. [Google Scholar]
- Karjalainen, T.-M. It looks like a Toyota: Educational approaches to designing for visual brand recognition. Int. J. Des. 2007, 1, 67–81. [Google Scholar]
- Wang, H.; Chen, J.; Hu, Y.; Ye, M. The consistency of product design and brand image. In Proceedings of the 2008 9th International Conference on Computer-Aided Industrial Design and Conceptual Design, Beijing, China, 22–25 November 2008; IEEE: Piscatawa, NJ, USA, 2008; pp. 1142–1144. [Google Scholar]
- Andersson, T.; Warell, A.; Holmlid, S. Product gist: An approach to identifying form characteristics of the current product sign. In Proceedings of the Conference: Crafting the Future 2013, the 10th European Academy of design Conference, Gothenburg, Sweden, 17–19 April 2013. [Google Scholar]
- Mayer, S.; Landwehr, J.R. Measuring design typicality–A comparison of objective and subjective approaches. In Proceedings of the Future Focused Thinking—DRS International Conference, Brighton, UK, 27–30 June 2016. [Google Scholar]
- Yang, X.; Ye, Y.; Li, X.; Lau, R.Y.; Zhang, X.; Huang, X. Hyperspectral image classification with DL models. IEEE Trans. Geosci. Remote Sens. 2018, 56, 5408–5423. [Google Scholar] [CrossRef]
- Yang, M.; Kumar, P.; Bhola, J.; Shabaz, M. Development of image recognition software based on artificial intelligence algorithm for the efficient sorting of apple fruit. Int. J. Syst. Assur. Eng. Manag. 2021, 13, 322–330. [Google Scholar] [CrossRef]
- Hebbale, S.; Marndi, A.; Achyutha, P.N.; Manjula, G.; Mohan, B.; Jagadeesh, B. Automated medical image classification using DL. Int. J. Health Sci. 2022, 6, 1650–1667. [Google Scholar]
- Zhou, J.; Li, Z.; Zhi, W.; Liang, B.; Moses, D.; Dawes, L. Using convolutional neural networks and transfer learning for bone age classification. In Proceedings of the 2017 International Conference on Digital Image Computing: Techniques and Applications (DICTA), Sydney, Australia, 29 November–1 December 2017; IEEE: Piscatawa, NJ, USA, 2017. [Google Scholar]
- Bae, J.K.; Kim, J. Product development with data mining techniques: A case on design of digital camera. Expert Syst. Appl. 2011, 38, 9274–9280. [Google Scholar] [CrossRef]
- Kim, J.; Lee, J.-K. Stochastic detection of interior design styles using a deep-learning model for reference images. Appl. Sci. 2020, 10, 7299. [Google Scholar] [CrossRef]
- Wang, H.-H.; Chen, C.-P. Using t-SNE to Evaluate the Brand Style of New Mice Design. In Proceedings of the 2022 IEEE International Conference on Consumer Electronics-Taiwan, Taipei, Taiwan, 6–8 July 2022; IEEE: Piscatawa, NJ, USA, 2022. [Google Scholar]
Disclaimer/Publisher’s Note: The statements, opinions and data contained in all publications are solely those of the individual author(s) and contributor(s) and not of MDPI and/or the editor(s). MDPI and/or the editor(s) disclaim responsibility for any injury to people or property resulting from any ideas, methods, instructions or products referred to in the content. |
© 2023 by the authors. Licensee MDPI, Basel, Switzerland. This article is an open access article distributed under the terms and conditions of the Creative Commons Attribution (CC BY) license (https://creativecommons.org/licenses/by/4.0/).