Abstract
The globalization process and the war in Ukraine show us that migration is one of the strongest global trends in the modern economy. For this paper, we determined three types of migration, depending on the intention of the people involved, these being labor, educational, and refugee migration. Each type has a different influence on the macroeconomic process. However, in this paper, we investigate the influence of general migration on GDP. We analyze five factors that have major influences on GDP, namely, migration (I), interest rate (IR), active population (AP), export (E), and the consumer price index (CPI). For the purposes of this paper, vector autoregressive models (VAR models) were chosen to perform the analysis. We used the Granger causality test to investigate the lag structure and identified the exogenous variables in the VAR model, such as GDP, migration, and the active population. We investigated the cross-influence between these factors and found that migration has a negative effect on the active population and a positive effect on GDP, while GDP growth leads to a decrease in migration. The Akaike and Schwartz criteria showed the high quality of the VAR models. The impulse analysis of shock influences identifies the structure of the reaction seen in GDP and migration, depending on their shock factors. Using decomposition analysis, we found that migration and GDP influence each other by 10–14%, which can improve the forecasting of these factors and the study of structural migration by the use of these three types.
1. Introduction to the Migration Process
1.1. Analysis of References to the Current Migration Processes in Europe and the Impact of Migration on GDP
The end of the 20th and the beginning of the 21st century are characterized by the significant transformation of the international market space, which can be recognized by its effects of globalization and integration. The world market has a key influence on the processes that take place in national markets. It defines the competitive space factors within which national enterprises operate. The openness of national markets, in turn, significantly changes the quality of migration processes. Under these open conditions, workers looking for better employment conditions outside national enterprises can move with few or no problems, in search of better countries in which to work. The quality of educational migration also changes significantly when students endeavor to find the best combination of cost and standard of education for their needs. These processes were quite transparent in the European countries, where the creation of the European Union resulted in new conditions for the various types of migration, in order to benefit both the population and the EU member states. However, the military conflict between Russia and Ukraine in 2022 brought a new round of forced migration to pass, which has made its own adjustments to all types of migration.
Millions of Ukrainians, mostly women, were forced to leave their country and migrate to EU countries with their families, bringing with them children who study not only in primary and elementary schools but also in universities. This assumes an a priori increase in labor migration by the educated population and educational migration. In addition, according to the estimates made by the Ptoukha Institute for Demography and Social Studies of the National Academy of Sciences of Ukraine [1], from the two largest educational centers of Ukraine alone, Kyiv and Kharkiv, 70% of women with higher education qualifications left Ukraine for the European Union.
According to Josep Borrell, the High Representative of the European Union for Foreign Affairs and Security Policy, and Vice-President of the European Commission, migration is currently being discussed in Europe, primarily as a challenge. At the end of 2022, according to Frontex, the number of migrants arriving in Europe via the Central Mediterranean or Western Balkan routes had increased again in 2022 by 51% and 136%, respectively [2].
In particular, Russia’s war against Ukraine, which began in February 2022, triggered the largest displacement of people seen in Europe since World War II, while only 4 million Ukrainians received temporary protection [3]. According to the Frontex-European Border and Coast Guard Agency, in 2022, about 15 million Ukrainians came to Europe, of whom 4 million Ukrainians received temporary protection and approximately 3 million wished to remain in the European Union [3]. That is, one-fifth of the people who have completed higher education, as well as those receiving higher education in the future, will contribute to an increase in the GDP of the host country. In this regard, the task of determining the impact on the GDP of individual factors, including the migration component, is of interest.
This research is aimed at developing tools for assessing and modeling the impact of socioeconomic factors on the country’s GDP.
A study assessing and identifying the impact made on the volume of GDP by various socio-economic factors showed that modern authors distinguish the following as the dominant factors [4,5,6,7,8,9]: migration (I), interest rate (IR), active population (AP), export (E), and the consumer price index (CPI). Based on the hypothesis that these factors have both a direct and a lag effect on the volume of GDP, this paper proposes to use vector autoregressive models to assess the various impacts.
1.2. Literature Review
Gross domestic product (GDP) is one of the determinants of a country’s economic growth. This is why the task of studying the factors that have a diverse influence on its change is always relevant. The need for constant study of such factors is also explained by the fact that this task is permanent. This means that any change of situation in both the world and the national markets, which are associated with the evolution of the development of the economy and society, changes the degree of influence of these socioeconomic factors on the country’s GDP.
One of the factors that is gaining more and more influence on each country’s GDP is migration. The impact of the migration process on a country’s GDP has long been the focus of international research. Thus, a report by the United Nations Development Program (UNDP), published on 21 October 2020 and named “Refugees and Migrants”, analyzed the main trends in the field of migration [10]. The UNDP chief, Achim Steiner, emphasized the fact that migrants play an important role in economic recovery, especially after a crisis: although constituting only 3.5 percent of the world’s population, according to data from 2015, migrants produce 9 percent of global GDP. According to studies by the International Monetary Fund and the World Bank, an increase of 3 percent of immigrants in developed countries would increase their global GDP by USD 356 billion by 2025.
The influence of migration on the main macroeconomic indicators of the development of countries has been studied by many authors. For example, Heinisch, K., and Wohlrabe, K., (2016) emphasize the power of migration’s impact on macroeconomic indicators, showing that it is necessary to analyze the structure of the economically active population in terms of particular refugees with different levels of education [11].
Kudaeva, M., and Redozubov, I. (2021) prove that there is a strong relationship between GDP and migration. Thus, based on an analysis of the impulse responses of the SVAR model, it was determined that a 1% shock to the migration process increases the real GDP by 0.1% [12].
The works of many authors are devoted to the analysis and assessment of the influence of various socio-economic factors on changes in GDP.
For example, Zhuravskaya, K.G. (2016) analyzes the impact of the M2 monetary aggregate, international reserves, consumer price inflation, domestic lending to the private sector by banks, the general tax rate, the discount rate, the population, the dollar exchange rate in the national currency, and the market capitalization of companies where their shares are listed on the stock exchange on the GDP of countries with varying levels of economic development [13]. On the basis of the author’s studies, the factors and the strength of their influence on the level of GDP were analyzed, and cross-country differences in the process of GDP formation were identified.
Alex Reuben Kira (2013), working against the background of a study of the dynamics of change in Tanzania’s GDP and by using a Keynesian model, shows a significant impact on this macroeconomic indicator of consumption, namely, the government’s final expenditure and household final expenditure, along with exports [14].
Hongbo Guo and Zewei Zhang (2022) identify the main factors influencing GDP, comprising: gross saving; the consumer price index; unemployment; population and the real interest rate [15]. Based on the results of their regression analysis, the authors prove the existence of a significant influence of exogenous factors on GDP and emphasize the need to develop an appropriate state policy that will maintain the stability of the development of these factors.
Artur Ribaj and Fitim Mexhuani (2021) also prove the existence of a strong correlation between GDP and the gross saving factor. Based on augmented Dickey–Fuller tests, Johansen cointegration tests, and the Granger causality test, the authors determined that saving stimulates investment, production, and employment, which leads to overall economic growth [16].
Based on a study of a period of economic liberalization in Ghana, Emmanuel Nketiah, Xiang Cai, Mavis Adjei, and Bekoe Bernard Boamah (2020) proved the existence of a close relationship between foreign direct investment, trade openness, and GDP [17].
1.3. Three Types of Migration
Analysis of the migration process and of the literary sources [18,19,20] can help us to identify three types of migration, depending on their impact on the national economy:
- (i)
- Labor migration;
- (ii)
- Educational migration;
- (iii)
- Refugee migration.
Each type of migration has its own impact on GDP. The first type receives GDP in the machine-building branches of the economy, while the second type affects scientific and technological areas of the economy; the third type results in pressure on the economy regarding social support for refugees.
2. Mathematical Tools for Studying the Impact of Migration on GDP
2.1. Methodological Aspects of Model-Building
For this paper, we studied the process of the impact of migration on GDP from the point of view of system analysis. In this regard, we propose the following algorithm for studying the impact of the migration process on GDP (see Figure 1).
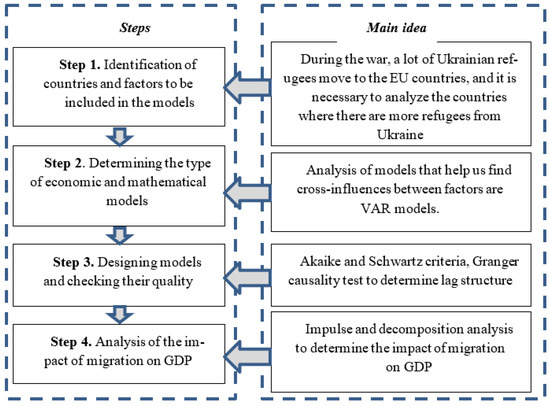
Figure 1.
Algorithm for studying the impact of migration on GDP.
2.2. Mathematical Models of Migration’s Influence on GDP
Migration has a lag influence on numerous economic processes that is based on the nature of migration. In this case, we used vector auto-regression models (VAR models) to perform the analysis, as follows:
- (i)
- General VAR model and determination of the migration impact lag structure.
The general VAR (p) model, with n variables, is represented by:
where n is the number of variables; p is the optimal lag of the VAR model.
X1,t = a10 + a11X1,t−1 + ... + a1pX1,t−p + ... + b1pXn,t−p
X2,t = a20 + a21X1,t−1 + ... + a2pX1,t−p + ... + b2pXn,t−p
…
Xn,t = an0 + an1X1,t−1 + ... + anpX1,t−p + ... + bnpXn,t−p
- (ii)
- Estimation of the lag’s influence in the VAR model. Generally, two main criteria exist for the determination of the lag’s influence; these are the Akaike criteria and the Schwarz criteria. We also used a Granger causality test for determining the lag structure.
- (iii)
- Impact impulse analysis. We used momentum analysis to determine the percentage impact of each factor on GDP. Decomposition analysis will help us to determine the part of the variance that depends on the changing pattern of the exogenous factors.
3. Model Design and Impact
3.1. Estimation of the Model’s Parameters
The model was calculated on data from the Polish economy. This choice is due to the fact that Poland is considered the most attractive country for relocation in the European Union by Ukrainian migrants, which finding is based on a retrospective analysis of the data for 1990–2021 [21,22,23,24]. In addition, during the recent period of Russian aggression in Ukraine, Poland received about 6 million Ukrainian refugees. In our study, we assessed the following factors:
GDP per capita (current rate in USD) is the gross domestic product, divided by the midyear population—variable “GDP”;
Exports as the capacity to import (constant LCU) equals the current price value of the export of goods and services deflated by the import price index – variable “E”;
Net migration (quantity of persons) represents the net total of migrants during a particular period, calculated as the number of immigrants minus the number of emigrants, including both citizens and noncitizens—variable “I”;
Interest rate (%)—variable “IR”;
Population aged 15–64 (total)—variable “AP”;
Consumer price index (%)—variable “CPI”.
To conduct the analysis, we first investigated the stationary value of the time series using the ADF test. The results are shown in Table 1.

Table 1.
ADF test of the time series.
We used the first differences to calculate the ADF test. The test showed us that the first time series differences are stationary; thus, we could use this characteristic in the construction of the VAR models.
In our study, we adopted the hypothesis that five factors influence GDP. To explore this hypothesis regarding exogenous and endogenous factors, the Granger causality test is used in the model. The results are presented in Table 2.
Table 2.
Exogenous and endogenous factors in the model.
The data in Table 2 show that three variables are likely to be exogenous in the model. These are GDP, migration, and the active population. Hence, we recalculated the VAR models. The resulting parameters of the VAR model are presented in Table 3.
Table 3.
The parameters of the VAR model.
The model’s parameters were calculated using the Eviews program.
Measuring the quality of the model shows us that the VAR(2) model is of high quality. These models show the cross-influences between GDP, migration, and the active population. The influence graph is shown in Figure 2.
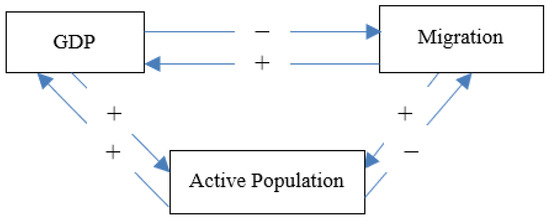
Figure 2.
Cross-influences between GDP, migration, and the active population.
Figure 2 demonstrates that migration negatively affects the active population and positively affects GDP, while GDP growth leads to a decrease in migration.
3.2. Impact of the Models
For our analysis of the impact of the models, we used impulse and decomposition analysis techniques. The impulse response function is an important tool for conducting sensitivity analysis of the VAR indicators model regarding the action of external shocks. Figure 3 shows an impulse analysis of the model indicators on GDP and migration.
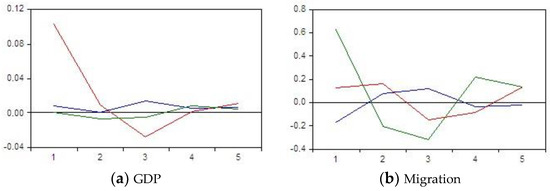
Figure 3.
Impulse analysis of GDP and migration.
Figure 3 shows that after four years, migration shocks will trigger a change in GDP to the same extent as GDP shocks. Conversely, a GDP shock has a direct impact on the migration process. That is, if daily life in a particular country worsens, then migration will increase.
The second analysis tool used in this paper is decomposition analysis, as presented in Table 4.
Table 4.
Variance decomposition of migration and GDP.
An analysis of the results that were obtained allows us to conclude that migration has a 10% impact on GDP. Thus, migration has a very significant impact. During all economic periods, this impact is stable. However, GDP only begins to influence migration in the second year, which indicates that the population does not immediately respond to the deterioration of the economy in a particular country. This finding is associated with the process of adaptation by the population in the economic space of Poland and covers all the above types of migration. In general, the impact of GDP on migration is about 11–14%.
It should also be added that since the influence of migration and GDP are of almost equal degree to each other, an interesting chain reaction will be observed. Migration into the country leads to an increase in GDP, while an increase in GDP leads to a decrease in migration out of the country.
4. Conclusions and Future Prospects
The following results were obtained in the current work:
- (i)
- The migration process is a complex scenario consisting of three components (labor migration, educational migration, and refugee migration) that have a cumulative impact on GDP and can change the structure of the country’s economically active population.
- (ii)
- We have built VAR models that characterize the impact of the following indicators on GDP: migration (I), interest rate (IR), active population (AP), exports (E), and the consumer price index (CPI). The Granger causality test made it possible to find such exogenous factors as GDP, migration, and the active population. This test also shows us that migration negatively affects the active population and positively affects GDP, while GDP growth leads to a decrease in migration.
- (iii)
- Impulse and decomposition analyses show that migration and GDP have cross-influences of about 10% and 14%. Migration has the most significant and stable impact on GDP. In addition, the population does not immediately respond to the deterioration of the economy in the country, and migration begins to increase with a decrease in GDP in the second year. Based on the above decomposition analysis, it is clear that migration into the country leads to an increase in GDP, and an increase in GDP leads to a decrease in migration out of the country.
Further research will be related to the allocation of the influence of these three components on the country’s GDP, to improve the efficiency of migration process management in Europe and Ukraine.
Author Contributions
Conceptualization, O.R., K.S. and S.M.; methodology, O.R. and K.S.; software, K.S.; validation, K.S.; formal analysis, O.R.; investigation, O.R., K.S. and S.M.; resources, O.R., K.S. and S.M.; data curation, K.S.; writing—original draft preparation, O.R., K.S. and S.M.; writing—review and editing, O.R.; visualization, K.S.; supervision, O.R.; project administration, O.R. and S.M.; funding acquisition, O.R. All authors have read and agreed to the published version of the manuscript.
Funding
The reported study was funded by the EU’s Next-Generation EU through Recovery and Resilience Plan for Slovakia, under project number 09I03-03-V01-00083.
Informed Consent Statement
Not applicable.
Data Availability Statement
An Official Website of the European Union. Homepage: Available online: https://www.eeas.europa.eu/eeas/migration-key-element-our-foreign-policy_en (accessed on 9 March 2023). Frontex-European Border a;nd Coast Guard Agency Homepage: Available online: https://frontex.europa.eu/media-centre/news/news-release/frontex-stands-with-ukraine-koMhlh (accessed on 17 March 2023) Worldwide Immigration Trends Report: Available online: https://www.fragomen.com/trending/worldwide-immigration-trends-reports/index.html?gclid=CjwKCAjw6vyiBhB_EiwAQJ RopmEjn5ZEkMbLRGrxitYEGUwnsobcCGZhu6Gzj1_enqquuQ0euA7YnBoChlYQAvD_BwE (accessed on 27 April 2023). World Migration Report 2022. International Organization for Migration: Available online: https://worldmigrationreport.iom.int/wmr-2022-interactive (accessed on 27 April 2023). An Official Website of the Eurostat. Homepage: Available online: https://ec.europa.eu/eurostat (accessed on 27 March 2023). An Official Website of the State Statistics Service of Ukraine. Homepage: Available online: https://www.ukrstat.gov.ua/ (accessed on 12 March 2023).
Conflicts of Interest
The authors declare no conflict of interest. The funders had no role in the design of the study; in the collection, analyses, or interpretation of data; in the writing of the manuscript, or in the decision to publish the results.
References
- How Many Ukrainians Are Left? Who Will Not Return? What Will Ukrainian Society and Economy Be Like? Interview with Sociologist Ella Libanova. Available online: https://forbes.ua/war-in-ukraine/skilki-zalishilos-ukraintsiv-khto-ne-povernetsya-yakim-bude-ukrainske-suspilstvo-ta-ekonomika-intervyu-z-sotsiologineyu-elloyu-libanovoyu-17012023-11104 (accessed on 9 March 2023).
- An Official Website of the European Union. Homepage. Available online: https://www.eeas.europa.eu/eeas/migration-key-element-our-foreign-policy_en (accessed on 9 March 2023).
- Frontex-European Border a;nd Coast Guard Agency Homepage. Available online: https://frontex.europa.eu/media-centre/news/news-release/frontex-stands-with-ukraine-koMhlh (accessed on 17 March 2023).
- Brynjolfsson, E.; Diewert, W.E.; Eggers, F.; Fox, K.J.; Gannamaneni, A. The Digital Economy, GDP and Consumer Welfare: Theory and Evidence. 2018. Available online: https://www.oecd.org/naec/Brynjolfsson_MOCE-GDP-B_OECD_2018-07-26.pdf (accessed on 12 March 2023).
- Martin, F. Underestimating the Real Growth of GDP, Personal Income, and Productivity. J. Econ. Perspect. 2017, 31, 145–164. [Google Scholar]
- Cervellati, M.; Sunde, U. Life Expectancyand Economic Growth: The Role of Demographic Transition. Available online: https://docs.iza.org/dp4160.pdf (accessed on 12 March 2023).
- Woo, J.; Kumar, M.S. Public Debt and Growth. Available online: https://www.imf.org/external/pubs/ft/wp/2010/wp10174.pdf (accessed on 12 March 2023).
- Upreti, P. Factors Affecting Economic Growth in Developing Countries. Major Themes Econ. 2015, 17, 37–54. [Google Scholar]
- Labra, R.; Rock, J.A.; Álvarez, I. Identifying the key factors of growth in natural resource-driven countries. A look from the knowledge-based economy. Ens. Sobre Politics Econ. 2016, 34, 74–89. [Google Scholar] [CrossRef]
- Report of the United Nations Development Program (UNDP), published on 21 October 2020. Available online: https://news.un.org/ru/story/2020/10/1388792 (accessed on 17 April 2023).
- Heinisch, K.; Wohlrabe, K. The European Refugee Crisis and the Natural Rate of Output, IWH Discussion Papers, No. 30/2016, Leibniz-Institut für Wirtschaftsforschung Halle (IWH). 2016. Available online: https://www.researchgate.net/publication/260096281_Theories_and_Typologies_of_Migration_An_Overview_and_A_Primer (accessed on 7 May 2023).
- Kudaeva;, M.; Redozubov, I. The Impact of Migration Flows on Economic Activity and the Labor Market of Russia in General and in the Regional Aspect. 2021. Available online: http://www.cbr.ru/statichtml/file/131869/wp_khab_dec.pdf (accessed on 20 April 2023).
- Zhuravskaya, K. Statistical Analysis of the Factors Shaping the GDP. Agro-Food Economics. 2016. Available online: http://apej.ru/article/04-04-16 (accessed on 20 April 2023).
- Kira, A.R. The Factors Affecting Gross Domestic Product (GDP) in Developing Countries: The Case of Tanzania. Eur. J. Bus. Manag. 2013, 5, 4. Available online: www.iiste.org (accessed on 27 April 2023).
- Guo, H.; Zhang, Z. An Empirical Study of Factors Influencing Australia’s GDP. In Proceedings of the 2022 International Conference on Mathematical Statistics and Economic Analysis (MSEA 2022), Dalian, China, 27–29 May 2023; pp. 581–586. [Google Scholar]
- Ribaj, A.; Mexhuani, F. The impact of savings on economic growth in a developing country (the case of Kosovo). J. Innov. Entrep. 2021, 10, 1. [Google Scholar] [CrossRef]
- Nketiah, E.; Cai, X.; Adjei, M.; Boamah, B.B. Foreign Direct Investment, Trade Openness and Economic Growth: Evidence from Ghana. Open J. Bus. Manag. 2020, 8, 39–55. [Google Scholar] [CrossRef]
- International Migration: Drivers, Factors and Megatrends (2020). International Centre for Migration Policy Development (ICMPD). Available online: https://www.icmpd.org/file/download/51472/file/Policy%2520Paper%2520-%2520Geopolitical%2520Outlook%2520on%2520International%2520Migration.pdf (accessed on 1 May 2023).
- Courtney, B.; Dustmann, C.; Preston, I. The Labor Market Integration of Refugee Migrants in High-Income Countries. J. Econ. Perspect. 2020, 34, 94–121. [Google Scholar]
- Pew Research Center. Around the World, More Say Immigrants Are a Strength Than a Burden; Spring 2018 Global Attitudes Survey: Washington, DC, USA, 2019. [Google Scholar]
- Worldwide Immigration Trends Report. Available online: https://www.fragomen.com/trending/worldwide-immigration-trends-reports/index.html?gclid=CjwKCAjw6vyiBhB_EiwAQJRopmEjn5ZEkMbLRGrxitYEGUwnsobcCGZhu6Gzj1_enqquuQ0euA7YnBoChlYQAvD_BwE (accessed on 27 April 2023).
- World Migration Report 2022. International Organization for Migration. Available online: https://worldmigrationreport.iom.int/wmr-2022-interactive (accessed on 27 April 2023).
- An Official Website of the Eurostat. Homepage. Available online: https://ec.europa.eu/eurostat (accessed on 27 March 2023).
- An Official Website of the State Statistics Service of Ukraine. Homepage. Available online: https://www.ukrstat.gov.ua/ (accessed on 12 March 2023).


Disclaimer/Publisher’s Note: The statements, opinions and data contained in all publications are solely those of the individual author(s) and contributor(s) and not of MDPI and/or the editor(s). MDPI and/or the editor(s) disclaim responsibility for any injury to people or property resulting from any ideas, methods, instructions or products referred to in the content. |
© 2023 by the authors. Licensee MDPI, Basel, Switzerland. This article is an open access article distributed under the terms and conditions of the Creative Commons Attribution (CC BY) license (https://creativecommons.org/licenses/by/4.0/).