1. Introduction
There are many possible applications of artificial intelligence (AI) that can be used by educational, research and military institutions: (1) Making it possible to easily and at least partially automatically collect data like advertising tools do in many social media applications; (2) Analyzing data with the help of artificial intelligence applications, neural networks and learning algorithms. (3) Genuinely and measurably benefiting from the information obtained, which has an impact on the development of the implementation of systems.
In the following, we can also see risks/challenges in terms of utilizing artificial intelligence: (1) Not enough data are obtained or these do not actually support profiling; (2) The data are in non-usable format; (3) The total costs of the system do not match the achievable benefits; (4) Legal or information security-related obstacles are insurmountable; (5) The absence of a terminal device supports the collection of necessary data, such as a smart watch or other devices that track exercise.
The beneficiaries are:
The individual in question, so that they can monitor their development towards the target level. The system proposes a customized study path for the development of those skills, knowledge or physical characteristics that have the greatest risk of falling off the target path. From the point of view of learning analytics, the learner is one of the four areas of the cycle and the other three areas are the data, analysis, and action [
1]. If only reports are generated from the learning data, on the basis of which no action is taken, the activity is omitted and the closed cycle of learning is not formed.
The trainer can monitor the development of the mass-produced group as a whole and as individuals. See where there are the most learning difficulties and, on this basis, make development ideas to make education more effective and/or to encourage and support individuals.
The head of the unit can monitor the development of the group’s overall performance and find opportunities for creating priorities in terms of the training content.
The manager sees the mass-produced group and individuals and their suitability for the tasks in hand. If the suitability does not meet the demands, the system suggests the most suitable second option, or the manager can return to the root cause of why the suitability does not meet the demands.
The training branch can examine the implementation of training at the troop division, defense branch, and general staff level. It is essential to get grounds for changing existing operational models and training practices, if the change is beneficial from the perspective of adjusting performance, economy, or time. We can utilize the results of the analysis in the use of different target groups, and these results must be relevant for each target group and produce new value. The end users of the target group must be taken into account when designing the views.
The competence centers monitor the best results and practices in their own industry. Then, these analyze background variables and share the best practices for everyone to use.
Can we use AI for the selection process and placement of conscript training in such a way that AI can make decisions for the right conscript training program individually? In addition to this, the goal is to monitor and support conscripts education throughout their military service. In this article, we analyze the data collected from different sources with the help of artificial intelligence and compare the results to the physical requirements of different tasks.
2. AZURE, Automated Machine Learning and Voting Ensemble
Microsoft Azure offers data analysis services as part of the Azure Machine Learning service package [
2]. The service package includes data analysis capabilities, the training and production of machine learning models, as well as version control and monitoring. The service package includes the Automated Machine Learning solution for producing models.
Ensemble Method
Azure uses ensemble methods to combine multiple machine learning algorithms together in order to create a more accurate and reliable prediction [
3]. This is performed by running multiple models against the same dataset and then combining the results of each model into a single, more accurate result. Ensemble methods are used in Azure for tasks such as object detection, image classification, natural language processing (NLP), recommendation systems, anomaly detection, and time series forecasting. As an example, the Azure Ensemble includes the following models: 1. random forests; 2. gradient-boosted decision trees (GBDTs); 3. logistic regression; 4. support vector machines (SVMs); and 5. neural networks (NNs).
3. Problem and Data Description
In 2020, the Finnish Defense Forces introduced target levels for the physical performance of professional soldiers, which consist of endurance and muscle condition. The corresponding target levels for conscripts have been drawn up as part of the development of the selection process for approximately 400 positions. The purpose of this study was to utilize the durability classifications of the target levels, which are presented as the five result limits of the Cooper test. In the starting situation, there were five separate datasets that were not even related to the official task-specific aptitude test of conscripts at the user level (user_id), and for this reason, making predictions from the aptitude test would have been impossible from the outset. For this reason, no task-specific comparison was made, but the focus was on determining the predictability of the Cooper variable based on the given data. We were given four separate datasets, which were gathered from 6000 volunteers, from these 3282 used wearable devices. The datasets were as follows:
File “exercise-data.csv” contains users’ exercise data on a weekly basis, e.g., the user’s total amount of exercise in minutes during the week. Number of rows: 283,537; and number of unique users: 6000.
File “survey-data.csv” contains information from the survey filled in by users, e.g., the result of the Cooper test. All questions are multiple-choice questions, e.g., the Cooper result is only available in categories such as “2071–2900 m” or “over 3100 m”. Number of lines: 4356; and number of unique users: 3236. Note that there could be more than one row in the data from the same user.
File “weight-data.csv” contains users’ weight data at the timestamp level. Number of rows: 109,521; and number of unique users: 2476.
File “steps-sleep-data.csv” contains users’ sleep and step counts compiled on a weekly basis, e.g., the user’s average amount of sleep during the week. Number of rows: 624,000; and number of unique users: 6000. Lots of values are missing from the columns.
The following exercise behavior variables were formed from the dataset:
Total duration = total duration of training in minutes;
Total count = number of training times;
Total distance = total distance in kilometers;
Total steps = total number of steps;
Endurance duration = duration of endurance training;
Endurance count = number of endurance training sessions;
Strength duration = duration of strength training;
Strength count = number of strength training sessions;
Endurance target met = fulfillment of the endurance exercise recommendation (2.5 h/week) (yes/no);
Strength target met = meeting the strength training recommendation (2 times/week) (yes/no);
Steps avg = weekly average of daily steps;
Steps min = the smallest number of steps per day of the week;
Steps max = maximum number of steps per day of the week;
Sleep avg = average amount of sleep during the week;
Sleep min = the lowest daily amount of sleep per week;
Sleep max = maximum daily amount of sleep per week;
Weight = body weight (kg).
The main problem was the quality of the data, missing data points, and the absence of a target variable corresponding to the actual question. For example, the measured Cooper’s test results and the results of the muscle fitness tests were missing. From Cooper’s test, only the user’s own categorical assessment of their result was available with an accuracy of a few hundred meters. In addition, the Cooper test questionnaire was made even a couple of years earlier than the actual use of the fitness application started in 2020. Naturally, a person could have a completely wrong idea of their own Cooper condition. Partly for these reasons, but especially because the Cooper test result is given as a categorical variable, the regression model made from the data was not able to predict the assessment given by the user in the survey very well, with the explanation rates remaining poor. In order to reach higher degrees of explanation with the directly given data, it should have contained the exact measured values of the test results to be explained. In addition, it would be good to have all the measured data in the same file in csv format. For their part, these would have improved and facilitated the data analysis. The data should also have clear and objectively measurable values that aim to improve and from which it would be reasonable to make predictions, e.g., Cooper, muscle fitness tests, muscle–fat ratio, BMI, etc.
4. Results
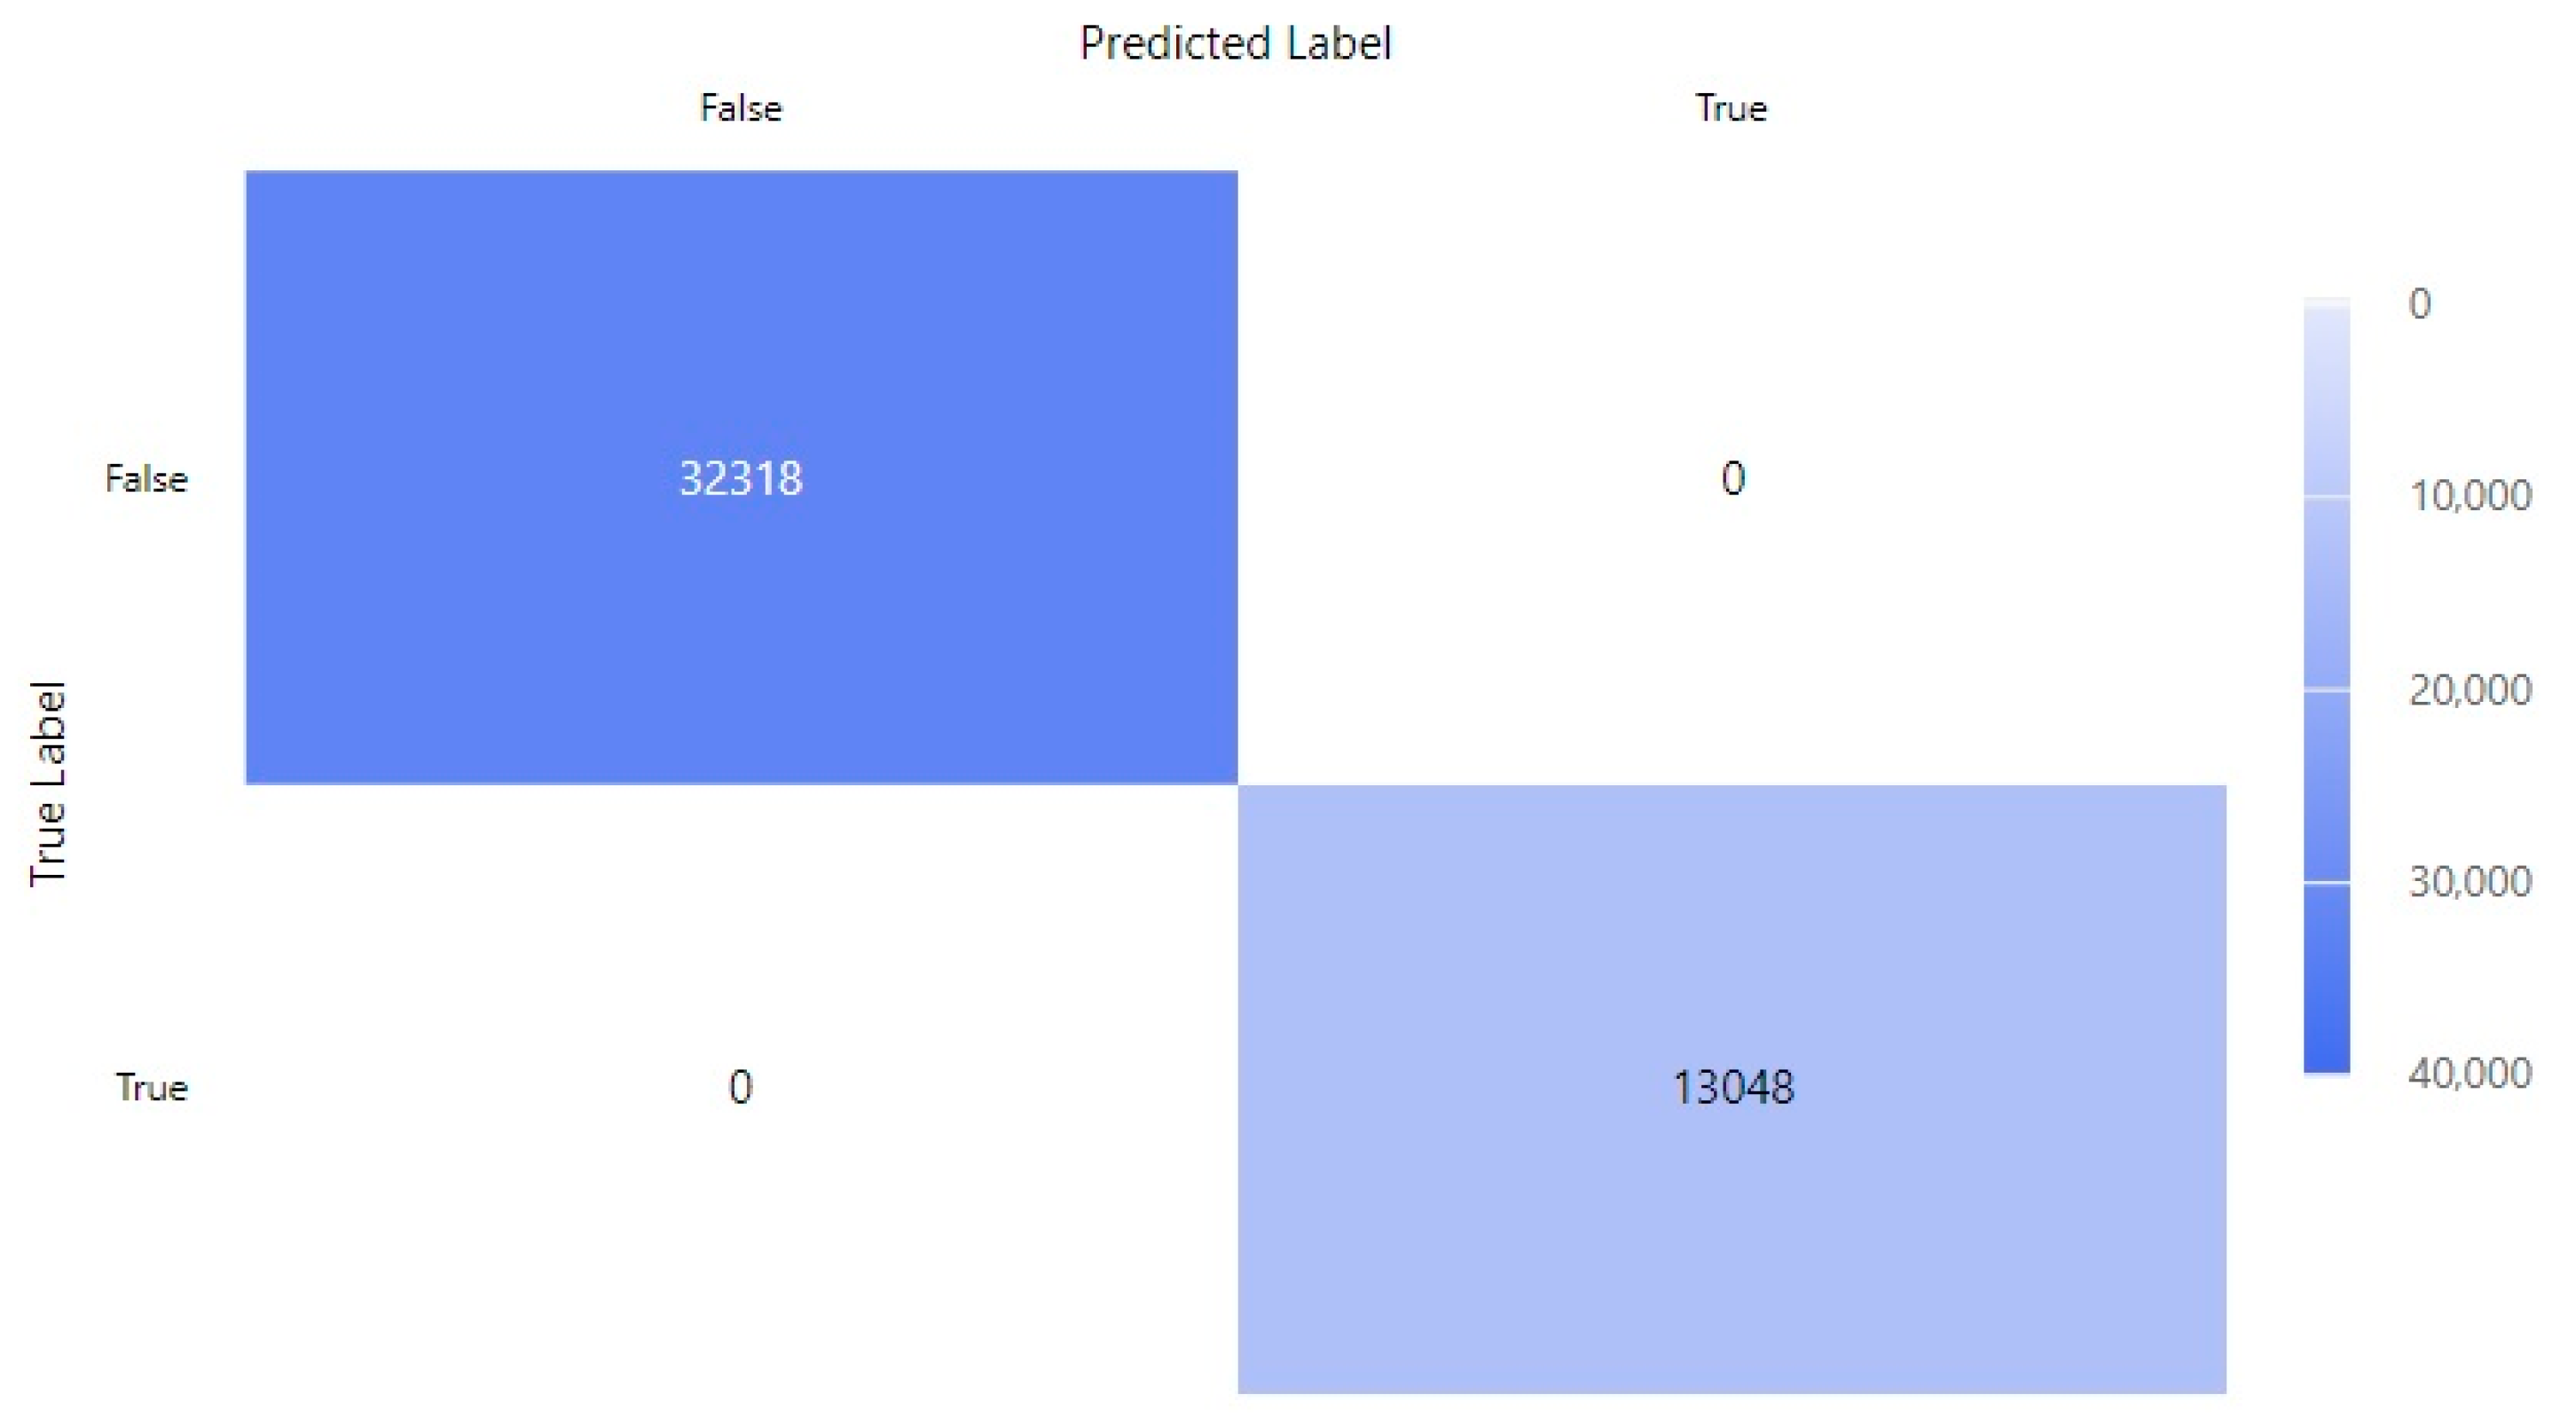
In the classification of the target endurance_target_met in the exercise dataset, the accuracy was 100%, as can be seen in
Figure 1. We converted all the values in the numbers and aggregated with the arithmetic mean in the regression.
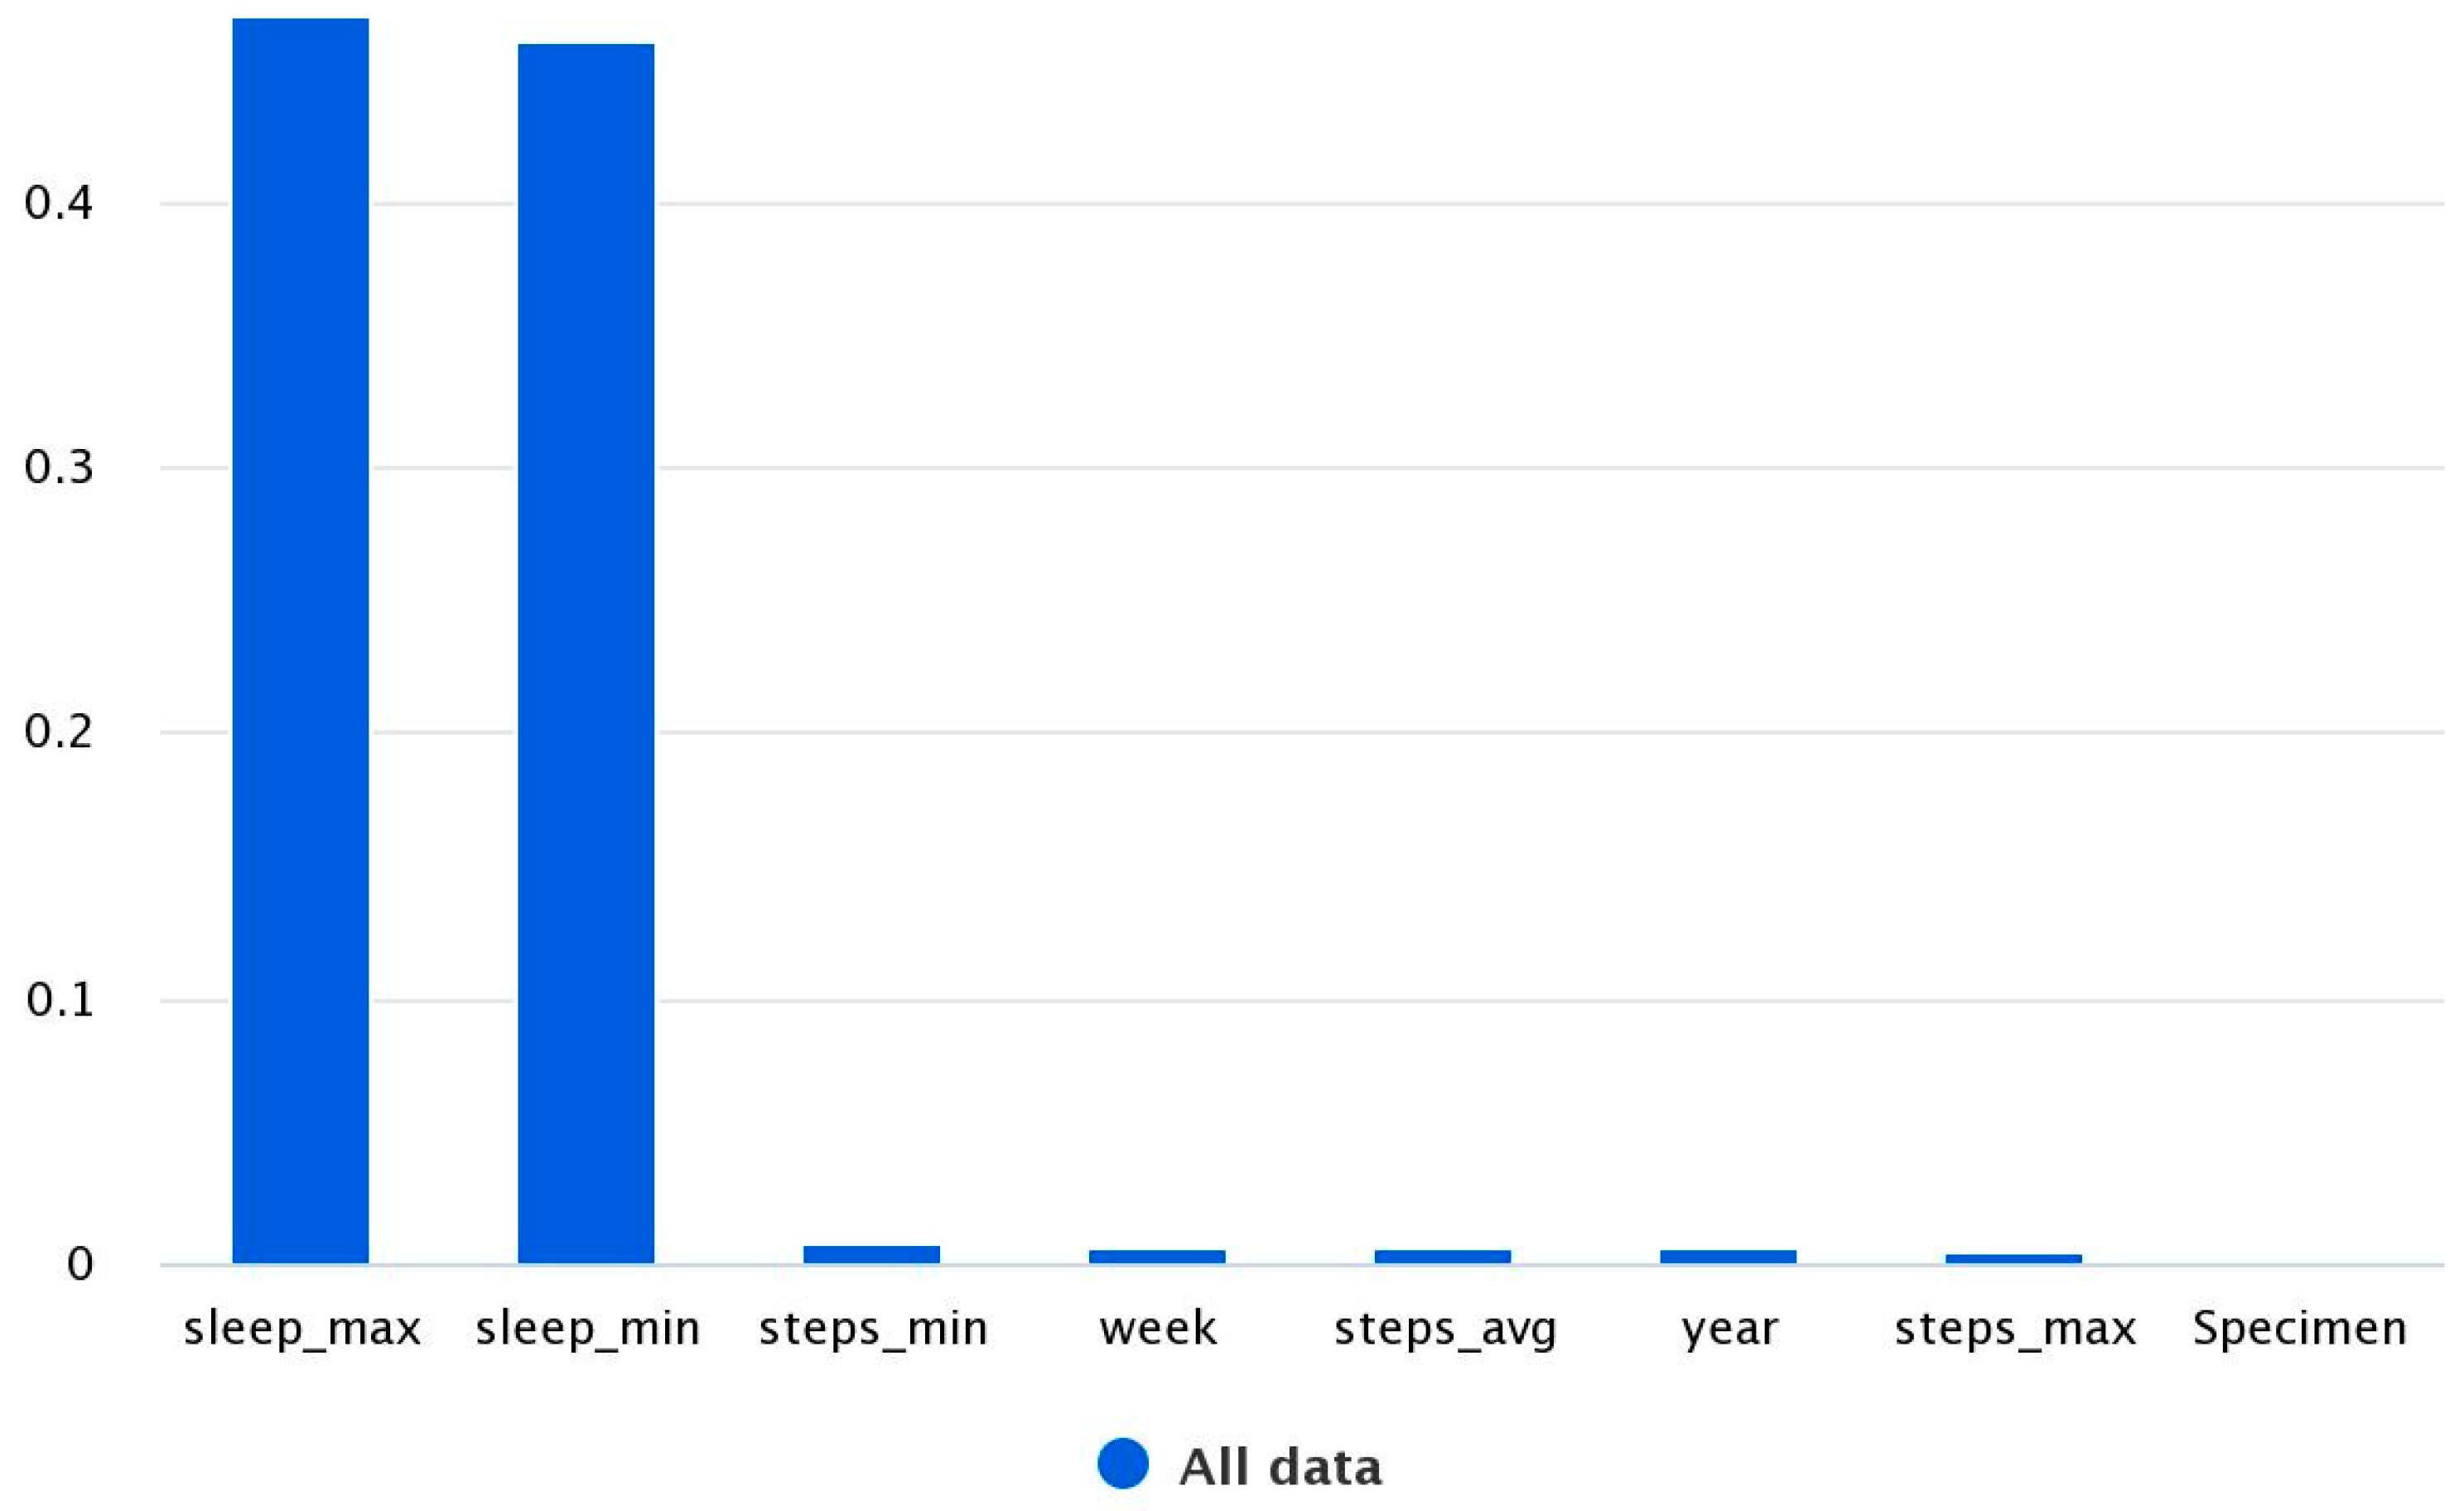
There are 624,001 rows in the steps–sleep data. There are a lot of missing data in the columns, that is why the explanation rate r
2 with the regression target sleep_avd is only 0.024%. When all measurements containing missing data are removed from the data, 92,006 measurements remain. When this is regressed, the explanation rate r
2 is 92.2%. When these values were aggregated with the arithmetic mean, the explanation rate r
2 is 97.9%. From
Figure 2, it can be seen that the minimum and maximum sleep were the main features estimating the average amount of sleep during the week.
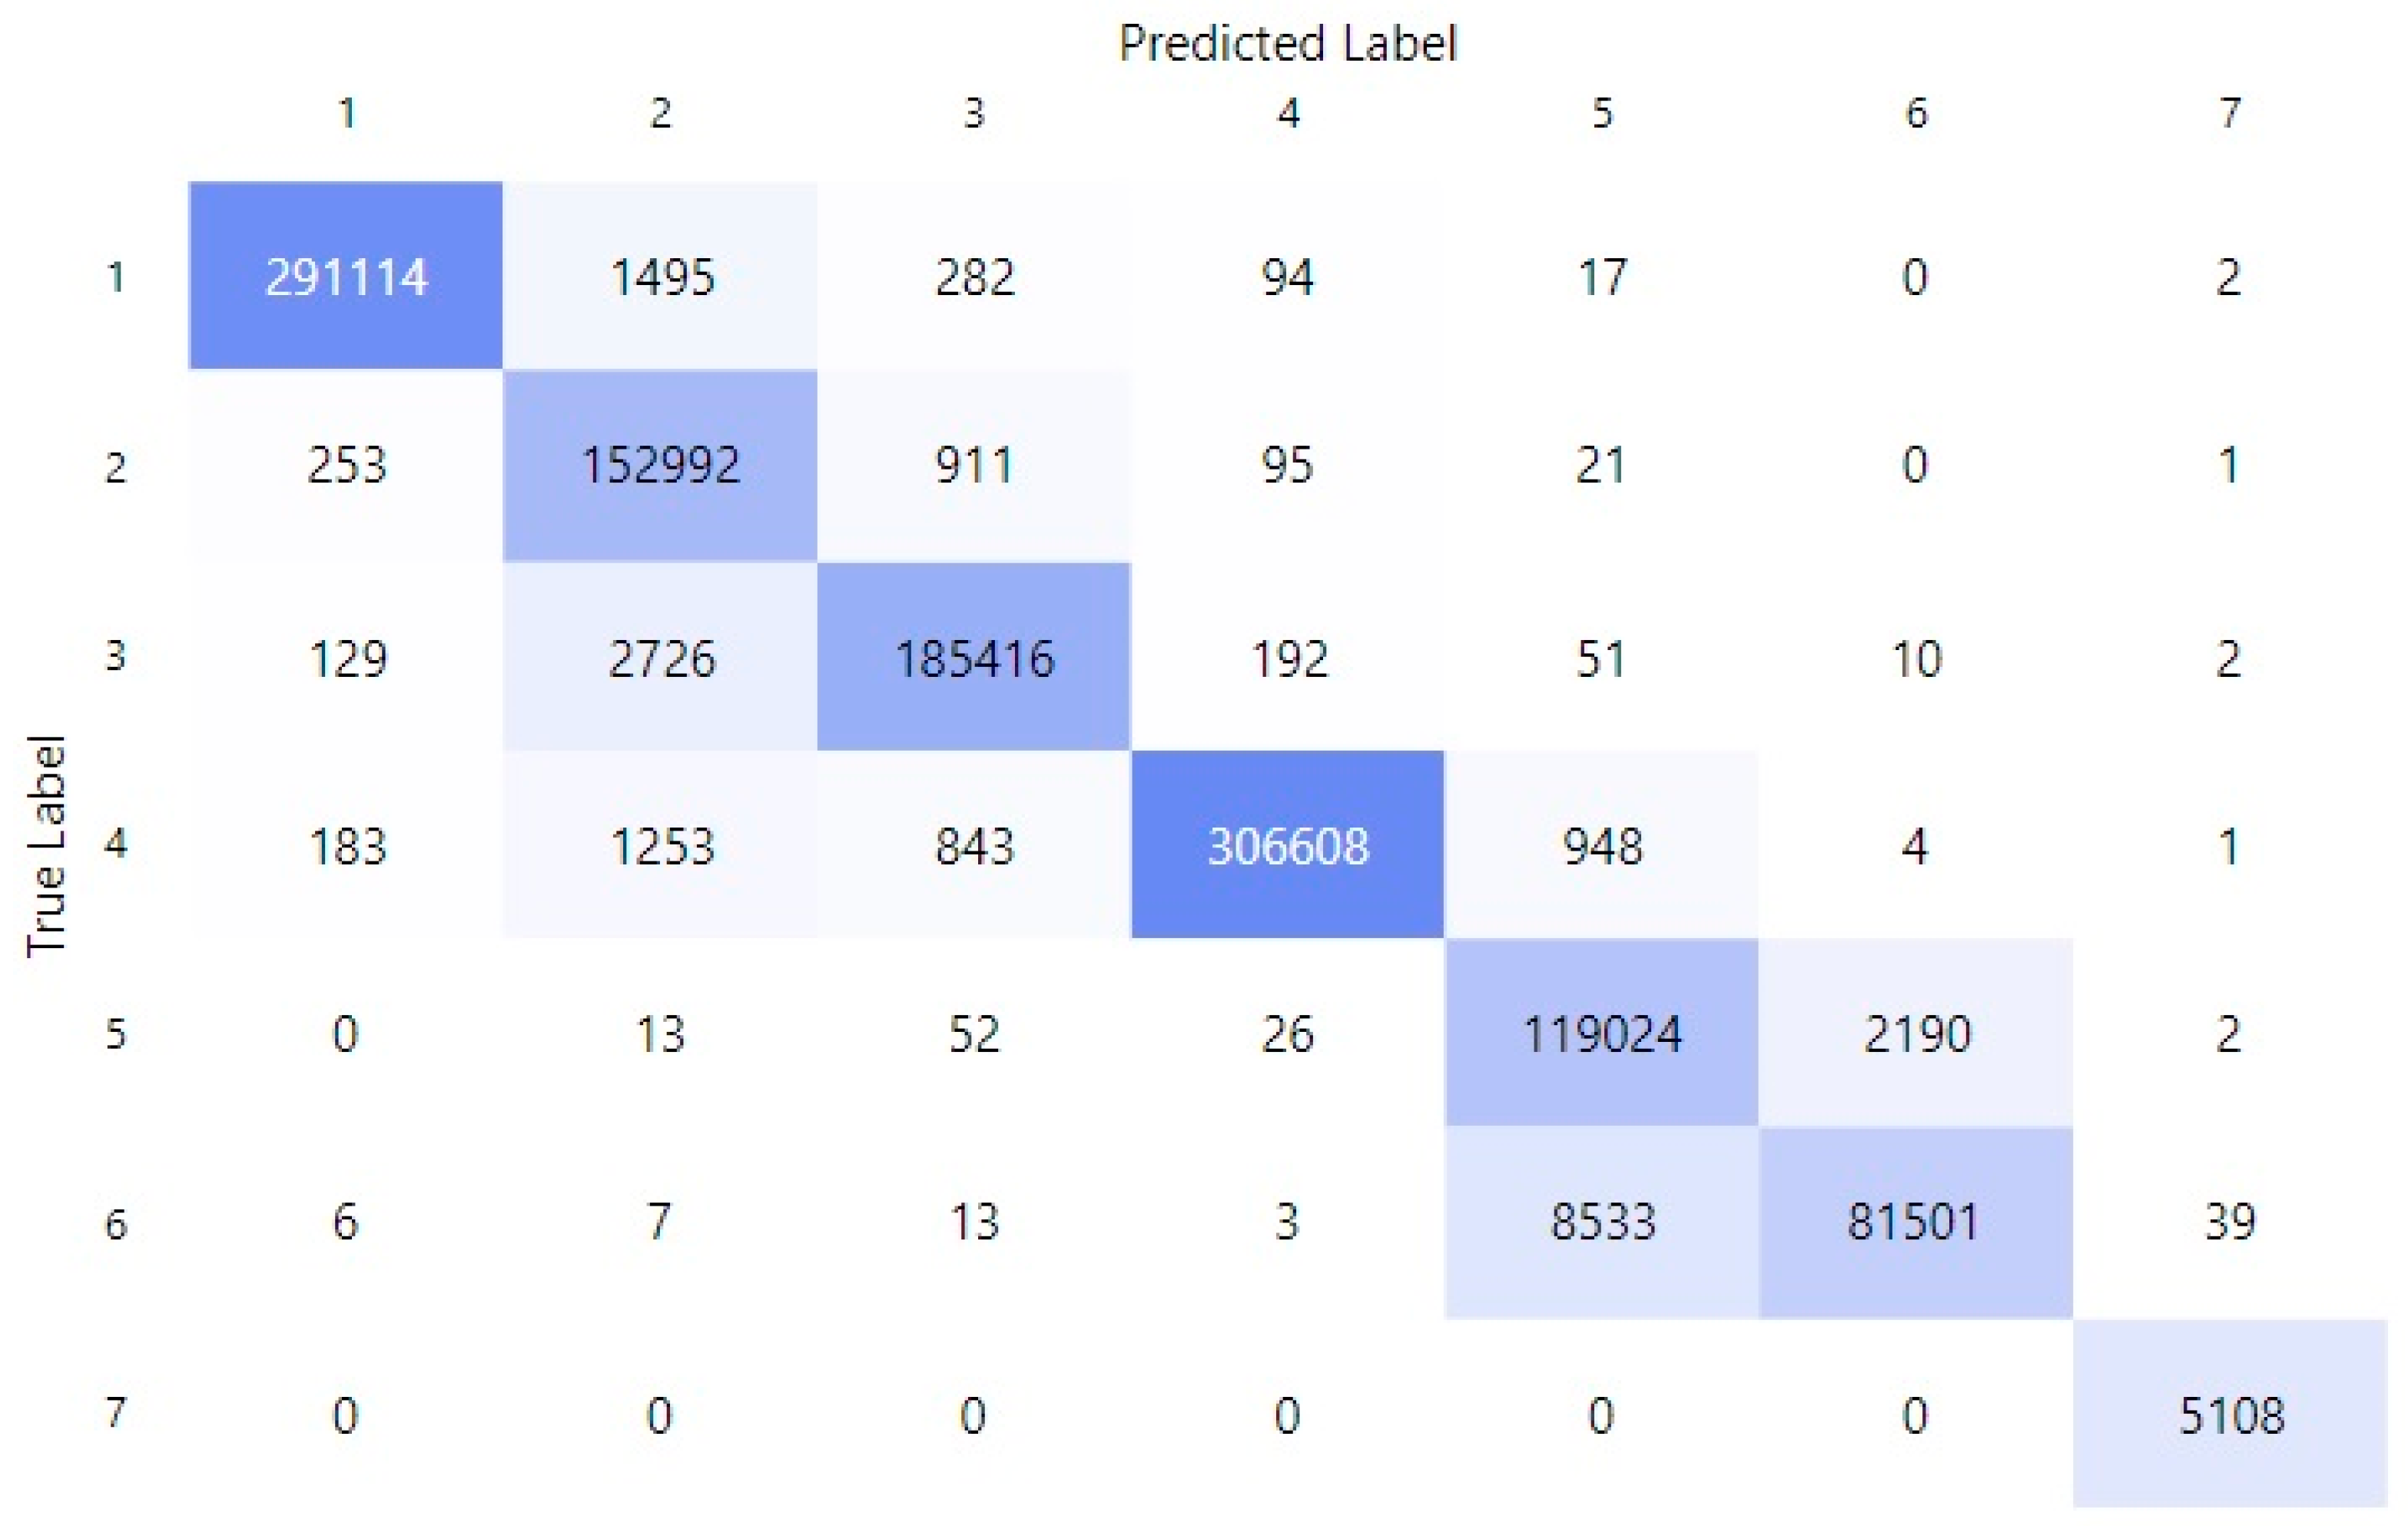
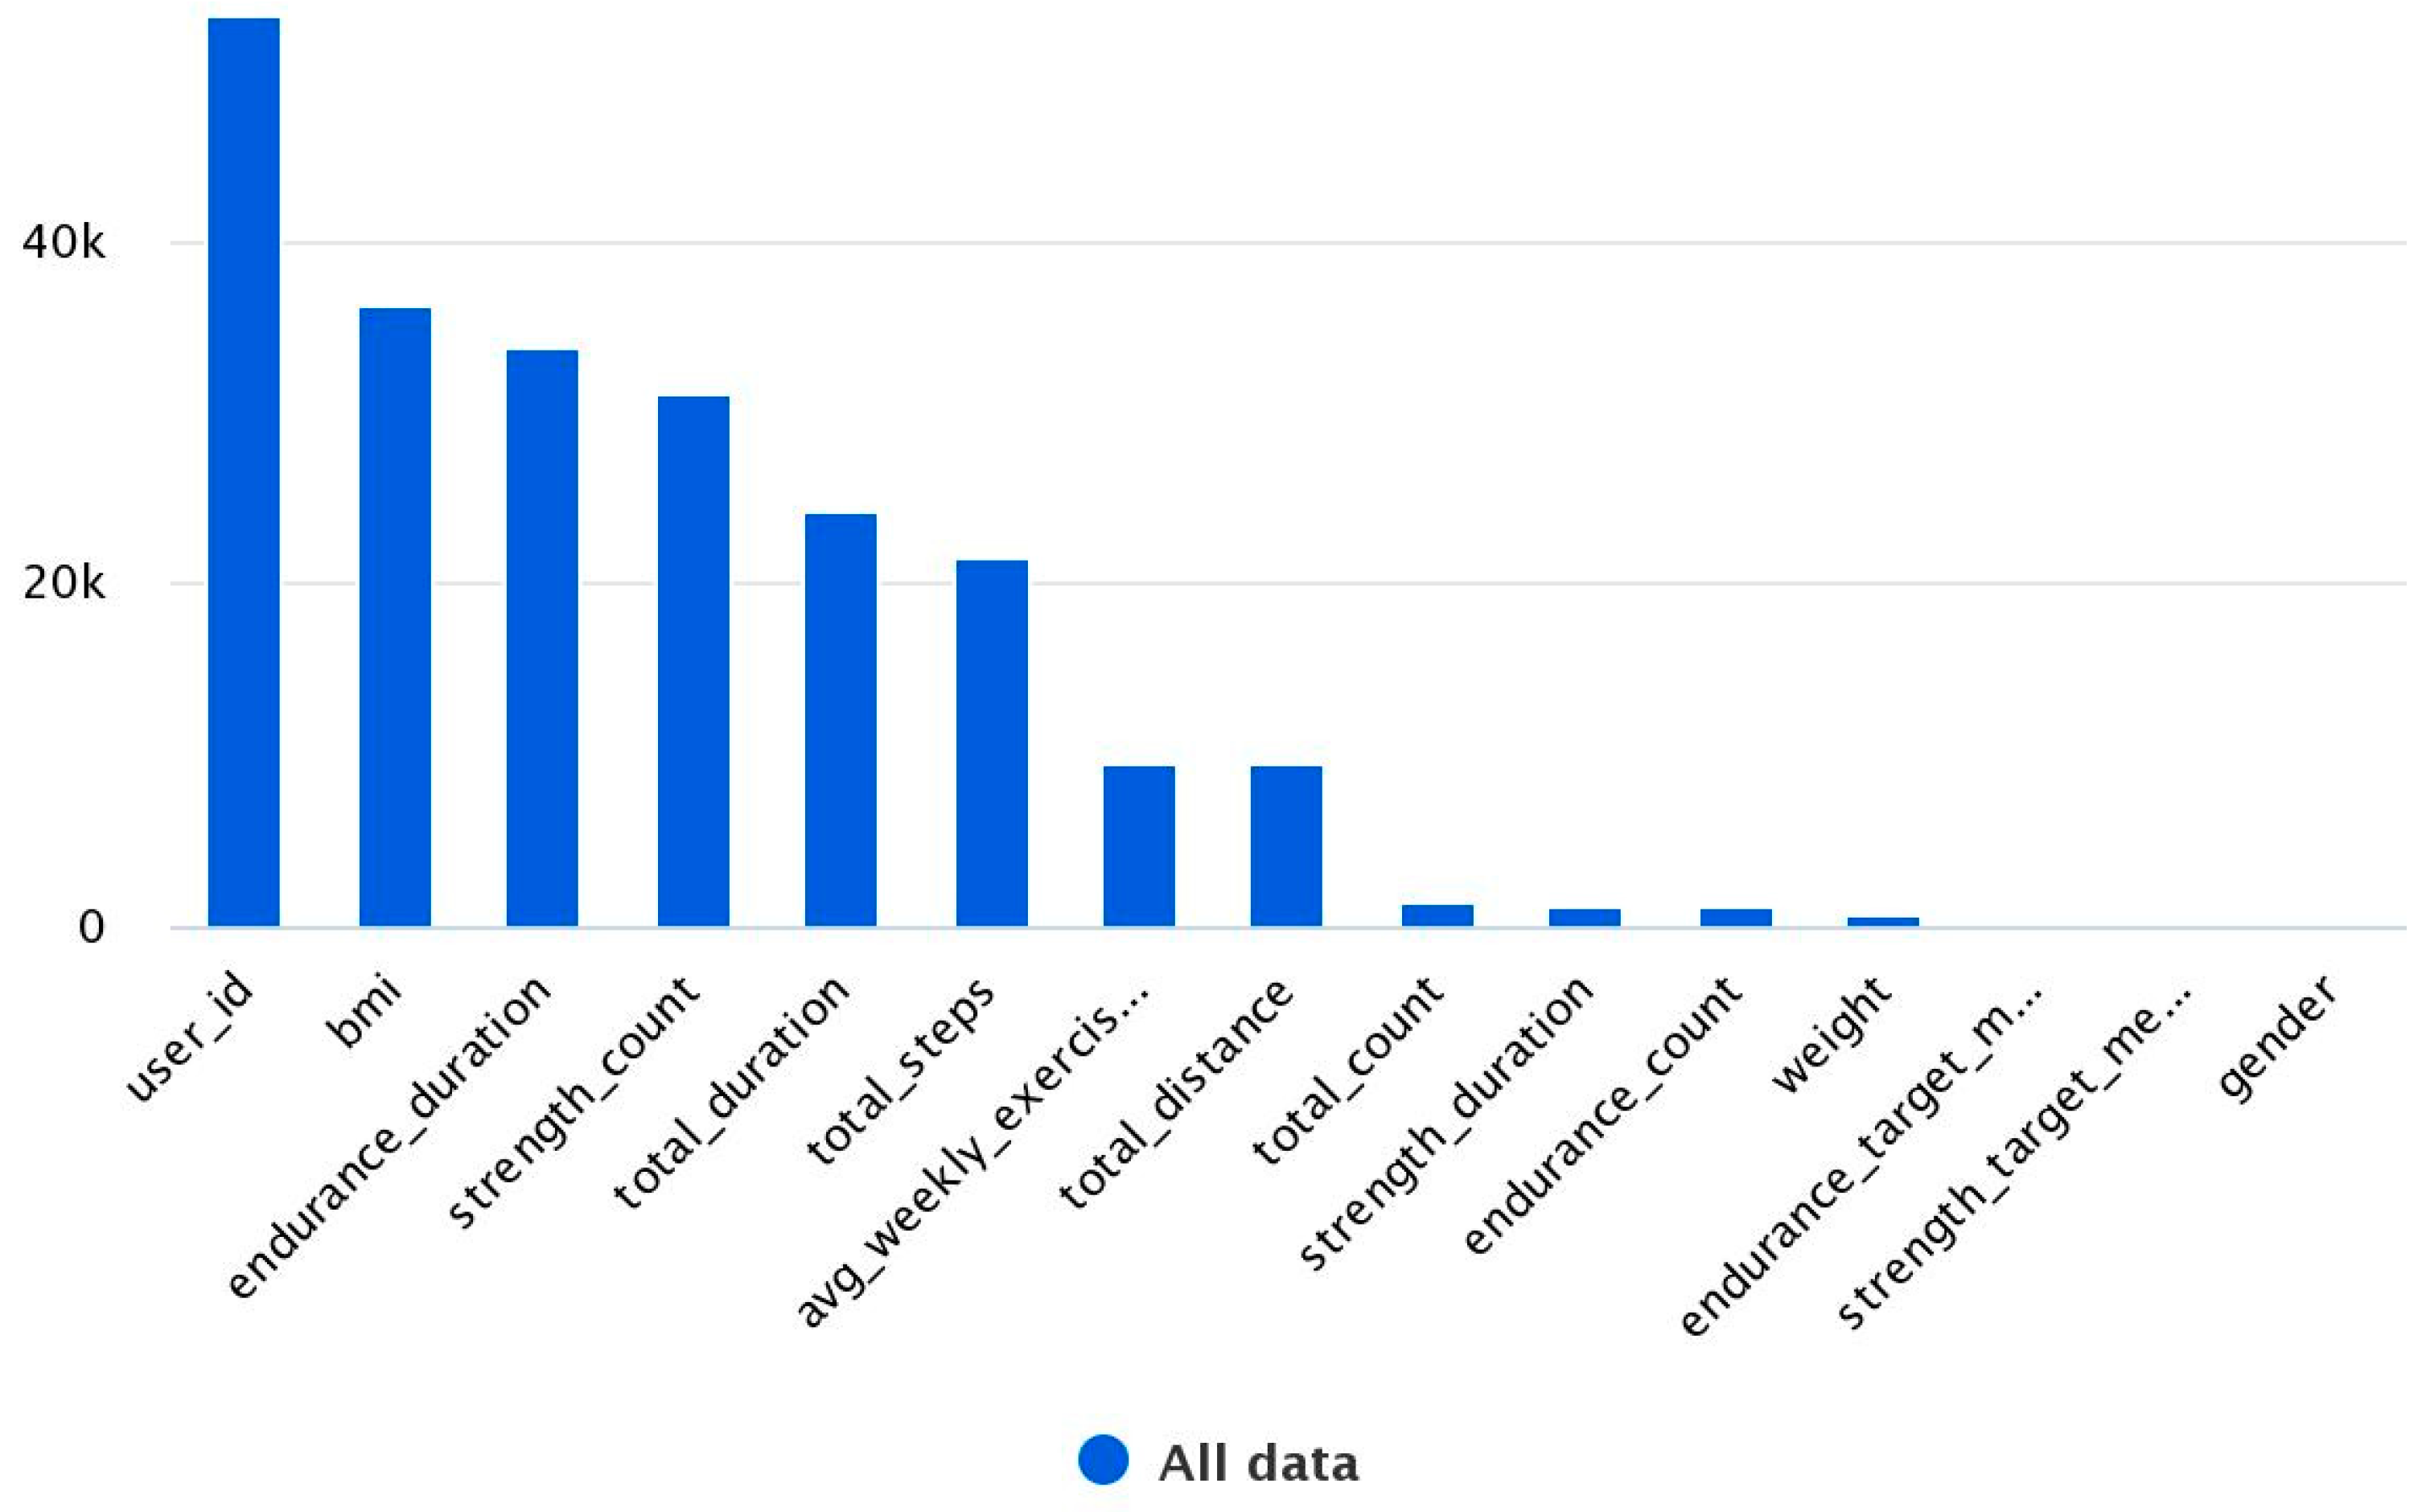
In the survey data, when classifying the object Cooper, the accuracy is only 26.3%. When the query intervals of the Cooper result are replaced by numbers 1–7, the accuracy decreases to 22.2%. When all survey data values are replaced with numerical equivalents, the accuracy was 25.5%. When the survey dataset is combined with the exercise dataset using the INNER JOIN operation with respect to users (user_id), at the same time, the values of the survey data are converted into numbers, the classification result increases to 95.8%. If we include the weight dataset to this using the INNER JOIN operation, the classification result again increases to 98.2%, as can be seen in
Figure 3 and
Figure 4.
With the given data, we reach more than 90% accuracy with all tested measurements. However, in all other cases, except for exercise data, this required the deletion of the missing data or the merging of data. Combining the weight data with other data partly improved the obtained results.
5. Discussion and Future
In this study, it was found that, using directly provided data, it was reasonably difficult to reach the 90% target value given in the forecasts. In previous surveys, it has been possible to predict endurance fitness with typically 50–60% accuracy. For example, Matsuo et al. [
4] reported that, in the adult population, age, sex, body mass index and level of physical activity explained 59% of the variation in the measured maximal oxygen uptake capacity. In a recent research publication by Santtila et al. [
5] on Finnish conscripts, the result of the 12 min running test was able to be predicted based on the self-reported amount of activity and sitting, the assessment of readiness to perform conscript service, educational background, smoking, and body composition with a 52% explanation rate (mean error 8.8%/207 m). These accuracy values are not sufficient in terms of their usability to make predictions from conscript training choices.
By modifying the given data by combining and manipulating it, we reached the target value, i.e., more than 90% predictability, at least in the prediction of the tested variables (Cooper, endurance goal and average amount of sleep). In the analyses of this report, the explanation rates reached a maximum of 100%. Endurance condition could not be predicted in the end, because the source material did not contain enough results of a condition test newly developed for the application. As a final result, it was found that, by developing the data to be used by adding data points, it is possible to become closer to the set goals, and in order to reach these, the necessary measures were already taken in part, even without this investigation, to obtain the missing data points.
Based on the results, it can be concluded that machine learning methods can be used to determine good enough predictions about conscripts conditions. In the future, exercise behavior data must only be objectively collected by measuring using wearable/portable devices or under controlled test conditions. Muscle and endurance test results can be used to predict the conscript’s fitness class, as long as the measured results exist in one file. On a more general level, it can be stated that by utilizing existing datasets, knowledge-based management can also be developed in the education industry. Various datasets must be tested with courage, so that their capabilities in managing information can be recognized.
Author Contributions
Conceptualization, K.P., T.E.A. and J.J.; methodology, K.S.; validation, K.S. and K.P.; formal analysis, K.S.; investigation, K.S., T.E.A. and K.P.; resources, P.L.; data curation, K.S.; writing—original draft preparation, K.S.; writing—review and editing, K.S.; visualization, K.S.; supervision, P.L.; project administration, P.L.; funding acquisition, P.L. All authors have read and agreed to the published version of the manuscript.
Funding
This research received no external funding.
Institutional Review Board Statement
No statements provided.
Informed Consent Statement
We have used only anonymous data during this research.
Data Availability Statement
Acknowledgments
We are grateful to HeiaHeia Ltd. for providing us with the original data, Digia Ltd. and Oracle Ltd. for valuable and constant support during this research. We especially thank data scientist Julius Nieminen from Digia Ltd. who did more than his share analyzing data, and special thanks also go to the data scientist Bob Peulen from Oracle Ltd. for giving us the idea of combining the datasets for better results.
Conflicts of Interest
The authors declare no conflict of interest.
References
- Clow, D. The learning analytics cycle: Closing the loop effectively. In Proceedings of the 2nd International Conference on Learning Analytics and Knowledge, Vancouver, BC, Canada, 29 April–2 May 2012; pp. 134–138. [Google Scholar]
- Goswami, M.; Franks, L.; Salgado, S.; Nagata, S.; Ndem, R.; Ovhal, P.; Gilley, S.; Jain, S.; Gold, B.; Wu, J.; et al. What Is Automated ML? AutoML—Azure Machine Learning|Microsoft Learn. Available online: https://learn.microsoft.com/en-us/azure/machine-learning/concept-automated-ml (accessed on 21 March 2023).
- Asanka, D. Building Ensemble Classifiers in Azure Machine Learning. Available online: https://www.sqlshack.com/building-ensemble-classifiers-in-azure-machine-learning/ (accessed on 21 March 2023).
- Matsuo, T.; So, R.; Takahashi, M. Workers’ physical activity data contribute to estimating maximal oxygen consumption: A questionnaire study to concurrently assess workers’ sedentary behavior and cardiorespiratory fitness. BMC Public Health 2020, 20, 1–10. [Google Scholar]
- Santtila, M.; Pihlainen, K.; Vaara, J.; Nindl, B.C.; Heikkinen, R.; Kyröläinen, H. Aerobic fitness predicted by demographics, anthropometrics, health behaviour, physical activity and muscle fitness in male and female recruits entering military service. BMJ Mil. Health, 2022; Epub ahead of print. [Google Scholar] [CrossRef] [PubMed]
| Disclaimer/Publisher’s Note: The statements, opinions and data contained in all publications are solely those of the individual author(s) and contributor(s) and not of MDPI and/or the editor(s). MDPI and/or the editor(s) disclaim responsibility for any injury to people or property resulting from any ideas, methods, instructions or products referred to in the content. |
© 2023 by the authors. Licensee MDPI, Basel, Switzerland. This article is an open access article distributed under the terms and conditions of the Creative Commons Attribution (CC BY) license (https://creativecommons.org/licenses/by/4.0/).


 ,
, 