Abstract
We study the performance of a helical type of internally finned tube (HIFT), using computational fluid dynamics (CFD) to obtain optimal temperature uniformity and reduce the pressure drop. In comparison with a bare tube, the HIFT improved the temperature uniformity with a helix length of 10 d, which was enough to obtain satisfactory temperature uniformity. A smaller helix interval angle and a smaller helix pitch yielded a larger pressure drop. The temperature of the HIFT decreased with an increase in the helix pitch.
1. Introduction
Fluid mixing achieves process homogeneity and affects flow system performance significantly. Improvement in mixing allows mixture homogenization and enhances heat and mass transfer for chemical reactions. Poor thermal uniformity may cause equipment fatigue and damage and influence the piping geometry and operating conditions. Thermal and fluid flow prediction is therefore important for equipment safety. In this study, we apply computational fluid dynamics (CFD) to study the performance of a helical type of internally finned tube (HIFT) and its heat transfer and pressure drop. As a result, the optimal temperature uniformity is determined to reduce the pressure drop.
2. Methods
In this research, we used ANSYS FLUENT V.17 [1] to analyze the flow development in an HIFT. The SIMPLE algorithm was used as a solution algorithm [2]. In turbulence modeling, we adopted the transition SST model. Considering the accuracy and stability, we used the discrete ordinate radiation model [3] for radiation simulation.
3. Results and Discussion
The parameters investigated included the helix interval angle (∆α), helix pitch (P), and helix length (L) to obtain better thermal uniformity and minimize the pressure drop. Figure 1 illustrates the investigated HIFT. The tube length was 132 d, where d is a pipe diameter of 50.7 mm. Fourteen helix lengths ranging from L = 0 (i.e., a bare tube) to L = 132 d were tested to understand the influence of the helix length. In addition, seven helix interval angles (∆α) ranging from 36° to 180° and three helix pitches (2d, 3d, and 4d) were inspected as well. The boundary conditions were as follows.
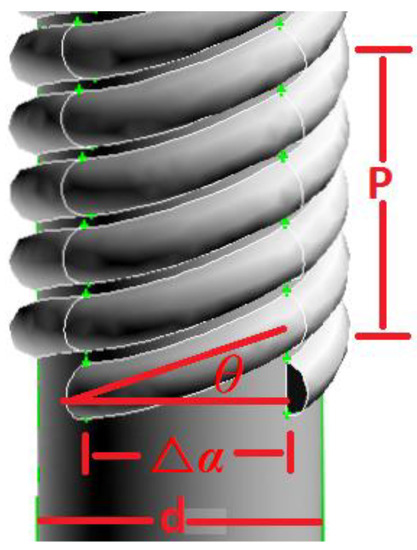
Figure 1.
Illustration of the HIFT investigated.
The tube inlet (Figure 2) included four parts. In Region 1, V = 56.2 m/s and T = 273.15 K. In Region 2, V = 61.3 m/s and T = 298.15 K. In Region 3, V = 66.5 m/s and T = 323.15 K. Finally, in Region 4, V = 71.6 m/s and T = 348.15 K. The inlet turbulence kinetic energy (k) was assumed to be 10% of V2/2. The turbulence dissipation rate is modeled by Equation (1).
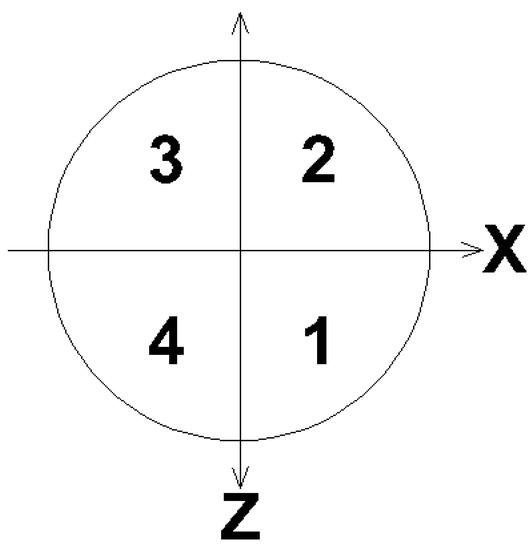
Figure 2.
Division of the inlet.
In Equation (1), the constant Cμ = 0.09, parameter l = 0.07L, and the hydraulic diameter L is equal to the pipe diameter d. At the wall boundaries, the transition SST model automatically takes the wall effects into account. In this study, adiabatic walls were assumed. At the tube’s exit, the gauge pressure was zero. For the other flow variables, the outflow diffusion flux was zero, and the conservation of mass was satisfied. The effect of the helix length on the pressure variation along the tube is shown in Figure 3. A longer helix yielded a larger pressure drop which was nearly proportional to the helix length. The pressure drop was closely related to the tube’s inner surface friction, which was connected with the helix length. The pressure drop was greater than that of the bare tube when the helix length was larger than 10 d.
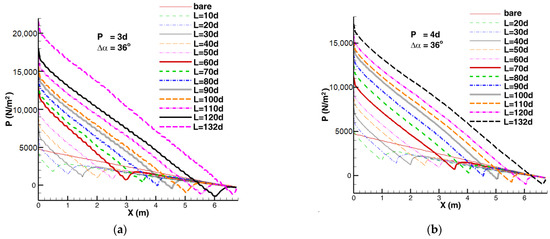
Figure 3.
Variation in the cross-sectional average pressure. (a) P = 3d and ∆α = 36°. (b) P = 4d and ∆α = 36°.
The effect of the helix length on the cross-sectional average temperature is shown in Figure 4. The temperature of the HIFT was higher than that of the bare tube. In addition, the temperature of the HIFT increased with the helix length because of the greater frictional heating of the tube wall.
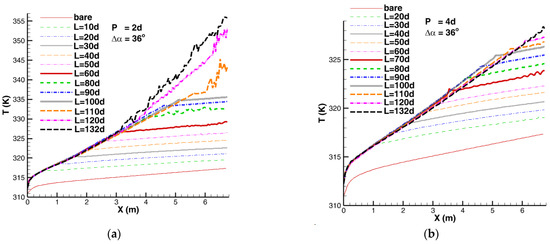
Figure 4.
Variation in the cross-sectional average temperature. (a) P = 3d and ∆α = 36°. (b) P = 4d and ∆α = 36°.
The effect of the helix length on the area-weighted temperature uniformity index is defined as follows (Figure 5) [1]:
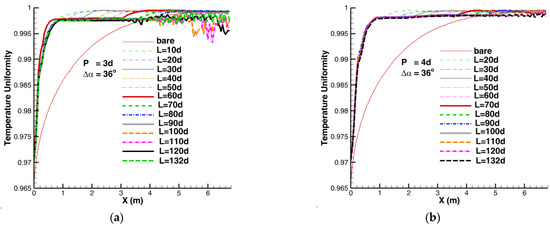
Figure 5.
Temperature uniformity index along the tube. (a) P = 3d and ∆α = 36°. (b) P = 4d and ∆α = 36°.
In Equation (2), i is the facet index, and n is the number of facets of a surface. is the surface average temperature:
A value of one indicates optimal uniformity. Figure 5 shows that the HIFT could improve the temperature uniformity index when compared with a bare tube. The evolution of the temperature uniformity index depended on the helix length. In the helix, the temperature uniformity is nearly constant at a specific value, while after leaving the helix, the temperature uniformity increases to another specific value. Therefore, using the HIFT with a long helix is unnecessary. A helix length of 10 d is enough to obtain satisfactory temperature uniformity.
The effect of the helix interval angle on the pressure variation is shown in Figure 6. It was observed that a smaller helix interval angle yielded a larger pressure drop which was nearly inversely proportional to the helix interval angle. Because the pressure drop was closely related to the tube’s inner surface friction, a smaller helix interval angle led to more helixes and hence a greater inner surface area and more friction in the tube.
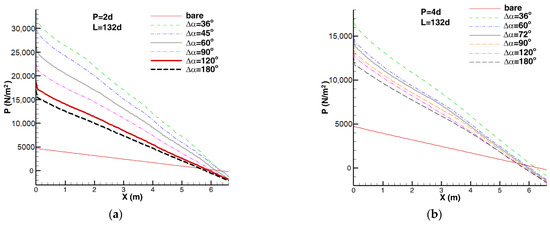
Figure 6.
Variation in the cross-sectional average pressure. (a) P = 2d and L = 132d. (b) P = 4d and L = 132d.
The effect of the helix interval angle on the cross-sectional average temperature distribution is shown in Figure 7. A larger helix interval angle yielded a lower temperature. This is because a larger helix interval angle corresponds to fewer fins, which in turn have a smaller inner surface area and lower frictional heating effect.
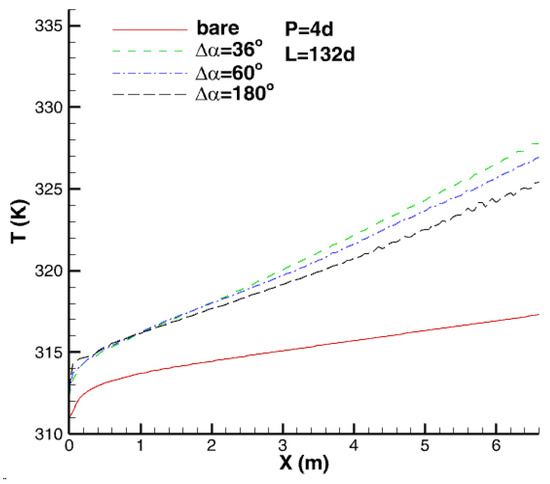
Figure 7.
Variation in the cross-sectional average temperature.
The effect of the helix interval angle on the temperature uniformity index is shown in Figure 8. The larger the helix interval angle was, the worse the temperature uniformity would be. This is because a larger helix interval angle leads to fewer helixes and worse mixing.
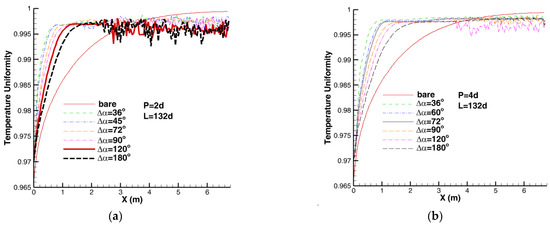
Figure 8.
Temperature uniformity index along the tube. (a) P = 2d and L = 132 d. (b) P = 4d and L = 132 d.
The effect of the helix pitch on the pressure variation is shown in Figure 9. A smaller helix pitch yielded a larger pressure drop which was nearly inversely proportional to the helix pitch. Because the pressure drop was closely related to the tube’s inner surface friction, a smaller helix pitch led to more helixes and hence a larger inner surface area and more friction in the tube.
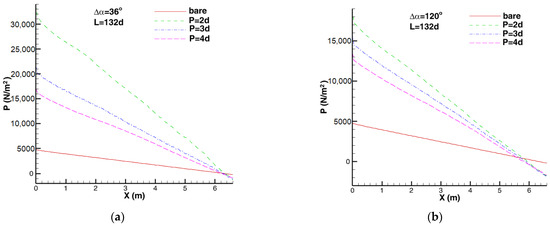
Figure 9.
Variation in the cross-sectional average pressure. (a) ∆α = 36° and L = 132 d. (b) ∆α = 120° and L = 132 d.
The effect of the helix pitch on the cross-sectional average temperature distribution is shown in Figure 10. A larger helix pitch yielded a lower temperature for the HIFT. This is because a larger helix pitch results in fewer helixes and hence a smaller inner surface area and lower frictional heating effect on the tube.
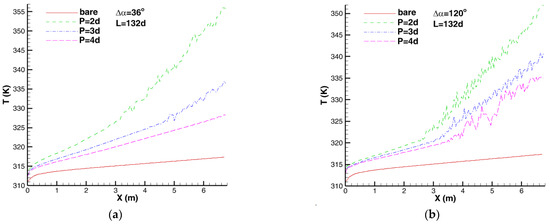
Figure 10.
Variation in the cross-sectional average temperature. (a) ∆α = 36° and L = 132 d. (b) ∆α = 120° and L = 132 d.
The effect of the helix pitch on the temperature uniformity index is shown in Figure 11. The influence of the helix pitch on temperature uniformity was not significant. However, careful observation revealed that a smaller helix pitch yielded better temperature uniformity.
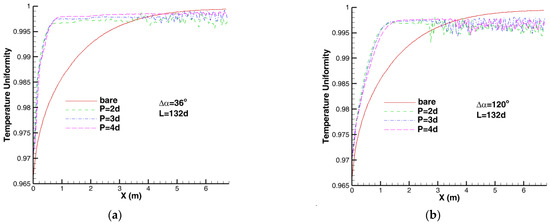
Figure 11.
Temperature uniformity index along the tube. (a) ∆α = 36° and L = 132 d. (b) ∆α = 120° and L = 132 d.
4. Conclusions
The performance of the HIFT was investigated by using CFD to obtain optimal temperature uniformity and reduce the pressure drop. We found that a longer helix yielded a larger pressure drop which was nearly proportional to the helix length. When the helix length was larger than 10 d, the pressure drop was greater than that of the bare tube. The temperature of the HIFT was higher than that of the bare tube. The temperature of the HIFT increased with the helix length. In comparison with the bare tube, the HIFT improved the temperature uniformity with the helix length. However, using the HIFT with a long helix was unnecessary. A helix length of 10 d was enough to obtain satisfactory temperature uniformity. A smaller helix interval angle yielded a larger pressure drop which was nearly inversely proportional to the helix interval angle. The temperature of the HIFT decreased with the helix interval angle. In addition, the larger the helix interval angle was, the worse the temperature uniformity would be. A smaller helix pitch yielded a larger pressure drop. The temperature of the HIFT decreased with the helix pitch, but the influence of the helix pitch on the temperature uniformity was not significant. However, careful observation revealed that a smaller helix pitch yielded better temperature uniformity.
Author Contributions
Conceptualization, C.-L.Y.; methodology, C.-L.Y.; validation, C.-L.Y.; formal analysis, C.-L.Y.; data curation, C.-L.Y., D.-L.W., Q.-Y.C., S.-Y.Y., X.-J.L. and G.-H.L.; writing—original draft preparation, C.-L.Y.; writing—review and editing, C.-L.Y., D.-L.W., Q.-Y.C., S.-Y.Y., X.-J.L. and G.-H.L.; visualization, C.-L.Y., D.-L.W., Q.-Y.C., S.-Y.Y., X.-J.L. and G.-H.L. All authors have read and agreed to the published version of the manuscript.
Funding
This research received no external funding.
Institutional Review Board Statement
Not applicable.
Informed Consent Statement
Not applicable.
Data Availability Statement
The data presented in this study are available on request from the corresponding author.
Conflicts of Interest
The authors declare no conflict of interest.
References
- Fluent Inc. ANSYS FLUENT 17 User’s Guide; Fluent Inc.: New York, NY, USA, 2017. [Google Scholar]
- Patankar, S.V. Numerical Heat Transfer and Fluid Flows; McGraw-Hill: New York, NY, USA, 1980. [Google Scholar]
- Siegel, R.; Howell, J.R. Thermal Radiation Heat Transfer; Hemisphere Publishing Corporation: Washington, DC, USA, 1992. [Google Scholar]
Disclaimer/Publisher’s Note: The statements, opinions and data contained in all publications are solely those of the individual author(s) and contributor(s) and not of MDPI and/or the editor(s). MDPI and/or the editor(s) disclaim responsibility for any injury to people or property resulting from any ideas, methods, instructions or products referred to in the content. |
© 2023 by the authors. Licensee MDPI, Basel, Switzerland. This article is an open access article distributed under the terms and conditions of the Creative Commons Attribution (CC BY) license (https://creativecommons.org/licenses/by/4.0/).