Proceeding Paper

Big Data Analysis on the Characteristics of Drought Disaster Changes in Hebei Province in the Past 30 Years †

Department of Landscape Design & Forestry, Beijing University of Agricultural, Beijing 102206, China
*
Author to whom correspondence should be addressed.
Presented at the 3rd IEEE International Conference on Electronic Communications, Internet of Things and Big Data Conference 2023, Taichung, Taiwan, 14–16 April 2023.
Eng. Proc. 2023, 38(1), 52; https://doi.org/10.3390/engproc2023038052
Published: 27 June 2023

Abstract

:
Based on the monthly precipitation data of 139 meteorological stations from 1981 to 2015, the trend line method was used to analyze the variation of the drought area and sown area from 1981 to 2015 and the characteristics of drought in Hebei Province. The results showed the following. (1) the frequency of drought was the highest in winter and the lowest in summer, which was 43.2 and 26.2%, respectively. (2) The ratio of drought stations was highest in winter and lowest in summer. The frequency of global drought was 37 and 17% in summer and winter, respectively. Except for the increasing trend of drought in summer, all other seasons showed a decreasing trend which was significant in autumn (α = 0.05). (3) The drought intensity of the four seasons was all less than 1. The drought intensity in spring and summer showed an upward trend, while that in autumn and winter showed a downward trend. The drought intensity in autumn showed a significant downward trend (α = 0.05). (4) Drought disaster rate was positively correlated with summer drought intensity and drought ratio.

1. Introduction

Drought is the main natural disaster in China with a wide range of impacts on the social economy, production, and the life of people [1]. According to statistics, from 1990 to 2016, the average annual grain loss caused by drought in China was as high as 25.2 billion kg [2]. With the change in global climate, the occurrence and development of drought disasters showed new characteristics [3]. Therefore, drought disasters had become an attractive research issue for scientists all over the world. Among them, the grasp of the spatio-temporal variation of drought disasters was particularly important for disaster prevention and reduction of losses caused by disasters. Thus, scholars have carried out extensive research in this regard and achieved important results [2,4,5,6,7,8,9,10,11]. In the process of research on drought, the following types of drought indicators were usually used. (1) Single index, mainly including precipitation anomaly percentage [12], standardized precipitation index [4], relative humidity index [5], soil relative humidity drought index [13], and the Palmer Drought Index [8]. These indexes require appropriate data that is easy to obtain and calculate. (2) Comprehensive indexes such as the Z index [9] and crop water deficit index [10] require data that is difficult to obtain as their calculation is complicated. However, they effectively reflect the actual drought and flood situation. (3) Disaster indicators include crop disaster, disaster, and harvest area, casualties, direct economic losses, and various derivative indicators reflect disaster-causing factors, disaster-causing environment, disaster effect, and disaster resistance.
In any case, it is difficult to obtain small-scale spatial and temporal data. Many scholars [10,11] have used disaster indicators to study drought and made important achievements. The reduction of precipitation was the most fundamental reason for the occurrence of drought. Among these indicators, precipitation anomalies directly reflect the drought. The precipitation data was easy to obtain as it showed temporal continuity and spatial distribution. Therefore, with the precipitation anomaly as a drought indicator, we systematically analyze the characteristics of drought in Hebei Province in the previous 30 years to provide a theoretical basis for drought prevention and mitigation.

2. Overview of Study Area

Hebei Province is one of the 13 major grain-producing areas according to the ‘13th Five-Year Plan’ and ‘Science and Technology Innovation for High Grain Yield and Efficiency’. The website of the National Bureau of Statistics (http://data.stats.gov.cn/ (accessed on 31 December 2018)) shows that the planting area of maize and wheat in Hebei Province accounts for 9 and 10% of the national area from 2000 to 2018.
Drought accounts for about 62% of meteorological disasters in Hebei Province and is the main disaster for agriculture. The average annual drought in Hebei Province from 1981 to 2015 affected an area of 1,760,000 km2, which was 18.4% of the whole crop planting area in China. The interannual variation of the drought was shown in Figure 1. The rate in Hebei Province in the late 1980s and 1990s was relatively high. In 1999 and 1997, the drought disaster rate was 34.1 and 32.7%. After the m-k trend test, the downward trend of drought reached the significant indigenous level of 0.01. To further explore the spatial and temporal distribution of drought in Hebei Province, we take the precipitation anomaly as an indicator to discuss the frequency of drought, drought ratio, and drought intensity.

3. Data Sources and Research Methods

3.1. Data Source

The monthly precipitation of 139 meteorological stations in Hebei Province from 1981 to 2015 was obtained from the 13th Five-Year National Key Research and Development Plan (2017YFD0300400). The data was based on the area of drought and crop production in Hebei Province during the same period. The area and crop production were collected from the China Civil Administration Statistical Yearbook. To eliminate the influence of the interannual variation of crop planting area on the disaster area, we used the drought index such as the crop disaster rate in Hebei Province. Crop disaster rate refers to the ratio of the affected area and drought and sowing area in the same period. The crop sowing area is obtained from the 60-year statistics of agriculture in New China (1981–1998) of the Ministry of Agriculture and Rural Affairs of the People’s Republic of China and the website of the National Bureau of Statistics (http://data.stats.gov.cn (accessed on 31 December 2018)) (1999–2015). The seasons are divided as follows: spring from March to May, summer from June to August, Autumn from September to November, and Winter from December to February.

3.2. Research Method

Precipitation anomaly (PA) refers to the ratio of precipitation anomaly in a certain period and the average annual precipitation. In this study, the precipitation anomaly was used as an indicator to evaluate the drought of Hebei Province in four seasons each year. The evaluation criteria were collected from the national standards of the People’s Republic of China (GB/T20481-2017), and the seasonal scale standard was adopted from it, too as follows. When PA > −25%, there was no drought. When −50% < PA ≤ −25%, light drought. When −70% < PA ≤ −50%, moderate drought. When −80% < PA ≤ −70%, severe drought. When PA ≤ −80%, extreme drought.
The frequency of drought in each scale (light, moderate, severe, and extreme drought) in Hebei Province from 1981 to 2015 was expressed by the interannual occurrence of drought. The influence range and drought intensity were expressed by the ratio of drought and drought intensity. The calculation methods of drought frequency, the ratio of drought, and drought intensity followed Ref. [14].
The analysis of the temporal change of drought is based on the trend line method in which the climate propensity rate [14] is used to express the changing trend and rate of drought disaster indicators by establishing a univariate linear regression equation between disaster factors and time series. The rank-based nonparametric Mann-Kendall statistical test method was used to test the significance of the changing trend of each time series. The calculation method of Ref. [14] was used in this study.

4. Results and Analysis

4.1. Spatial-Temporal Distribution Characteristics of Drought Occurrence Frequency in Hebei Province

4.1.1. Frequency of Spring Drought in Hebei Province

The average frequency of spring drought in Hebei Province was 37.2%, mainly mild and moderate drought. Table 1 shows the areas of high-frequency drought on different scales in Hebei Province. The average frequency of light drought was 21.7%. Shijiazhuang, Hengshui, and Baoding were the centers of high-frequency drought. The maximum value appeared at Pingshan, which was 40%. The average frequency of moderate drought was 11.0%. The areas with high frequency were mainly concentrated in Tangshan and Qinhuangdao. In the center of Qian’ an, the frequency was 25.7%. The average frequency of severe drought was 2.9%. The areas of high frequency were concentrated in Cangzhou, Xingtai, and northeast Baoding, with a frequency of 14.3%. The frequency of spring drought was 1.7%, and the high frequency occurred in Handan and north-central Langfang.

4.1.2. Frequency of Summer Drought in Hebei Province

The average frequency of drought in summer in Hebei Province was 26.0%, and mild drought was dominant in summer. Table 2 shows the high-frequency occurrence areas of drought in summer. The average frequency of light drought was 20.3%, and the high frequency appeared in the central region of Hebei Province, including southern Tangshan, Langfang, Baoding, Shijiazhuang, and western Xingtai western Handan. Gaocheng and Yongnian showed 34.3% of the frequency. The frequency of middle drought was 5.0%, and the area of the high frequency region was mainly distributed in the southern part of Hebei Province, with the highest value in Nanpi (17.1%). The frequency of severe drought and extreme drought was low in summer. The area was mainly distributed in the south of Hebei Province, and the area of the high frequency of extreme drought was mainly distributed in the west and Langfang of Handan City and the eastern part of Cangzhou City.

4.1.3. Frequency of Autumn Drought in Hebei Province

The average frequency of autumn drought in Hebei Province was 383%, and the drought was mainly mild and moderate. The frequency of autumn drought is shown in Table 3. The average frequency of mild drought was 24.1%, and the area was distributed in western Handan and Xingtai. The frequency of Jinzhou was the highest, which was 42.9%. The average frequency of moderate drought was 9.5%, which was mainly concentrated in the southern part of Hebei Province, especially northeast Handan and eastern Xingtai. The highest frequency was 20.0% in Handan. The high-incidence areas of severe drought were mainly concentrated in the southeast of Hebei Province. especially Cangzhou and Handan. The highest frequency appeared in Guangping and Gu’ an, showing 11.4%. The area of extreme drought was mainly concentrated in the southern part of Hebei Province, especially in Handan.

4.1.4. Frequency of Winter Drought in Hebei Province

The average frequency of winter drought in Hebei Province was 43.2%, and the frequency of severe drought and extreme drought was higher. The high frequency of winter drought was shown in Table 4. The average frequency of mild drought was 14.7%, mainly concentrated in the northern part of Chengde, Pingquan and Xinglong station had the highest frequency of 31.4%. The average frequency of moderate drought was 10.9%. Tangshan and Qinhuangdao had the highest frequency, and the highest frequency was 25.7% in Qian’an. The average frequency of severe drought was 5.1%, mainly concentrated in the southern area of Tangshan and Qinhuangdao, the highest value was 14.3%, appeared in Luanxian and Luannan station. The frequency of extreme drought was much higher than that in spring, summer and autumn, with an average of 12.6%, which was mainly concentrated in the southern part of Hebei Province, and the highest value was 22.9% in the Anping, Hejian, Cangzhou. and Zhaoxian stations.

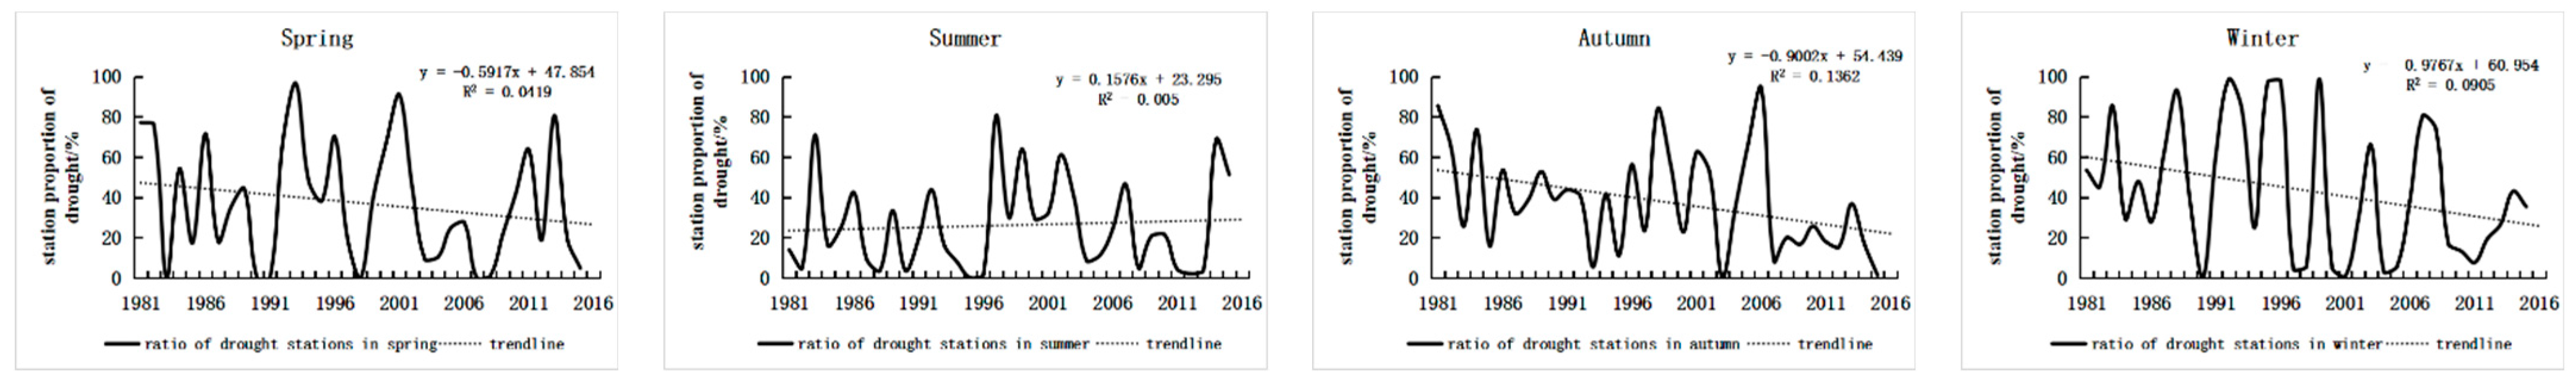
4.2. Trend Analysis of the Ratio of Drought Stations in Hebei Province

The ratio of drought stations could indicate the range of drought influence. The average ratio of drought stations in spring, summer, autumn. and winter in Hebei Province was 37%, 26%, 38%, and 43%, respectively. It could be found that the range of drought influence in winter was the largest, and the range of drought influence in spring and autumn was similar, reaching the regional drought degree. The variation trend of drought impact range in the four seasons was shown in Figure 2. In addition to the increase in the ratio of drought stations in summer, all other seasons showed a decreasing trend. After the m-k trend test, it could be seen that the decrease trend of the ratio of drought stations in autumn was significant (α = 0.05), and the other seasonal change of trends were not significant.

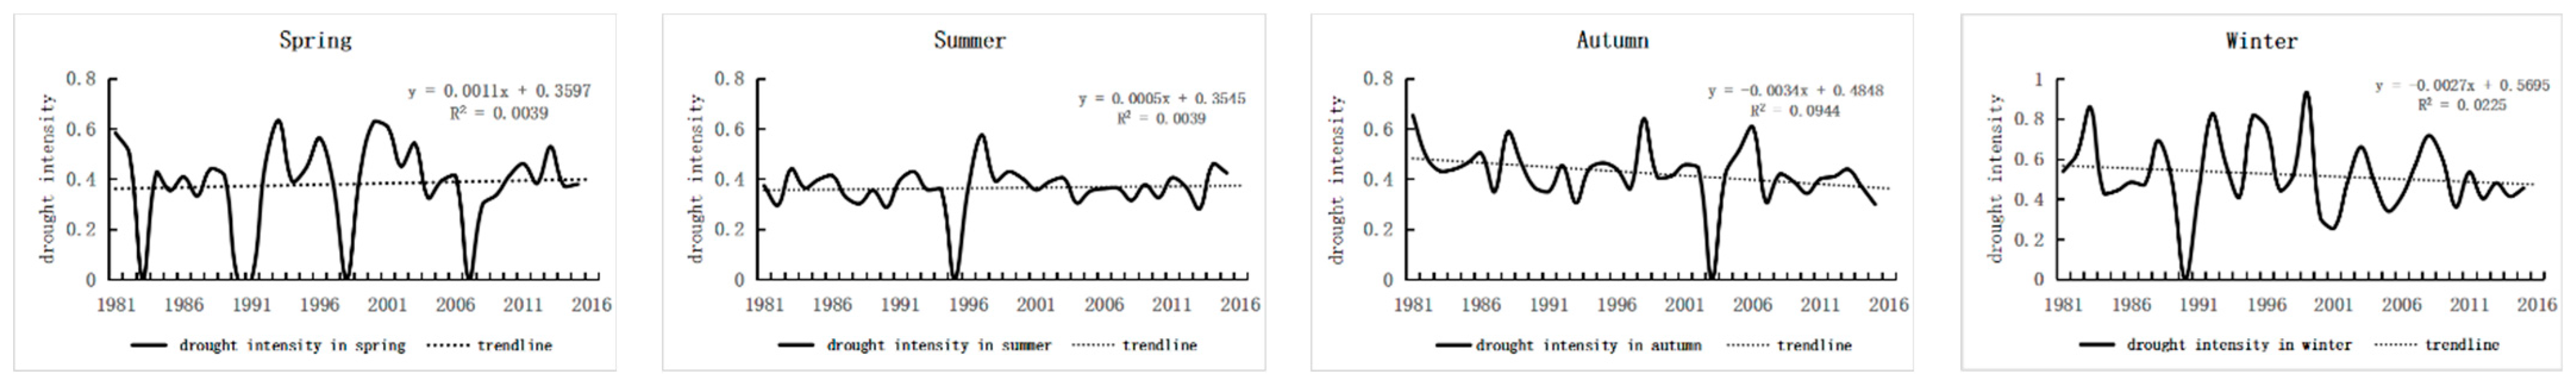
4.3. Trend Analysis of Drought Intensity in Hebei Province

The drought intensity index indicates the change in drought intensity in Hebei Province. The average drought intensity in spring, summer, autumn, and winter in Hebei Province was 0.38, 0.36, 0.42, and 0.52. The average drought intensity in winter was the highest. The drought intensity at the regional level in the four seasons was lower than 1, and the regional drought intensity was mild (Figure 3). Figure 3 shows that the spring and summer drought intensity in Hebei Province was on the rise, while autumn and winter drought intensity was on the decline. The m-k trend test result showed the decreasing trend of drought intensity in autumn at the significant level of 0.05. The trend in other seasons was not significant.

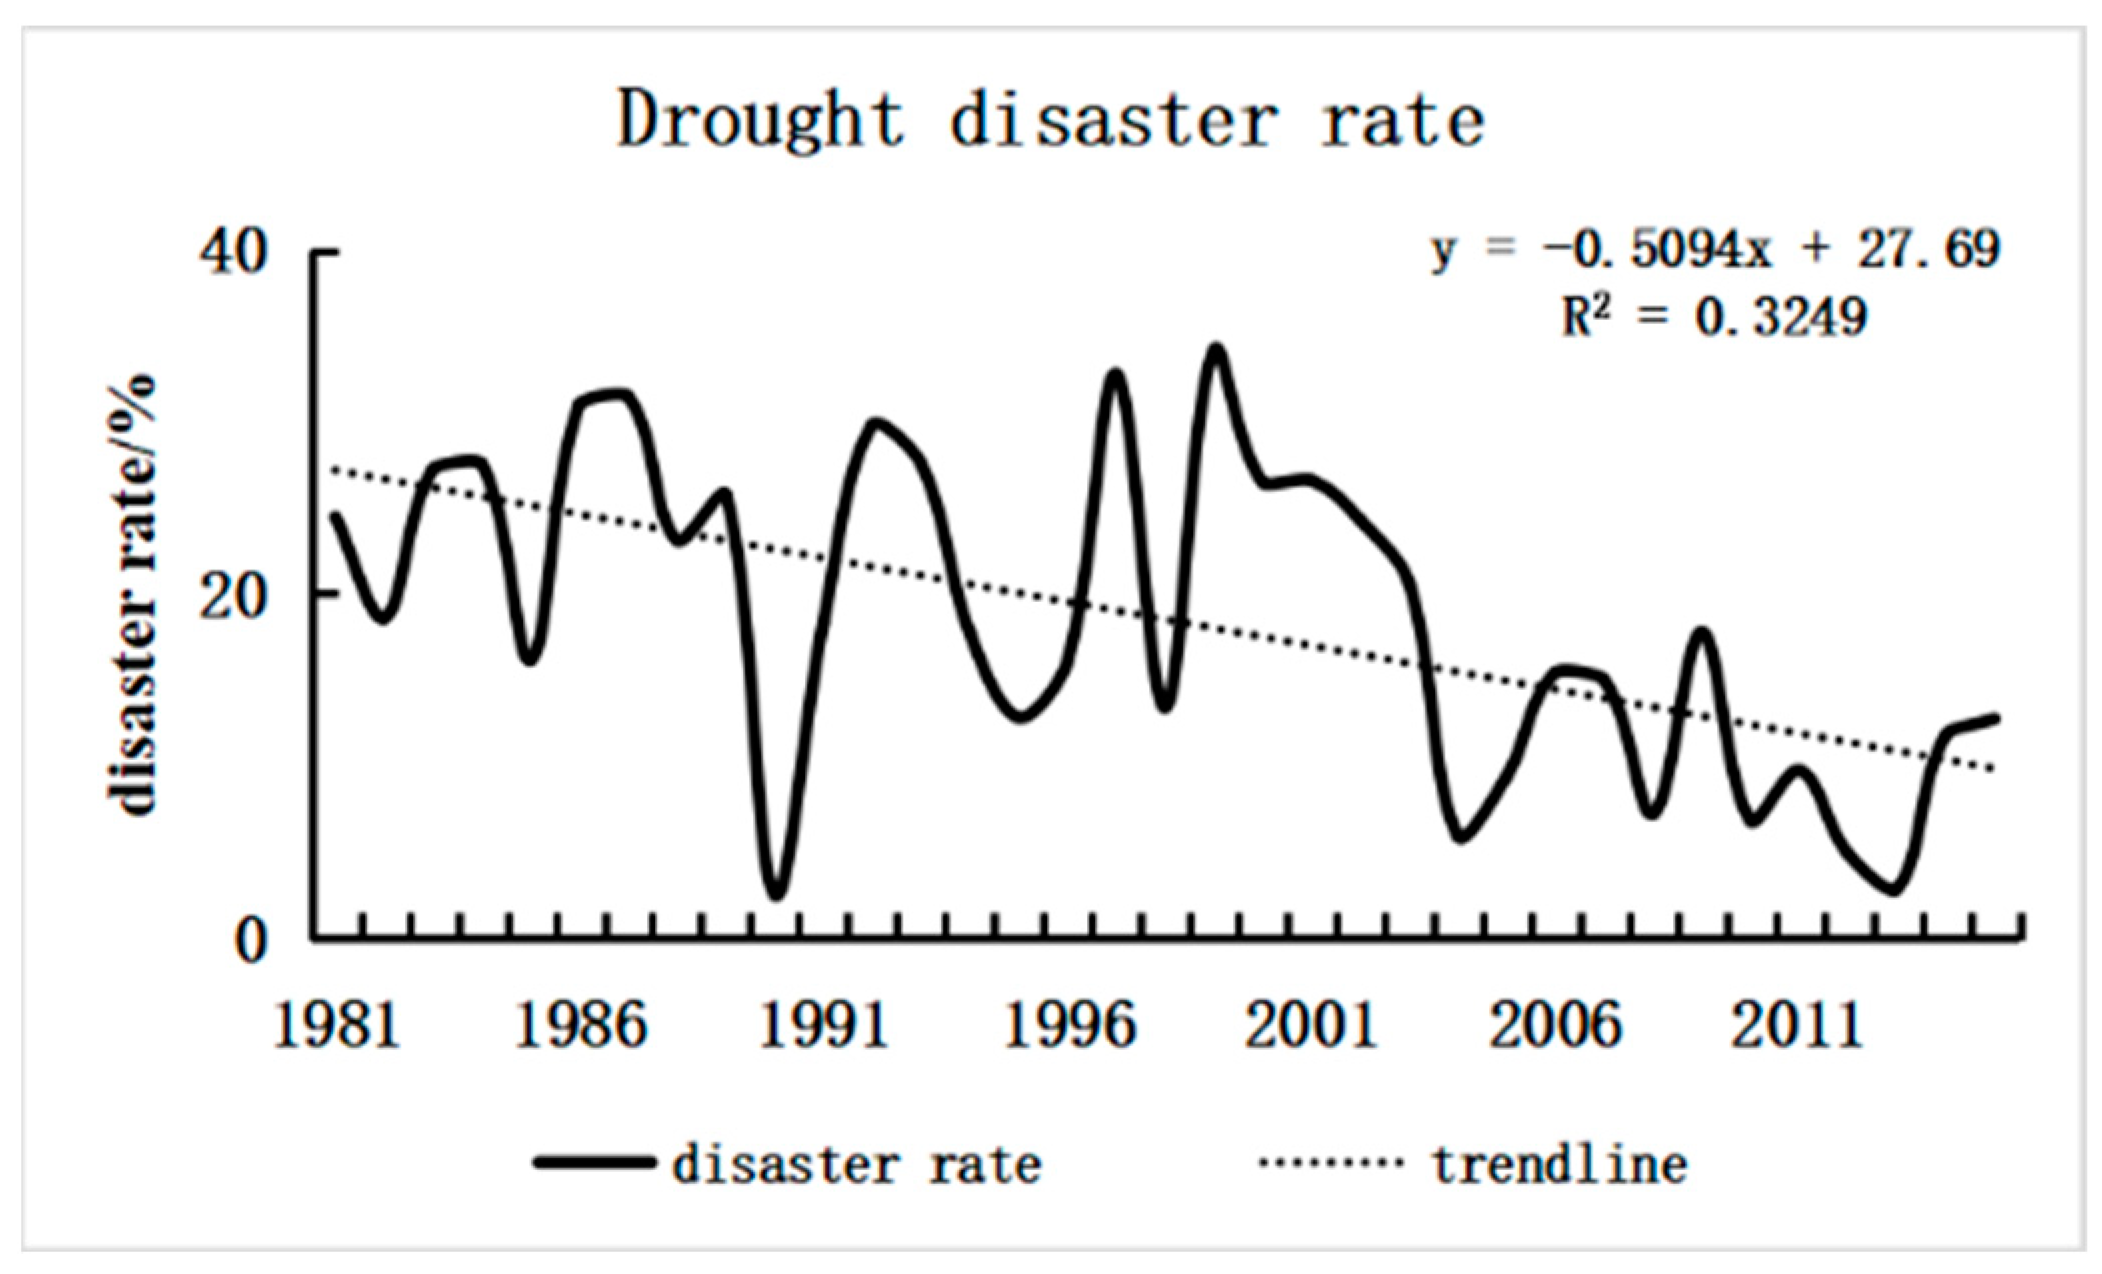
4.4. Correlation Analysis of Drought Disaster Rate with Drought Intensity and the Ratio of Drought Stations

The disaster indicator reflects the intensity of disaster-causing factors, and exposure, and is related to the vulnerability of disaster-affected bodies and human resilience [13]. Therefore, we used the disaster index of drought to conduct a correlation analysis with the drought intensity and the ratio of drought in season. The results are shown in Table 5. The drought disaster rate in Hebei Province was significantly positively correlated with the drought intensity and the ratio of drought in summer, but not significantly correlated in other seasons. Therefore, the summer drought intensity and the expansion of drought were the main reasons for the increase in the drought disaster rate. The ratio of drought and drought intensity in summer showed an increasing trend. Although the increasing trend did not pass the m-k trend test, the increasing trend was obvious. This helps for drought prevention and control in the future.
We analyzed the variation characteristics of drought disaster rate, the ratio of drought stations, and drought intensity in Hebei Province. The results showed that the drought disasters in autumn in Hebei Province significantly weakened, and the trend of drought disasters in other seasons did not reach the level of anomaly by the m-k trend test. However, the ratio of drought stations and drought intensity increased in summer. Summer drought increased by an average rate of 1.576% for the previous 10 years, and drought intensity increased at an average rate of 0.005. The drought disaster rate was significantly positively correlated with the ratio of drought and drought intensity in summer. Although the frequency of drought in summer was the lowest and was dominated by mild drought, the frequency of drought was still 26%. Moderate, severe, and extreme droughts also occur, and the frequency of moderate and severe droughts was 5.7%. The areas of high frequency of summer drought are located in Shijiazhuang, Xingtai, Cangzhou, Hengshui, Baoding, and Handan. According to the Economic Yearbook of Hebei Province, the planting area of grain crops in these five cities accounted for 74.2% of the province in 2017. Therefore, combined with the above factors, autumn and winter drought showed a decreasing trend. The characteristics and trends of summer drought were still issues, and they need special attention for drought prevention and disaster reduction.

5. Conclusions

The frequency of drought in Hebei Province was the highest in winter (43.2%), followed by spring and autumn, and the lowest in summer (26.2%). The drought characteristics were as follows: mild and moderate droughts were dominant in spring and autumn, mild droughts were dominant in summer, and severe droughts and extreme droughts occurred most frequently in winter. The spatial distribution of drought in four seasons showed different characteristics. The frequency of extreme drought in Handan and Xingtai in southern Hebei Province was higher. The ratio of drought in Hebei Province winter was highest, the influence was biggest with a ratio of 37%. In spring and autumn, the frequency of regional drought was 31 and 34%. The ratio of drought in summer was the smallest, but the frequency of regional drought was still 17%. Except for the increase of the ratio of drought in summer, it showed a decreasing trend in other seasons. The decreasing trend in autumn reached a significant level of 0.05. The drought intensity values of Hebei Province in the four seasons were all less than 1, with the largest in winter, followed by spring and autumn, and the smallest in summer, with mild drought at the regional level. The drought intensity showed an upward trend in spring and summer, a downward trend in autumn and winter. The downward trend in autumn reached a significant level of 0.05. The drought disaster rate in Hebei Province was positively correlated with summer drought intensity and the ratio of drought stations.

Author Contributions

Conceptualization, Z.T.; methodology, Z.T.; software, S.W.; validation, S.W.; formal analysis, Z.T.; investigation, S.W.; resources, Z.T.; data curation, S.W.; writing—original draft preparation, S.W.; writing—review and editing, Z.T.; visualization, Z.T.; supervision, Z.T.; project administration, Z.T.; funding acquisition, Z.T. All authors have read and agreed to the published version of the manuscript.

Funding

Funded by the National Key R & D Program “Major grain-producing areas the main meteorological disaster process and the key technology of disaster reduction and production maintenance regulation” (2017YFD0300400).

Conflicts of Interest

The authors declare no conflict of interest.

References

  1. United Nations Secretariat of the International Strategy for Disaster Reduction. Disaster Risk Reduction Frame-Work and Practices: Contributing to the Hyogo Framework for Action; UNISDR: Geneva, Switzerland, 2009. [Google Scholar]
  2. Qu, Y.; Lv, J.; Su, Z. Review and prospect of research on drought resistance and disaster reduction. J. Hydraul. Eng. 2018, 49, 115–125. (In Chinese) [Google Scholar]
  3. Huang, J.P.; Yu, H.; Dai, A.G.; Wei, Y.; Kang, L. Drylands face potential threat under 2 °C global warming target. Nat. Clim. Chang. 2017, 7, 417–422. [Google Scholar] [CrossRef]
  4. Han, H.; Liu, Z.; Liu, C.; Chen, Q.; Xie, G. Drought characteristics analysis and short-term prediction in Ji’an area from 1960 to 2018. J. Irrig. Drain. 2019, 38, 85–92. (In Chinese) [Google Scholar]
  5. Wang, M.; Wang, X.; Huang, W.; Zhang, Y.; MA, J. Spatial-temporal distribution characteristics of seasonal drought in southwest China based on relative humidity index. Trans. Chin. Soc. Agric. Eng. 2012, 28, 85–92. (In Chinese) [Google Scholar]
  6. Zhao, S.; Gong, Z.; Liu, X. Correlation analysis between vegetation cover and drought conditions in North China from 2001 to 2013. Acta Geogr. Sin. 2015, 70, 717–729. (In Chinese) [Google Scholar]
  7. Huang, D.; Peng, T.; Wang, K.; Chen, G. Analysis of results of using Z-index method to judge seasonal drought in southern China. Chin. J. Agrometeorol. 2003, 24, 12–15. (In Chinese) [Google Scholar]
  8. He, B.; Liu, Z.; Yang, X.; Sun, S. Spatio-temporal distribution characteristics of agro-meteorological disasters of major crops in China under the background of climate change (II.): Drought of major grain crops in Northwest China. Chin. J. Agrometeorol. 2017, 38, 31–41. (In Chinese) [Google Scholar]
  9. Liu, Y.; Wang, S.; Wang, J.; Wang, Z. Risk assessment of drought disasters in Southwest China under the background of climate warming. J. Nat. Resour. 2018, 33, 325–336. (In Chinese) [Google Scholar]
  10. Tian, Z.; Li, X. Analysis of drought change trend in China’s main grain-producing areas from 1949 to 2016. J. China Agric. Univ. 2019, 24, 159–167. (In Chinese) [Google Scholar]
  11. Wang, M.; Yan, J. 1960–2012Characteristics of precipitation changes and heavy flooding in the southeast coastal areas of China in 2008Harmful trendsjudgement. Earth Environ. 2015, 43, 667–674. (In Chinese) [Google Scholar]
  12. Shen, L.; He, J.; Zhou, X.; Chen, L.; Zhu, C. Study on the characteristics of summer precipitation and water vapor transport in China in the past 50 years. Acta Meteorol. Sin. 2011, 68, 918–931. (In Chinese) [Google Scholar]
  13. Wang, S.P.; Zhang, C.J.; Song, L.C.; Li, Y.H.; Feng, J.Y.; Wang, J.S. Relationship between soil redative humidity and the multiscale meteorological drought indexes. J. Glaciol. Geocryol. 2013, 35, 865–873. [Google Scholar]
  14. Wei, F. Modern Climate Statistical Diagnosis and Prediction Technology; Meteorological Press: Beijing, China, 2007; pp. 1–20. (In Chinese) [Google Scholar]
Figure 1. Interannual variation of drought disaster rate in Hebei Province.
Engproc 38 00052 g001
Figure 2. Interannual variation of the ratio of drought stations in hebei province over four seasons.
Engproc 38 00052 g002
Figure 3. Interannual variation of drought intensity in four seasons in Hebei Province.
Engproc 38 00052 g003
Table 1. High-frequency regions of spring drought in Hebei Province.
Drought LevelHigh Frequency Spring Drought Occurrence Area/City (Station)Drought Frequency/%
Mild droughtBaoding City (Baoding, Xushui, Mancheng, Li County), Hengshui City (Shenzhou, Anping, Wuqiang, Raoyang), Shijiazhuang City (Pingshan, Jinzhou, ZhaoCounty), Chengde City (Kuancheng, Chengde County), Cangzhou City (Wuqiao), Zhangjiakou City (Huai’an).31.4~40
Moderate droughtQinhuangdao City (Lulong, Qinglong, Changli, Qinhuangdao), Tangshan City (Qian’an, Luannan, Fengnan, Luanxian, Tanghai); Xingtai City (Longyao); Baoding City (Gaobeidian).17.1~25.7
Severe droughtBaoding City (Yi County, Zhuozhou), Cangzhou City (Cangzhou), Xingtai City (Wei County, Xinhe, Lincheng), Cangzhou City (Cangzhou), Hengshui City (Jizhou), Langfang City (Dachang).8.6~4.3
Extreme droughtHandan City (Yongnian, Wu’an, Jize, Handan, Ci County, Linzhang); Langfang City (Xianghe, Langfang, Wen’an, Yongqing); Xingtai City (Shahe, Guangzong, Ren County, Julu, Nanhe, Pingxiang); Tangshan City (Yutian).5.7~8.6
Table 2. High frequency regions of summer drought in Hebei Province.
Drought LevelHigh Frequency Summer Drought Occurrence Area/City (Station)Drought Frequency/%
Mild droughtBaoding City (Gaoyang, Baoding, Gaobeidian, Xiongxian, Zhuozhou); Cangzhou City (Suning, Dingzhou); Handan City (Yongnian, Jize, Qiu County); Hengshui City (Raoyang); Qinhuangdao City (Qinglong), Shijiazhuang City (Gaocheng, Yuanshi, Wuji, Luancheng), Tangshan City (Luannan, Tanghai), Xingtai City (Shahe).28.6~34.3
Moderate droughtBaoding City (Mancheng), Cangzhou City (Nanpi, Botou, Xianxian County), Dingzhou City (Dingzhou), Handan City (Cheng’an, Linzhang), Langfang City (Gu’an, Sanhe), Shijiazhuang City (Wuji, Xingtang), Tangshan City (Yutian), Xingtai City (Neiqiu, Nangong).11.4~17.1
Severe droughtBaoding City (Shunping, Li County), Cangzhou City (Qing County, Cangzhou, Yanshan), Handan City (Daming, Fengfeng, Quzhou), Hengshui City (Wuqiang, Wuyi, Shenzhou, Raoyang, Jizhou), Shijiazhuang City (Zanhuang, Shenze, Xinle), Xingtai City (Ren County, Longyao, Ningjin, Pingxiang, Xinhe, Qinghe).2.9
Extreme droughtCangzhou City (Suning, Hejian City); Hengshui City (Shenzhou, Anping, Hengshui City); Shijiazhuang City (Gaoyi, Jinzhou, Gaocheng); Xinji City (Xinji); Xingtai City (Lincheng, Baixiang, Julu).2.9
Table 3. High frequency regions of autumn drought in Hebei Province.
Drought LevelHigh Frequency Summer Drought Occurrence Area/City (Station)Drought Frequency/%
Mild droughtCangzhou City (Haixing, Renqiu), Chengde City (Weichang), Handan City (Linzhang, Ci County, Fengfeng, Feixiang, Handan, Xiangxian County, Yongnian, Jize, Qiu County), Hengshui City (Anping, Wuqiang), Shijiazhuang City (Jinzhou, Gaocheng, Zhao County), Xinji City (Xinji), Xingtai City (Shahe, Lincheng, Nangong, Ningjin, Neiqiu, Nanhe, Linxi), Zhangjiakou City (Chongli, Shangyi).31.4~42.9
Moderate droughtHandan City (Handan, Yongnian, Quzhou, Wu’an, Daming); Hengshui City (Jizhou); Xingtai City (Wei County, Julu, Qinghe, Xinhe); Zhangjiakou City (Huai’an, Zhuolu, Zhangbei).17.1~20.0
Severe droughtCangzhou City (Botou, Wuqiao, Dongguang, Xianxian County), Handan City (Guangping, Guantao, Feixiang), Hengshui City (Jizhou), Langfang City (Gu’an, Yongqing), Shijiazhuang City (Shenze), Xingtai City (Lincheng).8.6~11.4
Extreme droughtBaoding City (Tang County), Cangzhou City (Qing County), Handan City (Guantao, Daming, Wei County, Jize, Qiu County, Handan, Quzhou County), Langfang City (Dacheng), Shijiazhuang City (Luancheng, Yuanshi), Xingtai City (Linxi, Pingxiang).5.7
Table 4. High frequency regions of winter drought in Hebei Province.
Drought LevelHigh Frequency Summer Drought Occurrence Area/City (Station)Drought Frequency/%
Mild droughtBaoding City (Anguo, Yi County), Cangzhou City (Yanshan, Huanghua County), Chengde City (Xinglong, Pingquan, Chengde County), Handan City (Feixiang, Qiu County), Langfang City (Xianghe), Zhangjiakou City (Chongli), Shijiazhuang City (Luancheng, Yuanshi, Zanhuang, Jingxing), Tangshan City (Tanghai), Xingtai City (Baixiang).22.9~31.4
Moderate droughtLangfang City (Dacheng); Qinhuangdao City (Lulong, Funing, Changli City); Tangshan City (Qian’an, Tangshan, Yutian); Zhangjiakou City (Zhangjiakou, Zhuolu).20.0~25.7
Severe droughtCangzhou City (Nanpi City), Hengshui City (Zaoqiang), Qinhuangdao City (Funing, Changli City), Tangshan City (Luan County, Luannan, Fengnan, Tanghai), Zhangjiakou City (Zhangbei).11.4~14.3
Extreme droughtBaoding City (Quyang, Xiong County), Cangzhou City (Cangzhou, Hejian County, XianXian County), Hengshui City (Anping, Hengshui, Wuyi, Shenzhou, Raoyang, Fucheng), Shijiazhuang City (Zhao County, Zhengding, Luancheng, Jinzhou, Gaoyi), Xinji City (Xinji), Xingtai City (Ningjin, Baixiang, Longyao, Neiqiu, Nanhe).20.0~22.9
Table 5. Correlation analysis of drought disaster rate with drought intensity and the ratio of drought stations.
ProjectDrought Intensitythe Ratio of Drought Stations
SpringSummerAutumnWinterSpringSummerAutumnWinter
disaster rate of droughtPearson relevance0.2470.398 *0.0260.3250.3260.496 **0.1880.32
Significance (bilateral)0.1530.0180.8830.0570.0560.0020.2790.061
Note: **. Significant correlation at the 0.01 level (bilateral); *. Significant correlation at the 0.05 level (bilateral). Discussion.
Disclaimer/Publisher’s Note: The statements, opinions and data contained in all publications are solely those of the individual author(s) and contributor(s) and not of MDPI and/or the editor(s). MDPI and/or the editor(s) disclaim responsibility for any injury to people or property resulting from any ideas, methods, instructions or products referred to in the content.

