Abstract
A downflow hanging sponge (DHS) unit was established for treating synthetic domestic wastewater (SDW) for over 100 days of continuous feed. The DHS system was operated at a chemical oxygen demand (COD) concentration of 531.62 ± 93.6 mg/L, and different hydraulic retention times (HRTs) = 6.0–2.0 h to determine the system kinetics. The substrate removal kinetics of the DHS reactor was calculated using modified Stover–Kincannon, Monod, Grau’s second-order and first-order models. The Monod model has the following decay coefficient (Kd), yield coefficient (Y), and maximum specific growth rate of bacteria (μmax) that were, respectively, 0.0025 1/d, 0.1337 gVSS/gCOD, and 0.0364 1/d. Maximum substrate utilization rate (Umax) and saturation value constant (KB) for the modified Stover–Kincannon model were determined to be, respectively, 15.46 and 14.45 g/L/d. While the kinetic coefficient for the second-order model ranged was 0.516–0.641 1/d versus 27.627 1/d for the first-order model, the constants of the Grau second-order model (a and b) were estimated as 0.0366 and 0.9215. The Grau second-order and modified Stover–Kincannon models showed an R2 value of 0.995, making them the most convenient for the experimental results. The results indicated that these models could be used to predict the DHS reactor behavior at different scales.
1. Introduction
Selecting effective wastewater treatments is crucial, particularly in undeveloped nations with limited resources, little experience, and a lack of skilled staff [1]. Downflow hanging sponge (DHS) technology is considered a practical solution for easing sewage issues because it is simple to implement, has low treatment costs, and discharges a small quantity of sludge [2]. The DHS unit is built on the idea of a conventional trickling filter, but rather than utilizing rocks, gravel, or plastic pieces, it uses sponge holders with high porosity [3]. The sponge media have a huge capacity to hold a lot of activated biomasses on top of and inside the sponges, allowing the microbial plants in the reactor to grow and create biofilms. Environmental engineers are presently using kinetic models to help with the design and optimization of wastewater treatment systems. To manage and evaluate the DHS reactor performance, experimental results should be organized and governed by kinetic models within a certain framework [4]. The removals of COD and nitrogen in many reactors have been studied using a variety of kinetic models. Grau’s second-order, Monod, Stover–Kincannon, and first-order were widely used to calculate the substrate removal rate [5].
Despite the increasing number of kinetic models for numerous reactor types, the DHS system for domestic wastewater treatment has not been investigated to evaluate kinetic models [6]. The kinetic parameters and the interactions between many factors in the DHS unit treating domestic wastewater are not fully understood. Kinetic models were used in the current work to determine the COD elimination rate. The results of the kinetic models would evaluate the DHS performance for large-scale applications.
2. Materials and Methods
2.1. Characteristics of Influent Wastewater
Synthetic wastewater (Table 1) was prepared to simulate the domestic wastewater characteristics [7].

Table 1.
Synthetic domestic wastewater (SDW) characteristics.
2.2. Configuration of DHS Reactor
Figure 1 depicts the graphical layout of the pilot-scale DHS. The cylindrical reactor was composed of polymethyl methacrylate and measured 1.5 m × 0.15 m (height × diameter). The DHS was filled with 250 sponge pieces; each sponge has 0.63 mm-wide pores, 3.20 cm height, and a 1.60 cm radius. It has a specific surface area of 250 m2/m3, a density of 30 kg/m3, and a porosity of 90% [8].
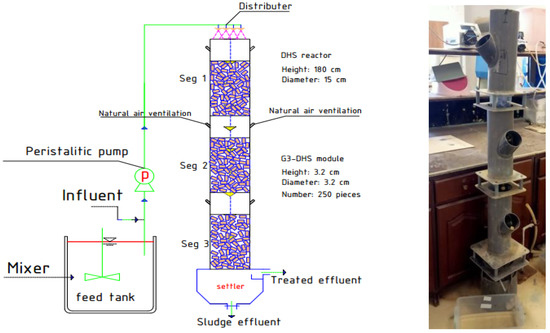
Figure 1.
Configuration of the DHS unit utilized to treat SDW.
2.3. Reactor Operation
Before beginning the experimentation, the DHS system was operated for half a month until stable effluent COD and NH3 concentrations (within 6% change for three sequential readings) are achieved. The DHS reactor was operated by increasing the flow rate from 20.4 to 61.2 L/d, corresponding to various hydraulic retention time (HRT) conditions (Table 2).
Table 2.
Operational conditions of DHS reactor.
2.4. Analytical Methods
COD was analyzed from the effluent and the influent three times per week to assess reactor performance. Analyses were carried out according to the “Standard Method for Examination of Water and Wastewater” by APHA [9].
2.5. Kinetic Modeling for Substrate Removal
2.5.1. Monod Model
In the DHS reactor with no biomass recycling, the rate of change in biomass and substrate concentrations are given by Equations (1) and (2), respectively [10]:
At a steady-state condition (dX/dt = 0), and the influent biomass concentration can be ignored (Xi = 0), Equation (3) can be obtained:
Hence, the average solid retention time (SRT) is given by Equation (4):
(−rsu/X) equals the specific substrate utilization rate (U), measured as Equation (5):
From Equations (4) and (5), a new form is obtained (Equation (6)):
By graphing Equation (6), Y and Kd parameters can be determined.
Equation (7) can express the following correlation among the specific growth rate (μ), the rate-limiting substrate concentration, and SRT:
From these equations, Equation (8) can be derived:
Plotting Equation (10) gives the values of µmax and Ks:
Also, Equation (11) is applied to predict COD concentration in the final effluent:
where rsu refers to substrate utilization rate (g/L/day), and Ks is a half-saturation constant.
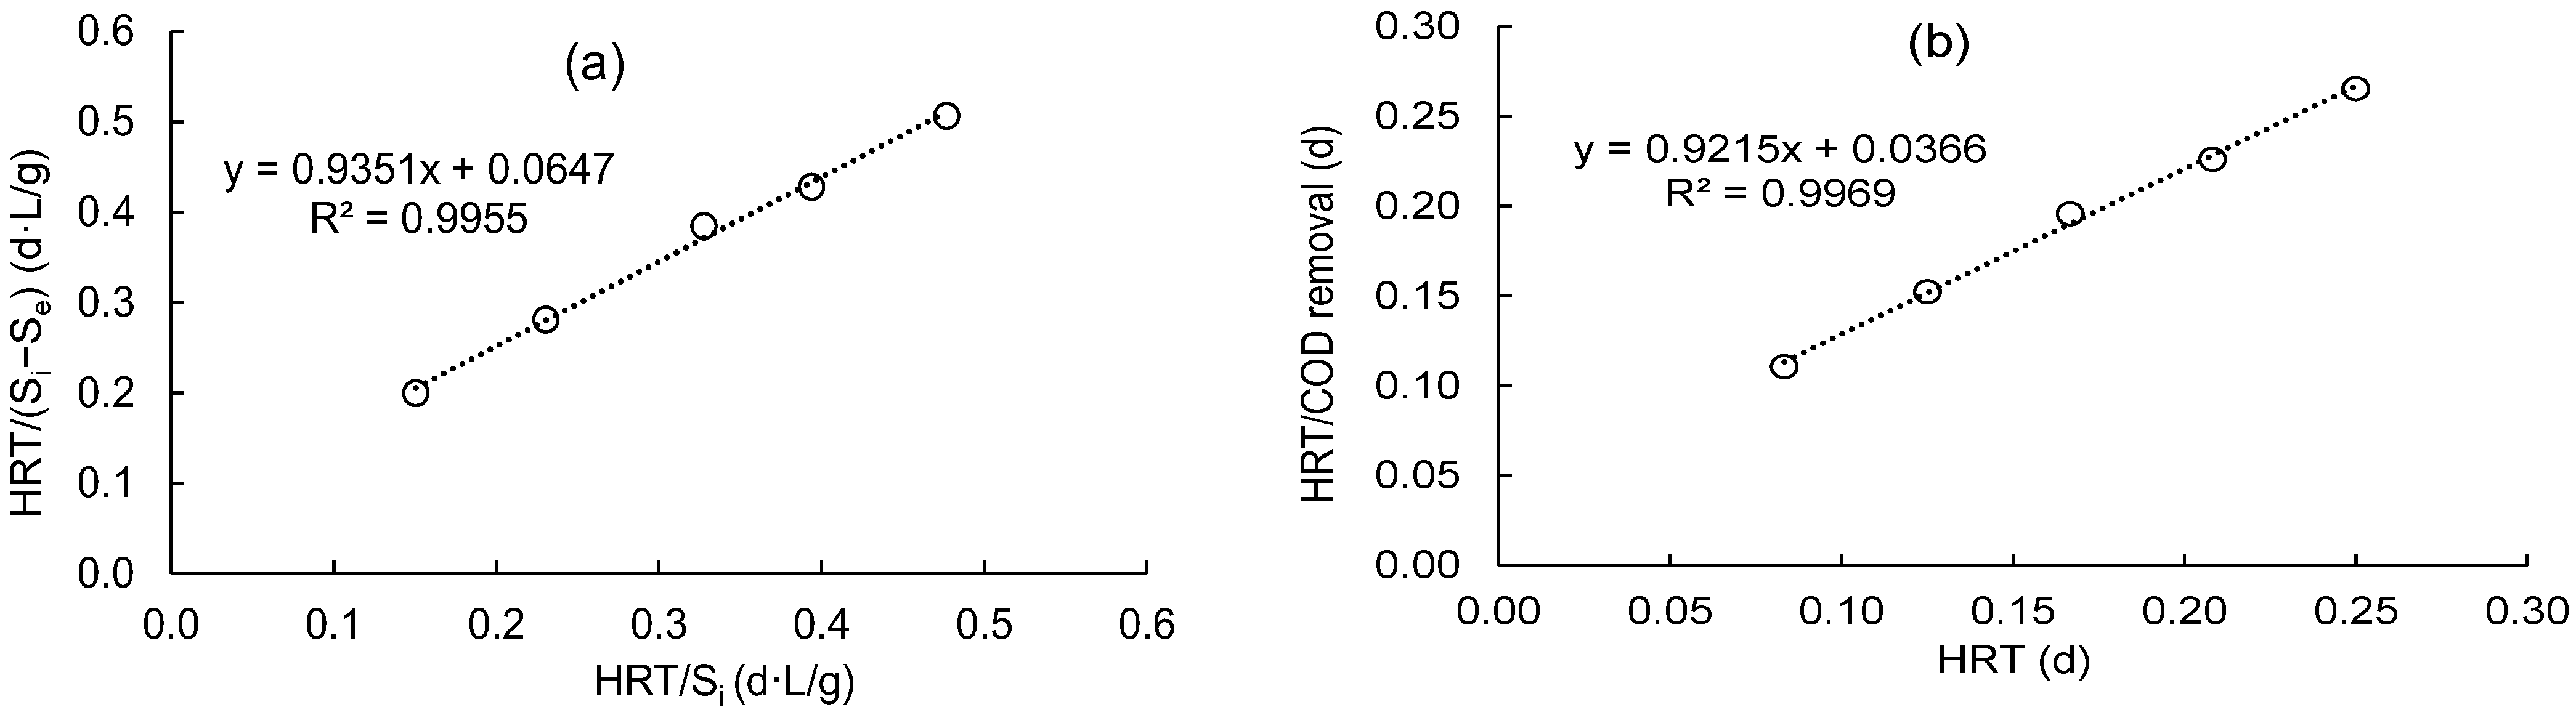
2.5.2. Modified Stover–Kincannon Model
This model has the unique property of expressing the rate of substrate utilization as a function of the organic loading rate under a steady state. Based on the substrate removal rate as a function of substrate concentration, the removal of the organic substrate in the aerobic reactors may be calculated (Equations (12) and (13)):
where ds/dt refers to the removal rate of COD (g/L/d), V is the actual volume of the DHS reactor
The aforementioned Equation (13) is linearized as follows (Equation (14)):
By plotting the HRT/(Si − Se) vs. the HRT/Si, KB/Uₘₐₓ is the slope while 1/Umax gives the intercept of the straight line. The effluent substrate may be measured by Equation (15):
2.5.3. Grau’s Second-Order Model
The model’s equation is written as:
Equation (16) can be linearized and simplified as Equation (17):
Since Si/K2 × X is constant and (Si − Se)/Si reflects the effectiveness of COD elimination, Equation (18) can be given:
The constants a and b could be determined from a straight line on a plot between HRT and HRT/COD removal, where “a” can be calculated by ().
HRT is utilized to predict the final effluent of COD concentration according to Equation (19):
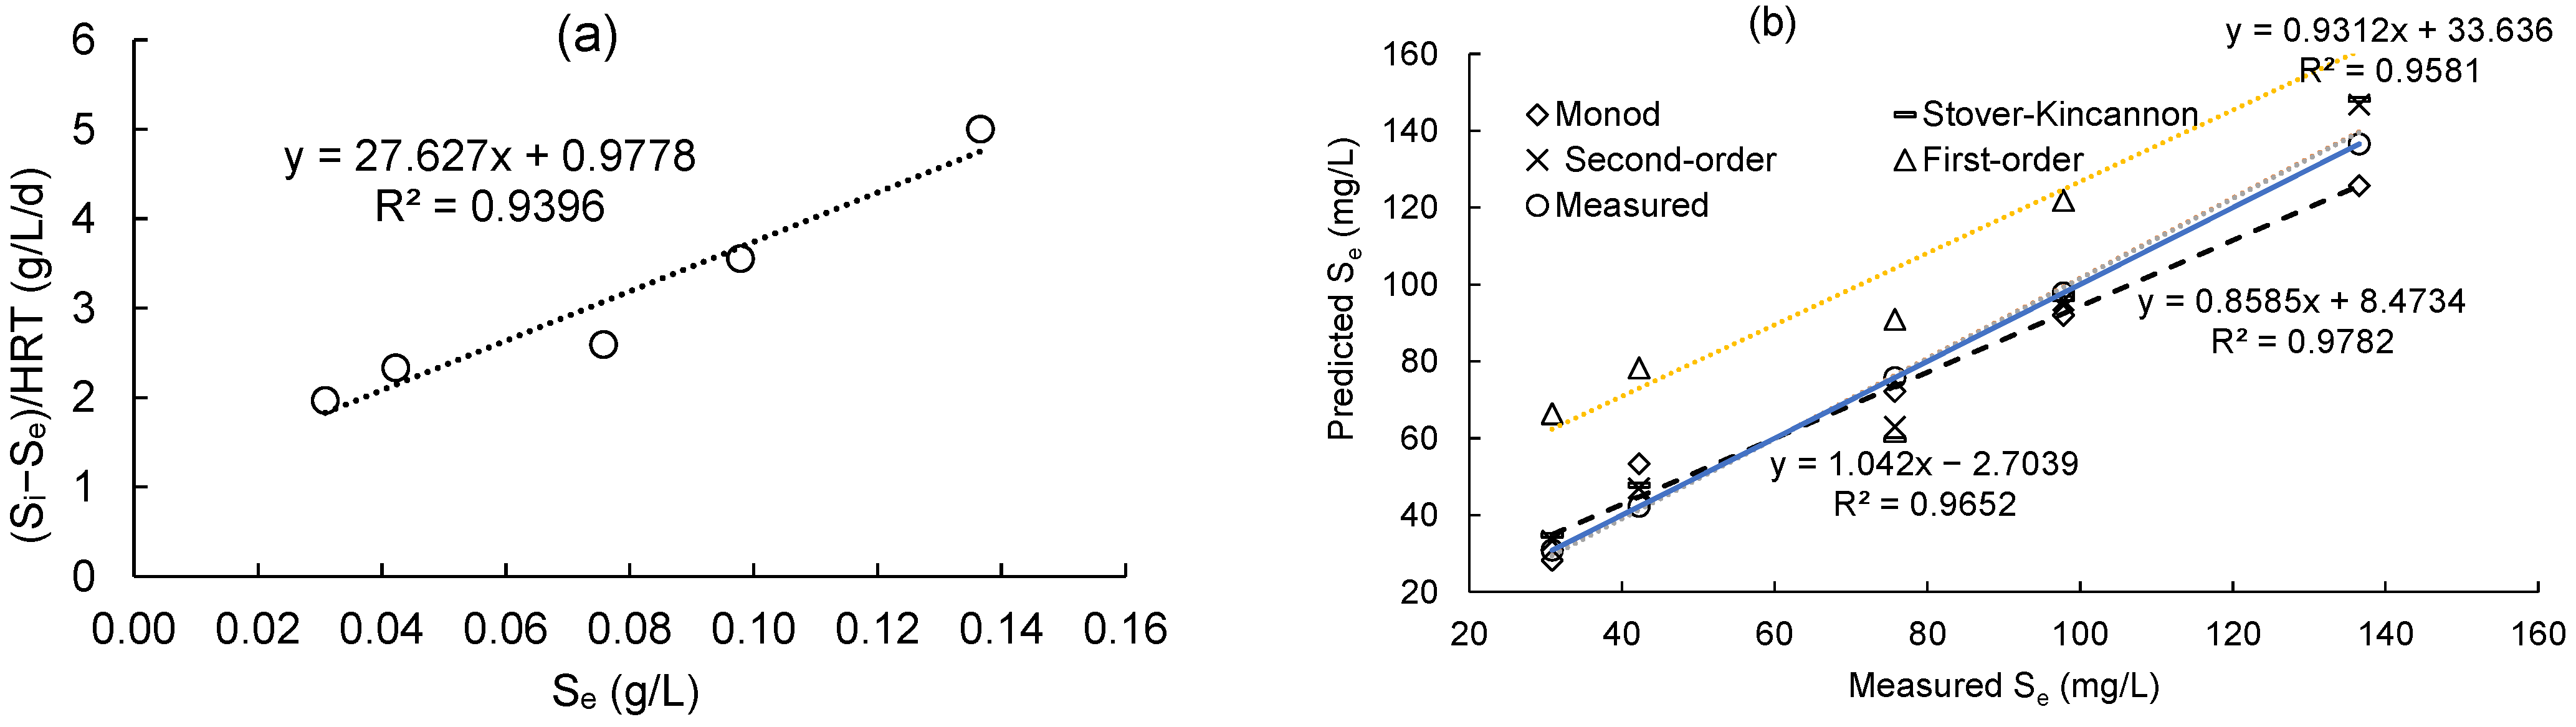
2.5.4. First-Order Substrate Removal Model
By applying the first-order model for substrate removal, the rate of variation in substrate content in the reactor can be represented as Equation (20):
At pseudo-steady-state conditions where the rate of change in substrate content owing to accumulation (−dS/dt) is minimal, Equation (21) can be obtained:
Plotting (Si − Se)/HRT against Se in Equation (21) is used to obtain the value of K1 and
Equation (22) is applied to predict the effluent COD concentration.
3. Results and Discussion
3.1. Monod Model
As shown in Figure 2a, the relationship between the (1/SRT) and (U) was plotted to calculate (Y) and (kd). The intercept and slope of the straight line seen in Figure 2a were used to estimate the Y and kd values, which were determined to be 0.1337 g VSS/g COD and 0.0025 1/d, respectively, while the values of (µmax) and (KS) were calculated from Figure 2b as 0.036 1/d and 0.085 g COD/L, respectively. This was achieved by graphing 1/Se versus SRT/(1 + Kd × SRT). Also, the correlation coefficient for the Monod model was in the range of 0.9272 to 0.8201.
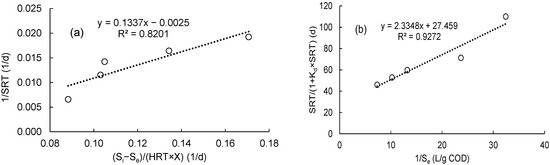
Figure 2.
Determination of the kinetic constants using a linear plot of the Monod model: (a) kd and Y; (b) µmax and Ks.
According to Equation (11), the equation for calculating the effluent COD concentration based on SRT is defined as Equation (23):
3.2. Modified Stover-Kincannon Model
Figure 3a displays a graph plot between the HRT/Si against the HRT/(Si − Se) for calculating Umax and KB values for synthetic domestic wastewater treatment using a DHS unit. It is highly supported by a straight line with a coefficient of regression of 0.995 that this model is valid. The calculated values for the kinetic coefficient (KB) and maximum COD removal rate (Umax) are 14.45 and 15.46 g/L/d, respectively. Hence, Equation (24) can be used to predict effluent COD values.
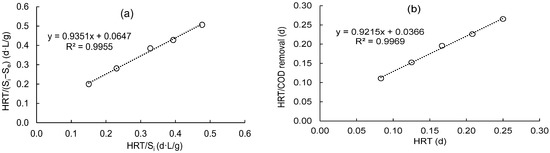
Figure 3.
Determine the kinetic constants of (a) KB and Umax using the modified Stover–Kincannon model; (b) “a” and “b” using a Grau second-order model.
3.3. Grau’s Second-Order Model
Figure 3b displays the plot of this model for the removal of COD by the DHS reactor. The intercept and slope of the straight line could be utilized to determine the “a” and “b” coefficients. Both “a” and “b” were estimated to have values of 0.037 and 0.922, respectively, with a high correlation coefficient (R2 = 0.997). This demonstrates the model’s applicability for simulating the treatment of synthetic domestic wastewater in a DHS reactor. Hence, the effluent COD concentration could be predicted using Equation (25):
and the removal efficacy of the COD is described by Equation (26):
3.4. First-Order Substrate Removal Model
Figure 4a displays the plot of the first-order model for substrate removal by the DHS reactor. For this model, the (Si − Se)/HRT values were plotted against the matching Se values in order to obtain a straight line. The values of k1, which were calculated to be 27.627 1/d, are reflected in the line’s slope. The correlation coefficient (R2) was high, 0.9396, suggesting that the first-order model is suitable with reasonable accuracy for the DHS reactor. From Equation (22), the formula for predicting the final effluent of COD concentration is presented in Equation (27):
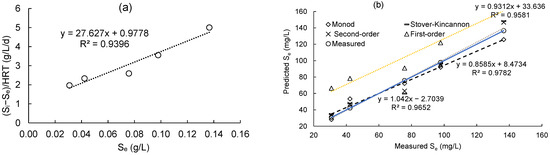
Figure 4.
(a) COD removal plot by first-order model; (b) linear correlation between predicted values and measured values.
3.5. Prediction Performance of DHS System Using the Kinetic Parameters
The models’ accuracies were further assessed by comparing the experimental data of the lab-scale DHS system with the predicted COD concentrations computed from several models by Equations (23)–(27). According to Figure 4b, there is a strong correlation (>96%) between the COD concentrations predicted by the Grau second order, Stover–Kincannon, and Monod models and the actual COD concentrations obtained from the DHS system. As a result, it is possible to predict the effluent COD value of the DHS system by the kinetic constants of these models.
4. Conclusions
In this work, the kinetics of the DHS reactor treating SDW was examined by a variety of models, including first- and second-order kinetic, modified Stover–Kincannon, and Monod models. For estimating the performance of a lab-scale DHS system along with substantial kinetic coefficients, modified Stover–Kincannon, and Grau second-order kinetic models were discovered to be more appropriate than the other applicable models, with correlation values of 0.99. The microbial kinetics of the DHS system was likewise found to be adequately expressed by a Monod-type kinetic model with a correlation coefficient of 0.9272. Despite having a strong first-order correlation coefficient (0.9396), it was not acceptable for predicting how well the DHS system would perform. If the SDW was treated under equivalent loading circumstances and wastewater characteristics, the outcomes of the kinetic studies calculated from the lab-scale DHS system could be utilized to predict the performance of full-scale DHS systems.
Author Contributions
A.Z.: methodology, formal analysis, writing—original draft; M.G.I.: supervision, conceptualization, writing—review and editing; M.F.: supervision, visualization, writing—review; M.N.: supervision, visualization, writing—review and editing. All authors have read and agreed to the published version of the manuscript.
Funding
Funds were partially granted by Egypt–Japan University of Science and Technology (EJUST) and the Japan International Cooperation Agency (JICA).
Institutional Review Board Statement
Not applicable.
Informed Consent Statement
Not applicable.
Data Availability Statement
All data generated or analyzed during this study are included in thepublished article.
Acknowledgments
The first author appreciates the Egyptian Ministry of Higher Education (MoHE) for awarding a Master’s degree scholarship. In addition, many thanks to the Japan International Cooperation Agency (JICA) for providing all the facilities and equipment necessary to conduct this study.
Conflicts of Interest
The authors declare no conflict of interest.
References
- Sorour, M.H.; El Defrawy, N.M.H.; Shaalan, H.F. Treatment of agricultural drainage water via lagoon/reverse osmosis system. Desalination 2003, 152, 359–366. [Google Scholar] [CrossRef]
- Fleifle, A.; Tawfik, A.; Saavedra, O.; Yoshimura, C.; Elzeir, M. Modeling and profile analysis of a down-flow hanging sponge system treating agricultural drainage water. Sep. Purif. Technol. 2013, 116, 87–94. [Google Scholar] [CrossRef]
- Uemura, S.; Suzuki, S.; Abe, K.; Kubota, K.; Yamaguchi, T.; Ohashi, A.; Takemura, Y.; Harada, H. Removal of organic substances and oxidation of ammonium nitrogen by a down-flow hanging sponge (DHS) reactor under high salinity conditions. Bioresour. Technol. 2010, 101, 5180–5185. [Google Scholar] [CrossRef] [PubMed]
- Alalm, M.G.; Nasr, M. Treatment of water contaminated with diazinon by electro-fenton process: Effect of operating parameters, and artificial neural network modeling. Desalination Water Treat. 2020, 182, 277–287. [Google Scholar] [CrossRef]
- Nasr, M. Modeling Applications in Environmental Bioremediation Studies. In Phytobiont and Ecosystem Restitution; Kumar, V., Kumar, M., Prasad, R., Eds.; Springer: Singapore, 2018. [Google Scholar]
- Zidan, A.; Nasr, M.; Fujii, M.; Ibrahim, M.G. Environmental and Economic Evaluation of Downflow Hanging Sponge Reactors for Treating High-Strength Organic Wastewater. Sustainability 2023, 15, 6038. [Google Scholar] [CrossRef]
- Kapdan, I.K.; Erten, B. Anaerobic treatment of saline wastewater by Halanaerobium lacusrosei. Process Biochem. 2007, 42, 449–453. [Google Scholar] [CrossRef]
- Hung, N.T.; Nguyen, T.H. Kinetic modeling of organic and nitrogen removal from domestic wastewater in a down-flow hanging sponge bioreactor. Environ. Eng. Res. 2019, 25, 243–250. [Google Scholar]
- APHA (American Public Health Association). Standard Methods for the Examination of Water and Wastewater, 21st ed.; American Public Health Association: Washington, DC, USA, 2005. [Google Scholar]
- Monod, J. The growth of bacterial cultures. Annu. Rev. Microbiol. 1949, 3, 371–376. [Google Scholar] [CrossRef]


Disclaimer/Publisher’s Note: The statements, opinions and data contained in all publications are solely those of the individual author(s) and contributor(s) and not of MDPI and/or the editor(s). MDPI and/or the editor(s) disclaim responsibility for any injury to people or property resulting from any ideas, methods, instructions or products referred to in the content. |
© 2023 by the authors. Licensee MDPI, Basel, Switzerland. This article is an open access article distributed under the terms and conditions of the Creative Commons Attribution (CC BY) license (https://creativecommons.org/licenses/by/4.0/).