Abstract
Fourier transform infrared (FTIR) spectroscopy is a non-invasive technique that is largely used for studying lipidomics. Lipids are a primary class of biological molecules that play numerous vital roles in various processes. In the present work, we adopted FTIR spectroscopy for monitoring the lipid extraction efficiency of different methods used for extracting lipids from hepatocarcinoma cells. The spectra acquired from samples obtained with the selected methods showed the contributions of different functional groups. A qualitative comparison indicated that all the spectra exhibited similar lipid species profiles. The peak intensity attributed to the CH2 asymmetric stretching mode has been used for a quantitative comparison of the efficiency of the different extraction methods.
1. Introduction
Lipids are a primary class of biological molecules that play numerous vital roles in various processes [1]. A powerful technique used for lipids detection and characterization in biological samples is Fourier Transform Infrared (FTIR) spectroscopy [2]. In the present paper, we adopted FTIR spectroscopy to monitor the efficiency of lipid extraction procedures from human cells. In particular, FTIR spectroscopy has been employed for characterizing four different methods [3,4,5,6] using HepG2 cells that are largely used in many biomedical research fields [7]. Infrared spectra have been obtained in the 4000–800 cm−1 wavenumber region, and the contributions of different functional groups have been evidenced. For a quantitative comparison of the efficiency of the different extraction methods, the intensities of the peak attributed to CH2 asymmetric stretching mode and related to lipid contributions have been estimated.
2. Materials and Methods
2.1. Cell Growth
Human hepatocellular carcinoma cells (HepG2) were obtained from Sigma-Aldrich (Milan, Italy). Cells were cultured in Dulbecco’s Modified Eagle Medium (DMEM). The medium was supplemented with 10% heat-inactivated FBS, 100 U/mL penicillin, 100 μg/mL streptomycin, and 1% L-glutamine. The cells were grown in a humidified atmosphere of 95% air/5% CO2 at 37 °C in T25 flasks. Cells at 80% confluence were removed from the flasks by trypsinization and pelleted by centrifugation (1200 rpm × 5 min).
2.2. Lipid Extraction Methods
Four different extraction methods were examined [3,4,5,6]. For brevity, they were named BUMOD, B&D, SAI, and SHA. For preparing samples by using the BUMOD method, cell pellets were collected into the test tube. Butanol/methanol (300 µL, [3:1], v/v) was added to the test tube, and the solution was vortexed for 1 min. Heptane/Ethyl Acetate (150 µL, [3:1], v/v) was added to the tube, and the solution was vortexed again for another minute. Then, 150 µL heptane/Ethyl Acetate was added, and after vortexing for 1 min, 300 µL of 50 mM LiCl was added to the test tube to induce phase separation. The resulting solution was vigorously vortexed for 1 min and then centrifuged at 2700 rpm for 10 min. The upper organic layer was collected and placed into a new test tube. The remaining aqueous layer was re-extracted with 320 µL of heptane/Ethyl Acetate [3:1], then with 250 µL of the same solvent. After each addition of heptane/Ethyl Acetate, the solution mixture was vortexed and centrifuged at 2700 rpm for 10 min, and the resulting upper organic layers were collected and combined with the previous organic layer. The lipid extract was dried with nitrogen and stored at −20 °C [3].
For the B&D method, for each 1 mL of sample, 3.75 mL 1:2 (v/v) CHCl3:MeOH were added and vortexed well. Then, 1.25 mL CHCl3 was added and vortexed well. Finally, the sample was added with 1.25 mL of dH2O, vortexed well, and centrifuged at 1000 rpm for 5 min at room temperature to give a two-phase system (aqueous top and organic bottom). The bottom phase was recovered with Pasteur pipettes into a clean glass vial, dried with nitrogen, and stored at –20 °C until measurements [4].
For the SAI method, cell pellets were mixed with 2 mL of isopropanol:water: ethyl acetate (30:10:60 v:v:v), vortexed, sonicated twice at 20 Hz for 20 s each, and centrifuged (10 min at 4000 rpm) at 24 °C. The supernatant containing lipid extracts was recovered, and 1 mL aliquot of the sample was transferred into a glass vial, dried with nitrogen, and stored at −20 °C until measurements [5].
For the SHA method, cell pellets were added with 0.5 mL of CH3OH and 0.25 mL of CHCl3, and the solution was sonicated at room temperature for the 30 s. This single-phase mixture was incubated at 48 °C overnight in a heating block. After cooling, 75 μL of 1 M KOH in CH3OH was added and, after brief sonication, incubated in a shaking water bath for 2 h at 37 °C. A 0.4 mL aliquot was transferred to a new test tube to serve as the “single-phase extract” (which was centrifuged to remove the insoluble residue, the supernatant collected, the residue reextracted with 1 mL of CH3OH:CHCl3, 1:2, v:v, centrifuged, and the supernatants combined). Next, 1 mL of CHCl3 and 2 mL of H2O were added to the remaining original extract and then centrifuged; finally, the lower organic layer was transferred to a new tube. The upper phase was extracted with 1 mL of CHCl3, which was added to the organic-phase extract. The solvents were removed from the single-phase extract, and the organic-phase extract and the dried residues were stored at −20 °C until measurement [6].
2.3. FTIR Measurements
For FTIR analysis, the lipid extracts were resuspended in methanol, and drops of a few microliters were placed on CaF2 windows and used for the spectra acquisition in transmittance mode. FTIR spectra were obtained using a Perkin Elmer Spectrum One spectrometer. All spectra were collected using 64 scans in the range from 4000 to 1000 cm−1 with a 4 cm−1 spectral resolution.
For a preliminary quantitative comparison of the efficiency in lipid extraction of the different methods, the intensity of the peak located around 2922 cm−1 and related to the symmetric stretching vibration of the CH2 group was assumed to be the indicator of extraction efficiency. To make this comparison, the background was subtracted, and a Standard Normal Variate (SNV) normalization was performed [8].
3. Results and Discussion
Figure 1 shows the FTIR spectra of lipids acquired from the B&D method [4]. The contributions due to functional groups related to lipids are evident. Table 1 summarizes the assignments of all the main peaks present in the spectra. Additionally, the spectra obtained from the samples extracted using the other methods show similar behavior.
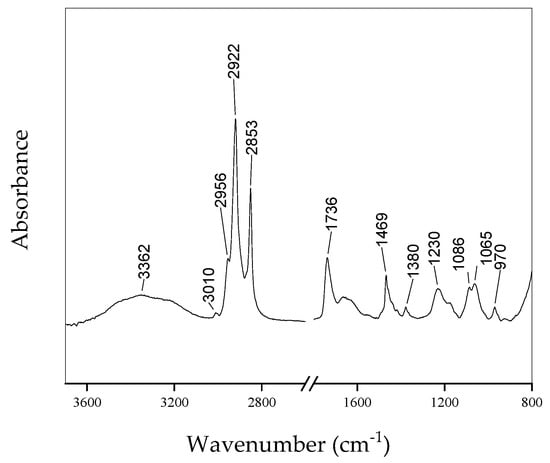
Figure 1.
Typical FTIR spectrum of lipid extract from HepG2cells using B&D method.

Table 1.
Main peaks are present in the spectra of Figure 1 and assignments according to Refs. [9,10].
Figure 2 shows the high-wavenumber region of the spectra acquired from lipids extracted from HepG2 cells using the above-mentioned different procedures. When these spectra are compared, and the intensity of the peak located at 2922 cm−1 is assumed as an indicator of extraction efficiency, it is evident that the B&D method can be considered the most efficient. This result is confirmed by evaluating the intensity of the 2870–2850 cm−1 band as suggested in the literature [11,12].

Figure 2.
High-wavenumber region of average spectra acquired from lipid samples extracted using the four different procedures.
4. Conclusions
In the present paper, we investigated the efficiency in lipid extraction from HepG2 cells by using four different methods by FTIR spectroscopy. The spectra acquired from lipid samples obtained using such procedures show similar features. The peak intensity, located around 2922 cm−1 and assigned to the symmetric stretching vibration of the CH2 group, indicates that the B&D method using chloroform/methanol/water is the most efficient in terms of selectivity. It is characterized by the highest efficiency and can be considered the “gold standard” for lipid analysis. Further investigations are in progress to confirm these results. The BUMOD method is a new rapid, straightforward, chloroform-free method, therefore advantageous in terms of health and environment for total lipid extraction, which allows overcoming the risk of sample contamination because lipids are recovered from the upper organic layer. The SHA method requires a long extraction period and is more sensitive to sphingolipids. Finally, the SAI method is a single-phase extraction that could be recommended for simplicity, automation, low solvent consumption, and economy.
Author Contributions
Conceptualization, M.L., M.P., N.D. and L.M.; methodology, L.M., M.M., M.P., B.F. and V.C.; software, B.F. and V.C.; sample preparation, L.M. and M.M.; investigation, M.P., M.L., B.F. and M.M.; data curation, B.F., M.P. and V.C.; writing—original draft preparation, B.F., M.L. and M.M.; writing—review and editing, B.F., M.L., M.P. and N.D. All authors have read and agreed to the published version of the manuscript.
Funding
This research received no external funding.
Data Availability Statement
Data are available on request.
Conflicts of Interest
The authors declare no conflict of interest.
References
- Muro, E.; Atilla-Gokcumen, G.E.; Eggert, U.S. Lipids in cell biology: How can we understand them better? Mol. Biol. Cell 2014, 25, 1819–1823. [Google Scholar] [CrossRef] [PubMed]
- Baker, M.J.; Trevisan, J.; Bassan, P.; Bhargava, R.; Butler, H.J.; Dorling, K.M.; Fielden, P.R.; Fogarty, S.W.; Fullwood, N.J.; Heys, K.A.; et al. Using Fourier transform IR spectroscopy to analyze biological materials. Nat. Protoc. 2014, 9, 1771–1791. [Google Scholar] [CrossRef] [PubMed]
- Cruz, M.; Wang, M.; Frisch-Daiello, J.; Han, X. Improved butanol–methanol (BUME) method by replacing acetic acid for lipid extraction of biological samples. Lipids 2016, 51, 887–896. [Google Scholar] [CrossRef] [PubMed]
- Bligh, E.G.; Dyer, W.J. A rapid method of total lipid extraction and purification. Can. J. Biochem. Physiol. 1959, 37, 911–917. [Google Scholar] [CrossRef] [PubMed]
- Saini, R.K.; Prasad, P.; Shang, X.; Keum, Y.S. Advances in Lipid Extraction Methods—A Review. Int. J. Mol. Sci. 2021, 22, 13643. [Google Scholar] [CrossRef] [PubMed]
- Shaner, R.L.; Allegood, J.C.; Park, H.; Wang, E.; Kelly, S.; Haynes, C.A.; Sullards, M.C.; Merrill, A.H. Quantitative analysis of sphingolipids for lipidomics using triple quadrupole and quadrupole linear ion trap mass spectrometers. J. Lipid Res. 2009, 50, 1692–1707. [Google Scholar] [CrossRef] [PubMed]
- Donato, M.T.; Tolosa, L.; Gómez-Lechón, M.J. Culture and functional characterization of human hepatoma HepG2 cells. In Protocols in In Vitro Hepatocyte Research; Springer: Berlin/Heidelberg, Germany, 2015; pp. 77–93. [Google Scholar]
- Gautam, R.; Vanga, S.; Ariese, F.; Umapathy, S. Review of multidimensional data processing approaches for Raman and infrared spectroscopy. EPJ Tech. Instrum. 2015, 2, 1–38. [Google Scholar] [CrossRef]
- Talari, A.C.S.; Martinez, M.A.G.; Movasaghi, Z.; Rehman, S.; Rehman, I.U. Advances in Fourier transform infrared (FTIR) spectroscopy of biological tissues. Appl. Spectrosc. Rev. 2017, 52, 456–506. [Google Scholar] [CrossRef]
- Movasaghi, Z.; Rehman, S.; ur Rehman, D.I. Fourier transform infrared (FTIR) spectroscopy of biological tissues. Appl. Spectrosc. Rev. 2008, 43, 134–179. [Google Scholar] [CrossRef]
- Strug, I.; Utzat, C.; Cappione, A.; Gutierrez, S.; Amara, R.; Lento, J.; Capito, F.; Skudas, R.; Chernokalskaya, E.; Nadler, T. Development of a univariate membrane-based mid-infrared method for protein quantitation and total lipid content analysis of biological samples. J. Anal. Methods Chem. 2014, 2014, 657079. [Google Scholar] [CrossRef] [PubMed]
- Merck Millipore. Simplified Analysis of Lipid or Detergent Content in Biological Samples Using the IR-Based Direct Detect® Spectrometer; Application Note; Merck Millipore: Burlington, MA, USA, 2013. [Google Scholar]


Publisher’s Note: MDPI stays neutral with regard to jurisdictional claims in published maps and institutional affiliations. |
© 2022 by the authors. Licensee MDPI, Basel, Switzerland. This article is an open access article distributed under the terms and conditions of the Creative Commons Attribution (CC BY) license (https://creativecommons.org/licenses/by/4.0/).