Proceeding Paper

Numerical Study of a Microfluidic-Based Strain Sensor: Proof of Concept †

1
Department of Engineering Technology, SUNY Polytechnic Institute, Utica, NY 13502, USA
2
Department of Engineering and Aviation Sciences, University of Maryland Eastern Shore, Princess Anne, MD 21853, USA
3
Department of Computer and Information Science, Arkansas Tech University, Russellville, AR 72801, USA
4
Department of Computer Science, Florida Polytechnic University, Lakeland, FL 33805, USA
5
Department of Computer Science, SUNY Polytechnic Institute, Utica, NY 13502, USA
*
Author to whom correspondence should be addressed.
Presented at the 9th International Electronic Conference on Sensors and Applications, 1–15 November 2022, Available online: https://ecsa-9.sciforum.net/.
Eng. Proc. 2022, 27(1), 46; https://doi.org/10.3390/ecsa-9-13323
Published: 1 November 2022

Abstract

:
This paper conducts a numerical study to prove the concept of a low-cost microfluidic-based strain sensor and investigates the key design parameters that affect the sensor sensitivity by using both theoretical and finite element models. The strain sensor is composed of an electrolyte-enabled microchannel integrated with a pair of interconnects and silicone-based packaging. The results show that the strain sensor has the highest sensitivity at the following chosen design parameters: the width and length of the primary microchannel are set at 0.2 mm and 20 mm, width ratio equals 2, and number of grid lines is 10.

1. Introduction

A strain sensor, also named strain gauge, is a device that can measure the strain of an object and convert the measured strain to the electrical response. Recently, with rising interest from many areas, such as human motion detection [1], wearable health monitoring [2], robotics [3], and structural health monitoring [4], strain sensors with the features of high flexibility, stretchability, sensitivity, stability, and low cost attract considerable attention.
Conventional strain sensors made of metal foils, piezo material, and semiconductor wafers hold promising sensitivity and stability. However, they lack flexibility and can only measure small strain (<5%). Also, the cost of these strain sensors imposes limitations on their practical applications. Regarding new types of flexible strain sensors, resistive strain sensors are the main research focus due to their simple structure and fabrication process. There are two mainstream strategies in sensor preparation to achieve the desired flexibility and stretchability. One is to develop electrically conductive elastomer composites by blending an insulating polymer matrix (thermoplastic or thermosetting plastic) with conductive fillers like carbon black, carbon fibers or nanotubes, metallic particles, or conductive polymers [5,6,7,8]. This type of strain sensor holds excellent stretchability, good conductivity, and is relatively low cost. However, the sensor may be less stable and sensitive when it is under tensile strain as the deformation of the conductive nanocomposites could result in loss of contact between adjacent conductive. Also, the piezoresistive behavior of some of the nanocomposites will affect the sensor response, such as the thermoplastic polyurethane with carbon-based nanofillers [9] or conductive metal nanoparticles [10]. Instead of developing new materials, designing new structural constructs from existing materials would work for some of the rigid materials, such as semiconductors and metal films. For instance, Kim et al. buckled the ultrathin single crystalline silicon nanoribbon to offer the desired flexibility and stretchability [11]. The mechanical structure can tolerate major strain change and minimize potential damage. This type of strain sensor can inherit the advantage of the conventional strain sensor, such as high sensitivity, and overcome the shortage of limited stretchability. However, the fabrication process of this strain sensor type is still complicated and requires relatively high costs. Therefore, there is a need to develop a strain sensor with high sensitivity, flexibility, stretchability, and low cost.
To tackle the issues mentioned above, a highly stretchable microfluidic-based strain sensor is presented here. The sensor is composed of an electrolyte-enabled long-winding microchannel integrated with a pair of interconnects and silicone-based packaging. While the sensor is stretched along the sensor length, the transducer pair’s overall resistance increases due to the elongation of the microchannel length and reduction of the microchannel cross-section. The detailed sensor design is demonstrated in Section 2.1. Section 2.2 and Section 2.3 discuss the two numerical models of the strain sensor, respectively. The results and discussion of the sensor performance are presented in Section 3.

2. Materials and Methods

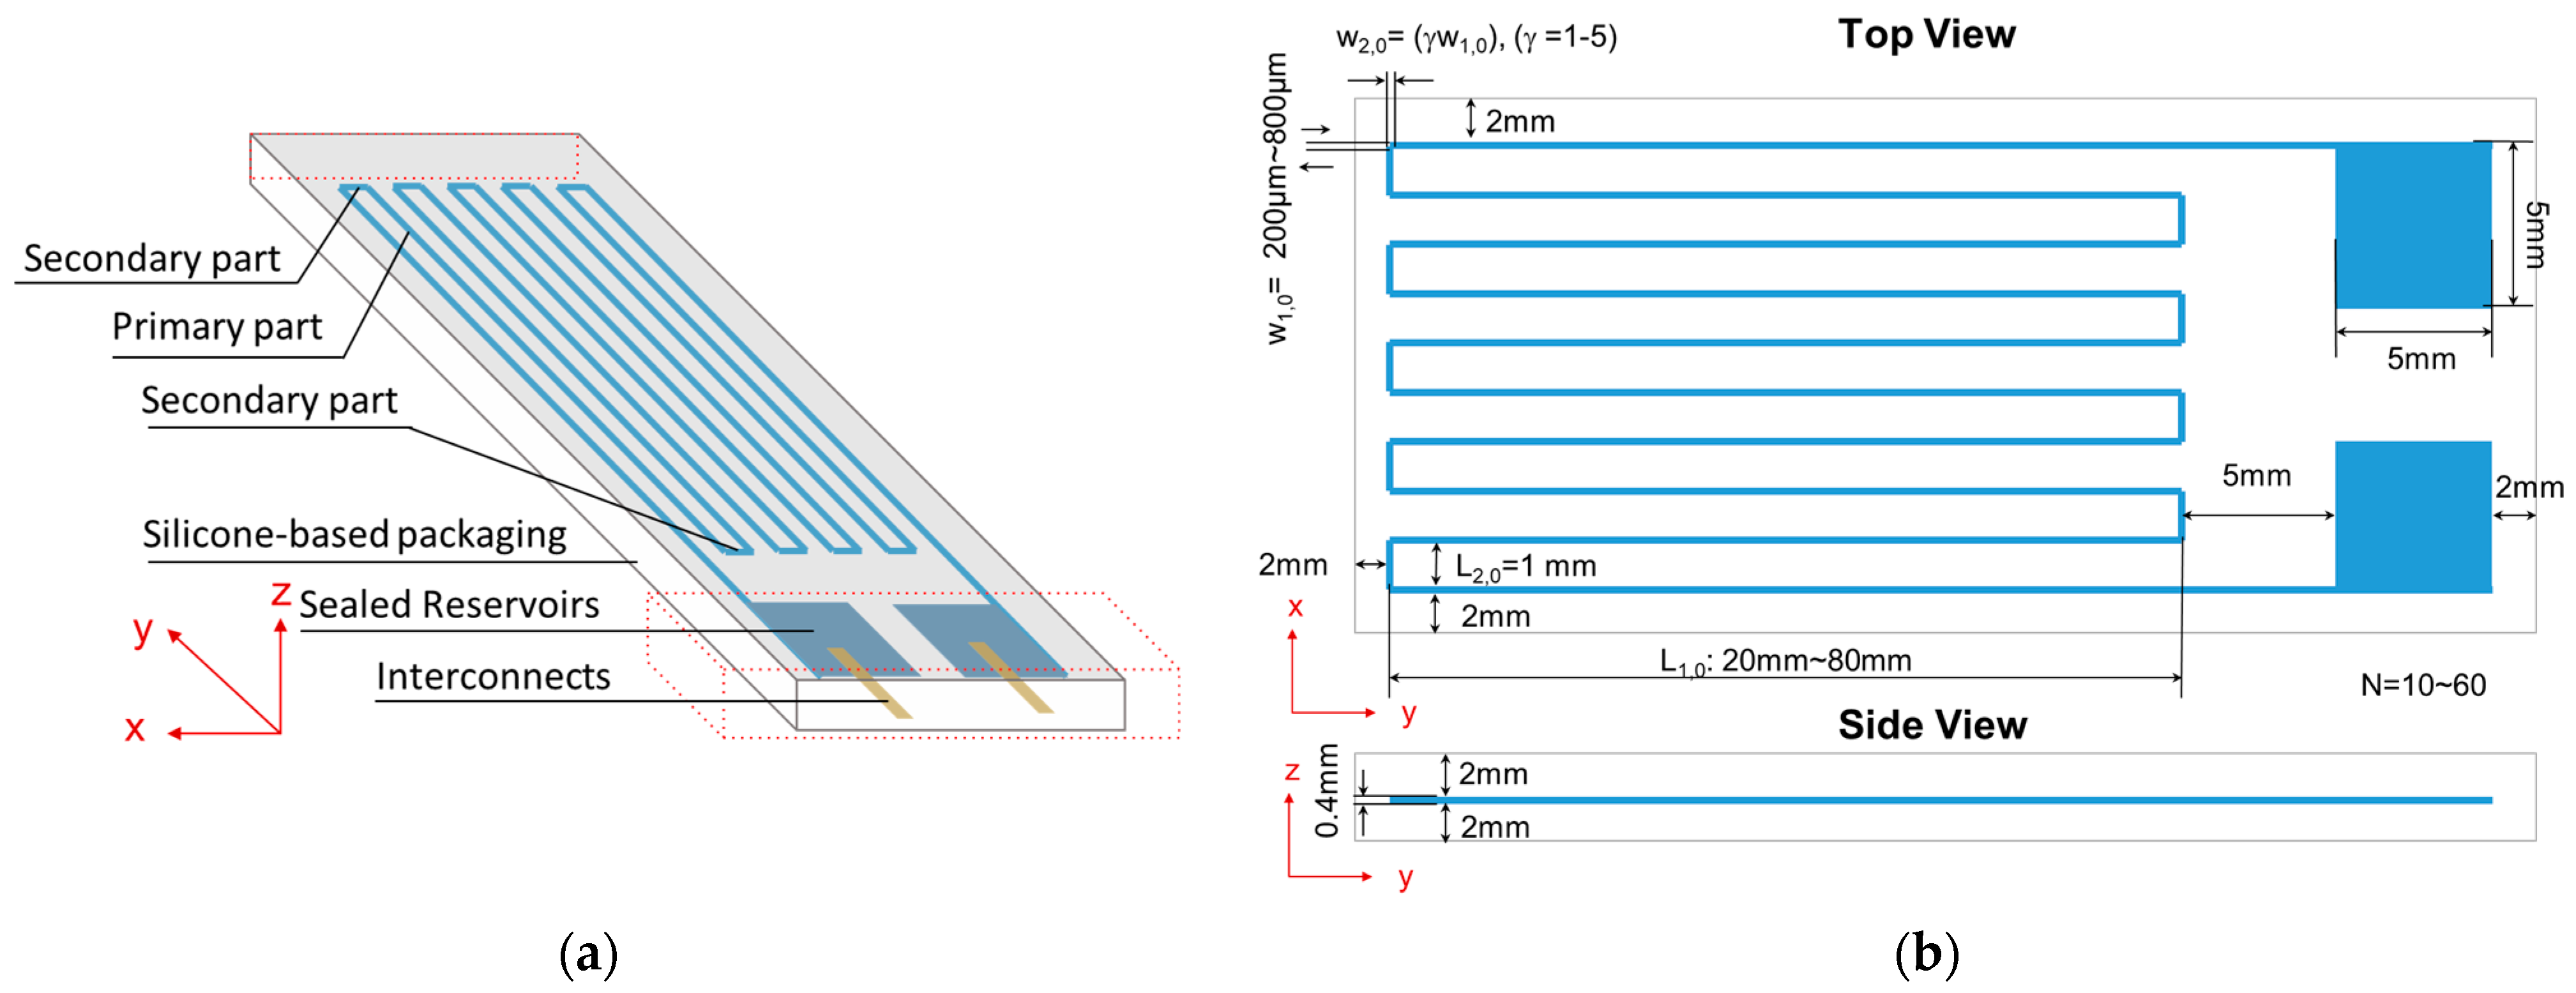
2.1. Sensor Configuration

Figure 1a demonstrates the configuration and working rationale of the stretchable sensor. Similar to the working rationale of the tactile sensor in the previous work [12,13], the sensor presented in this paper is composed of three key components: the electrolyte-enabled microchannel, one pair of interconnects, and a silicone-based stretchable packaging. One body of electrolytes in the microchannel and the interconnect pairs function as a resistive transducer pair. The strain sensor deformation causes the change in the microchannel geometry, which further leads to the flow of electrolytes in the microchannel and alters the overall resistance of the sensor. The resistance change can be first correlated with the strain change of the sensor during the sensor calibration and then used to capture the strain of the real-life application.
As shown in Figure 1a, the microchannel is a long winding channel that comprises two parts: a primary microchannel (PM) and secondary microchannel (SM). The PM represents the portion of the microchannel along the y-axis. Similarly, SM refers to the portion of the microchannel along the x-axis. Figure 1b elaborates on the key geometrical dimensions. Notably, the symbols indicate the four key design parameters that are evaluated in the simulation study: (1) the length of each PM segment, L1; (2) the width of each PM segment, w 1 ; (3) the ratio, γ, of the SM width, w 2 , to PM width, w 1 ; (4) the number of PM segments, namely, the number of grid lines, N. L2 is the SM segment length, which is fixed at the initial length L2,0 = 1 mm to avoid any crosstalk between the neighboring PM segments. Two reservoirs at the microchannel ends are utilized to fill the microchannel with an electrolyte, provide a conduit for the electrolyte to flow in/out during the sensor operation, and offer contacts between the electrolyte and interconnects. 1-Ethyl-3-methylimidazolium dicyanamide electrolyte (EMIDCA) is chosen as the electrolyte for the sensor performance evaluation due to its low evaporation rate, good biocompatibility, excellent fluidity, and relatively low resistivity. The packaging material is Dragon Skin 10, which is easy to manipulate and has high stretchability and good biocompatibility.

2.2. Theoretical Model

Based on the working mechanism of the resistive sensor, the sensor resistance can be represented by the equation R = ρL/A, where L and A represent the length and cross-section area of the microchannel, respectively; and the resistivity of the electrolyte, ρ , is assumed to be constant at room temperature. As such, the resistance change only depends on the change in the smallest cross-sectional area, A, and overall microchannel length, L, which is the sum of the PM and SM segment lengths. As mentioned in Section 2.1, the microchannel includes two parts: PM and SM. The number of grid lines is And, which is always even. Then, the overall length of the PM is N L 1 while the overall length of the SM is ( N 1 )   L 2 . As shown in Figure 1b, the cross-section of the microchannel is rectangular. Therefore, the area of the PM and SM can be obtained by using the rectangular area formula:   A 1 = h w 1 ,   A 2 = h w 2 , where h is the microchannel height, which is assumed to be consistent along the entire microchannel. w 1 and w 2 are the width of each PM and SM segment, respectively.
R 0 = ρ ( N L 1 , 0 h 0   w 1 , 0 + ( N 1 ) L 2 , 0 h 0   w 2 , 0 )
When the sensor is stretched along the y-axis (longitudinal), the sensor is under an axial strain ε y = Δ L 1 L 1 , 0 = Δ w 2 w 2 , 0 . Therefore, the length of each stretched PM segment and width of each stretched SM can be expressed as:
L 1 = L 1 , 0 + Δ L 1 = L 1 , 0 ( 1 + ε y ) ,   w 2 = w 2 , 0 + Δ w 2 = w 2 , 0 ( 1 + ε y )
The strain along the x-axis and z-axis is negligible due to the significant strain change on the y-axis. In other words, up to a certain critical stress, the effective channel cross-sectional area of the sensor remains constant. The electrolyte within the microchannel can be considered an incompressible liquid, which will further prevent the changes along the x-axis and z-axis. So the variation in Δ h ,   Δ w 1 and Δ L 2 can be neglected.
R = ρ ( N ( L 1 , 0 + Δ L 1 ) ( h 0 ) ( w 1 , 0 ) + ( N 1 ) ( L 2 , 0 ) ( h 0 ) ( w 2 , 0 + Δ w 2 ) ) ,  
where L 1 , 0 , w 1 , 0 ,   L 2 , 0 ,   w 2 , 0 ,   h 0 , respectively, represents the initial values of the PM segment length, PM segment width, SM segment length, SM segment width, and microchannel height when the axial strains ε x and ε z are zero and no external loading is applied to the sensor along the x-axis and z-axis. The width ratio, γ, is defined as γ = w 2 , 0 w 1 , 0 . Therefore, the relationship between the resistance and applied axial strain, ε y , is obtained.
R = ρ [ N L 1 , 0 ( 1 + ε y ) h 0 w 1 , 0 + ( N 1 ) L 2 , 0 γ h 0 w 1 , 0 ( 1 + ε y ) ] ,
When there is no axial strain applied, the initial resistance, R0, of the sensor is obtained. The electrical resistance change
R = R − R0 becomes
Δ R =   ρ [ N L 1 , 0 ( ε y ) h 0 w 1 , 0 ( N 1 ) L 2 , 0 ( ε y ) γ h 0 w 1 , 0 ( 1 + ε y ) ] ,
The gauge factor, GF, a standard factor for evaluating the sensor sensitivity, is defined as the ratio of the relative electrical resistance change to the axial strain GF = Δ R / ( ε y R 0 ) . A higher GF represents better sensor sensitivity and vice versa.
GF = γ N L 1 , 0 ( 1 + ε y ) ( N 1 ) L 2 , 0 ( 1 + ε y ) [ γ N L 1 , 0 + ( N 1 ) L 2 , 0 ] ,
As shown in Equations (5) and (6), the resistivity ρ is only related to the resistance change but has no impact on the GF. In other words, the electrolyte material type in the microchannel only has an impact on the overall resistance of the strain sensor but has no effect on the gauge factor. As such, no matter what kind of electrolyte is used, the gauge factor should remain the same. When the number of grid lines becomes infinitely large, the GF has less relevance to the number of grid lines. The GF is proportional to the axial strain, ε y , when ε y is very small. If the SM segment length ( L 2 , 0 ) is chosen to be 1 mm to avoid any crosstalk between the neighboring PM segments, Equation (6) also shows with the increase in L 1 , 0 , the impact of L 1 , 0 is the GF is reduced.

2.3. Finite Element Model

In this paper, the finite element software COMSOL Multiphysics is used to investigate the impact of the key geometrical dimensions on the performance of the flexible sensor. The structural mechanics and electromagnetic modules are used in the simulation. When the sensor is under axial loading, the structural mechanics module is used to study the mechanical response of the flexible sensor, whereas the electromagnetics module captures the changes in electrical properties.
According to Equations (4)–(6) in the theoretical model, under axial loading along the sensor length (y-axis) direction, the key geometrical dimensions that impact the sensor’s resistance change are the number of grid lines (N), width ratio ( γ ), initial PM segment length ( L 1 , 0 ), initial PM segment width ( w 1 , 0 ), and initial SM segment length ( L 2 , 0 ). The gauge factor is affected by similar key geometrical dimensions except for the initial PM segment width ( w 1 , 0 ). SM segment length ( L 2 , 0 ) is chosen to be 1 mm to avoid any crosstalk between the neighboring PM segments. We conducted four studies to investigate the impact of the four key geometrical dimensions on the resistance change and gauge factor.
In each study, one key geometrical dimension varies within a certain range while the other three dimensions remain unchanged. The detailed values of the four key geometrical dimensions used for each FEM study are shown in Table 1. Other geometrical dimensions are shown in Figure 1b.
This FEM uses EMIDCA as the electrolyte and silicone rubber (Dragon Skin 10, Smooth-On, Inc., PA) as the packaging material. The EMIDCA’s conductivity is 1.77 S/m [14]. And the resistivity is equal to one over the conductivity. EMIDCA and silicone rubber have the same Poisson’s ratio, 0.49. The silicone rubber exhibits a Young’s Modulus around 200~560 kPa [15]. The Young’s Modulus of silicone rubber is chosen as 350 kPa in this FEM study. During the simulation, one end of the sensor is fixed while the other end of the sensor is subject to a uniform axial displacement along the y-axis so that the axial strain ε x is fixed to be 30% for all models in FEM. The electrolyte is assumed to be perfectly packed in the silicone rubber.

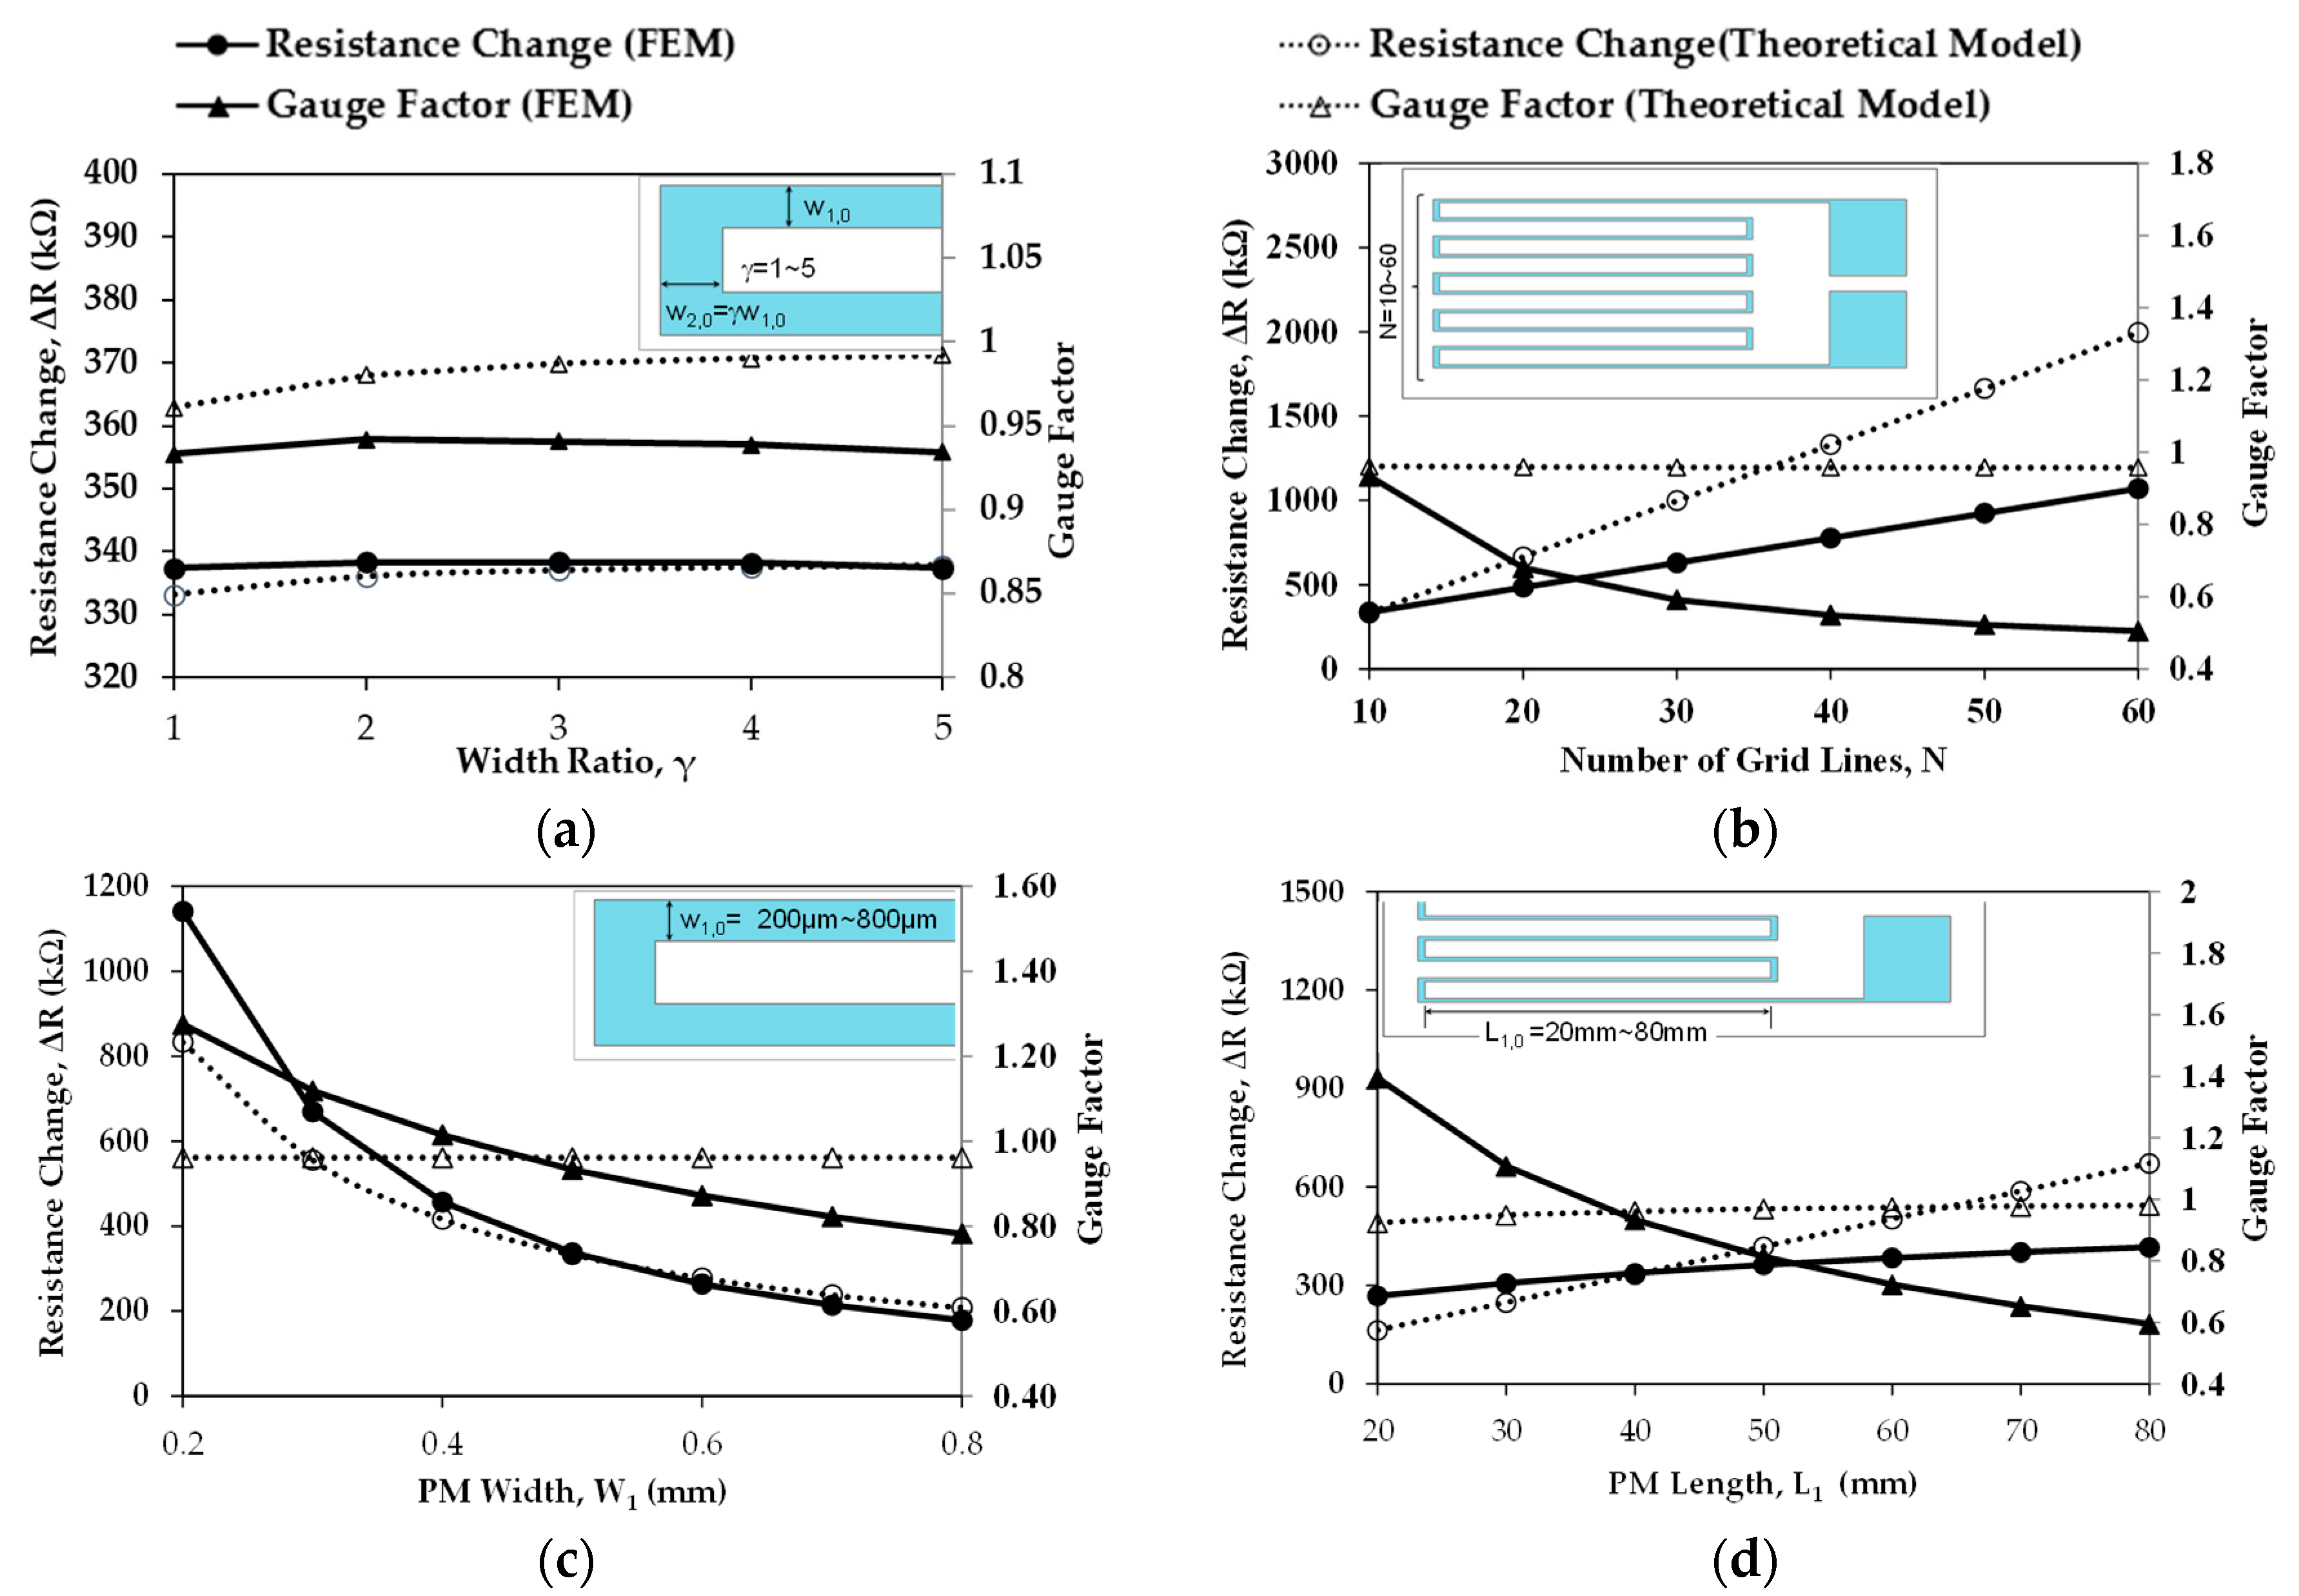
3. Results and Discussion

Figure 2 shows the variation in the resistance change and GF as a function of the (a) width ratio; (b) number of grid lines; (c) PM width; (d) PM length for the liquid-filled sensor under 30% axis strain in the finite element model and theoretical model. In the following diagrams, the resistance change and GF obtained by FEM are denoted as FEMRC and FEMGF, respectively. Similarly, the theoretical model’s resistance change and GF obtained are denoted as TMRC and TMGF, respectively.
The variation in the resistance change and GF as a function of the width ratio is displayed in Figure 2a. With a lower width ratio, the TMRC is slightly smaller than FEMRC. When the width ratio increases to 3, the values of the TMRC and FEMRC are very close. The TMGF value is always higher than FEMGF with the same width ratio. In the theoretical model, both TMGF and TMRC increase slightly with the growth in the width ratio, while the increasing trend slows down when the width ratio increases from 2 to 5. Meanwhile, in the FEM, FEMGF and FEMRC rise slightly when the width ratio increases from 1 to 2 and then drop slightly when the width ratio increases from 2 to 5. So the optimal width ratio is 2.
Figure 2b shows the relation variation in the resistance change and GF as a function of the number of grid lines. FEMRC and TMRC both increase linearly with an increase in the number of grid lines. Although the TMGF stays the same, the FEMGF decreases with the increase in the number of grid lines. And the FEMGF drops dramatically when the number of grid lines changes from 10 to 20 and slows on the decreasing trend from 20 to 60. As in the theoretical model, the strain change ε y is assumed to be the same along the y-axis; the TMGF shows an unchanged trend, which is different from the FEMGF. As can be concluded from Figure 2b, the higher the number of grid lines is, the more sensitive the strain sensor is. So the ideal choice of the number of grid lines is 10.
The variation in the resistance change and GF as a function of the number of PM widths is shown in Figure 2c. In Figure 2c, the TMGF maintains unchanged. And FEMRC, TMRC, and FEMGF all decrease with the increase of the PM width. Similarly, in the theoretical model of Equation (6), the strain change of the strain sensor is assumed to be the same along the y-axis. However, in FEM, the strain change of the sensor varies along the y-axis. Therefore, the FEMGF may better reflect the relation between the PM width and GF. Based on the results in Figure 2c, the thinner the PM width is, the more sensitive the strain sensor is. So the optimal choice of the PM width in this design is 0.2 mm.
Figure 2d demonstrates the effect of the PM length on the resistance change and GF. Both the theoretical model and FEM predict a similar increasing trend in resistance change with the increasing values of PM length. And the FEMGF and TMGF have similar values. But with the increase in the PM length, unlike the decreasing trend of FEMGF, the TMGF slightly increases. Similarly, the FEMGF reflects the non-uniformity of the strain change of the sensor along the y-axis. TMGF only has a slight variation because   ε y is assumed to be the same along the y-axis. Therefore, the GF in FEM should be closer to the actual experimental data. According to the results shown in Figure 2d, the sensor is more sensitive when it comes to a lower PM length, which is 20 mm in this study.

4. Conclusions

This paper uses one theoretical model and one FEM to find the optimal design factor for a microfluidic-based strain sensor. Because the higher the GF is, the more sensitive the strain sensor is. The theoretical model shows the type of electrolyte only affects the resistance change but has no impact on the GF. In other words, the sensor sensitivity does not rely on the type of electrolyte. The FEM validates that the strain sensor is highly stretchable. According to the results of the two models, the strain sensor will reach its highest sensitivity when the width ratio, number of grid lines, PM width, and PM length are equal to 2, 10, 0.2, and 20 mm, respectively.

Author Contributions

Conceptualization, J.S. and D.K.J.; methodology, J.S. and L.M.; software, M.G.; validation, J.S., L.M. and W.C.; formal analysis, J.S., W.C. and X.W.; investigation, J.S.; resources, D.K.J.; data curation, X.W. and W.C.; writing—original draft preparation, J.S.; writing—review and editing, L.M., D.K.J., W.C., X.W. and M.G.; visualization, J.S.; supervision, J.S.; project administration, J.S.; funding acquisition, J.S. All authors have read and agreed to the published version of the manuscript.

Funding

This research was funded by a 2022 SUNY Polytechnic Institute Seed Grant # 917035-40.

Institutional Review Board Statement

Not applicable.

Informed Consent Statement

Not applicable.

Data Availability Statement

Not applicable.

Conflicts of Interest

The authors declare no conflict of interest.

References

  1. Ma, Z.; Su, B.; Gong, S.; Wang, Y.; Yap, L.W.; Simon, G.P.; Cheng, W. Liquid-wetting-solid strategy to fabricate stretchable sensors for human-motion detection. ACS Sens. 2016, 1, 303–311. [Google Scholar] [CrossRef]
  2. Liu, Y.; Pharr, M.; Salvatore, G.A. Lab-on-skin: A review of flexible and stretchable electronics for wearable health monitoring. ACS Nano 2017, 11, 9614–9635. [Google Scholar] [CrossRef] [PubMed]
  3. Gandla, S.; Chae, H.; Kwon, H.-J.; Won, Y.; Park, H.; Lee, S.; Song, J.; Baek, S.; Hong, Y.-D.; Kim, D. Ultrafast prototyping of large-area stretchable electronic systems by laser ablation technique for controllable robotic arm operations. IEEE Trans. Ind. Electron. 2021, 69, 4245–4253. [Google Scholar] [CrossRef]
  4. Wang, Y.; Qiu, L.; Luo, Y.; Ding, R. A stretchable and large-scale guided wave sensor network for aircraft smart skin of structural health monitoring. Struct. Health Monit. 2021, 20, 861–876. [Google Scholar] [CrossRef]
  5. Wang, X.; Liu, X.; Schubert, D.W. Highly sensitive ultrathin flexible thermoplastic polyurethane/carbon black fibrous film strain sensor with adjustable scaffold networks. Nano-Micro Lett. 2021, 13, 1–19. [Google Scholar] [CrossRef] [PubMed]
  6. Yang, C.; Wu, Y.; Nie, M.; Wang, Q.; Liu, Y. Highly Stretchable and Conductive Carbon Fiber/Polyurethane Conductive Films Featuring Interlocking Interfaces. ACS Appl. Mater. Interfaces 2021, 13, 38656–38665. [Google Scholar] [CrossRef] [PubMed]
  7. Shajari, S.; Ramakrishnan, S.; Karan, K.; Sudak, L.J.; Sundararaj, U. Ultrasensitive wearable sensor with novel hybrid structures of silver nanowires and carbon nanotubes in fluoroelastomer: Multi-directional sensing for human health monitoring and stretchable electronics. Appl. Mater. Today 2022, 26, 101295. [Google Scholar] [CrossRef]
  8. Yang, J.; Cao, Q.; Tang, X.; Du, J.; Yu, T.; Xu, X.; Cai, D.; Guan, C.; Huang, W. 3D-Printed highly stretchable conducting polymer electrodes for flexible supercapacitors. J. Mater. Chem. A 2021, 9, 19649–19658. [Google Scholar] [CrossRef]
  9. Zarei Darani, S.; Naghdabadi, R. An experimental study on multiwalled carbon nanotube nanocomposite piezoresistivity considering the filler agglomeration effects. Polym. Compos. 2021, 42, 4707–4716. [Google Scholar] [CrossRef]
  10. Ke, K.; Bonab, V.S.; Yuan, D.; Manas-Zloczower, I. Piezoresistive thermoplastic polyurethane nanocomposites with carbon nanostructures. Carbon 2018, 139, 52–58. [Google Scholar] [CrossRef]
  11. Kim, J.; Lee, M.; Shim, H.J.; Ghaffari, R.; Cho, H.R.; Son, D.; Jung, Y.H.; Soh, M.; Choi, C.; Jung, S. Stretchable silicon nanoribbon electronics for skin prosthesis. Nat. Commun. 2014, 5, 1–11. [Google Scholar] [CrossRef] [PubMed] [Green Version]
  12. Cheng, P.; Gu, W.; Shen, J.; Ghosh, A.; Beskok, A.; Hao, Z. Performance study of a PDMS-based microfluidic device for the detection of continuous distributed static and dynamic loads. J. Micromech. Microeng. 2013, 23, 085007. [Google Scholar] [CrossRef]
  13. Shen, J.; Stacey, M.; Hao, Z. A Distributed-Deflection Sensor With a Built-In Probe for Conformal Mechanical Measurements of Costal Cartilage at Its Exterior Surface. IEEE Sens. J. 2017, 18, 822–829. [Google Scholar] [CrossRef]
  14. Huang, M.-M.; Jiang, Y.; Sasisanker, P.; Driver, G.W.; Weingärtner, H. Static relative dielectric permittivities of ionic liquids at 25 C. J. Chem. Eng. Data 2011, 56, 1494–1499. [Google Scholar] [CrossRef]
  15. Fouillet, Y.; Parent, C.; Gropplero, G.; Davoust, L.; Achard, J.L.; Revol-Cavalier, F.; Verplanck, N. Stretchable material for microfluidic applications. In Proceedings of the Multidisciplinary Digital Publishing Institute Proceedings, Paris, France, 3–6 September 2017; p. 501. [Google Scholar]
Figure 1. (a) Configuration of the strain sensor; (b) Key geometrical dimensions of the strain sensor. L1, w 1 , w 2 , and γ represent the PM segment length, PM segment width, SM segment width, and width ratio of the SM segment width to PM segment width, respectively. L2,0 is the initial SM segment length, which is 1 mm. N is the number of PM segments, namely, the number of grid lines.
Engproc 27 00046 g001
Figure 2. Variation in the resistance change and gauge factor as a function of (a) width ratio; (b) number of grid lines; (c) PM width; (d) PM length for the electrolyte-filled strain sensor under 30% axis strain in the FEM and theoretical model.
Engproc 27 00046 g002
Table 1. Key geometrical dimensions used in four FEM studies.
Study Relation betweenNumber of Grid Lines N γ PM   Length   L 1 , 0   ( m m ) PM   Width   w 1 , 0   ( m m )
N GF   or   Δ R 10~60 (10 increment)1400.5
γ GF   or   Δ R 101~5 (1 increment)400.5
L 1 , 0 GF   or   Δ R 10120~80 (10 increment)0.5
GF   or   Δ R 101400.2~0.8 (0.1 increment)
Publisher’s Note: MDPI stays neutral with regard to jurisdictional claims in published maps and institutional affiliations.

