Abstract
This paper proposes a wireless resonant inductive and capacitive (LC) sensor for glucose sensing. A sensor composed of a capacitor with interdigital electrodes and an inductor for glucose sensing is presented. Resonance frequency and impedance were measured as the sensing parameters. A glucose beverage concentration from 0% to 44% is used, resulting in a resonance frequency change from 1.9217 MHz to 1.8681 MHz, and the impedance of the sensor changes from 170.33 to 110.68 . The relationship of both resonance frequency and impedance to glucose beverage concentration is well presented by a decreasing exponential function. Using an exponential regression, the resonance frequency shows an average regression error of 1.38%. Likewise, the impedance shows an average error of 3.47%. The linear range of the sensor is also analyzed in a glucose concentration range between 0% and 4%. The sensor exhibited a sensitivity of 424.6 kHz and 721.6416 , respectively, with a linear regression of 0.9853 and 0.9553, respectively.
1. Introduction
With the economic development of society, people’s health care has been paid increasing attention. A large number of medical diagnosis technologies have been developed, of which glucose level detection is one of the most important medical diagnosis indicators. The majority of the current glucose biosensors are electrochemical sensors, which could be sorted into four generations based on the timeline. The first three generations are enzymatic-based biosensors [1,2,3]. They show good sensitivity, reproducibility, and low cost; meanwhile, they are limited by the environment and the dependency of enzyme activity. Therefore, researchers started to make efforts to explore enzyme-free detection, which has led to the fourth generation of glucose biosensors—nonenzymatic glucose (NEG) sensors [4]. A great deal of research on using capacitive sensors for biosensing has been carried out [5,6], of which interdigital capacitive sensors for glucose sensing have been drawing attention in the last decade due to their energy storage capability [7,8,9].
In this paper, a wireless LC sensor was developed for glucose sensing. The sensor includes a coil inductor and an interdigital capacitor, which is the primary sending element. A glucose beverage solution was prepared with varying concentration, and the resonance frequency and impedance of the sensor as output parameters were recorded and discussed.
2. Materials and Methods
The sensor is based on an LC circuit composed of a capacitor and an inductor. The capacitor has four electrodes: two working electrodes (interdigital fingers), a reference electrode, and a counter electrode. In this work, one working electrode and the reference electrode were selected to be connected with the inductor and tested with a glucose beverage solution. The inductor is a spiral copper coil connected to the capacitor, which transfers the signal to a reader by an antenna and meanwhile receives power from the antenna to the oscillating circuit. The reader gets the information from the sensor and transmits this to a computer for further analysis. The LC sensor system is shown in Figure 1. The capacitor configuration includes three layers: a gold layer for electrodes, silicon as the substrate, and a silica layer for insulation. The properties of the material and dimensions of the capacitor are shown in Table 1 and the study from Xu et al. [10], in which w, g, and l are interdigital finger dimensions, as shown on the right of Figure 1.
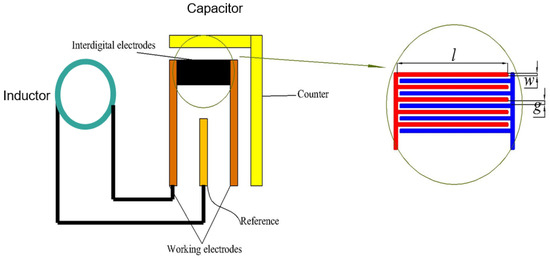
Figure 1.
Schematic of LC sensor and the capacitor structure diagram.

Table 1.
Material properties of the capacitor model.
The sensor inductor and the antenna are made of copper wires with a wire diameter of 0.68 mm and looped into 31 mm radius circles with 4 and 5 turns, respectively. The inductances of the sensor inductor and the antenna are 4.716 H and 3.018 H, respectively.
The glucose beverage used for testing has a glucose concentration of 41.7 g/dL. Besides D-glucose and water, it also contains citric acid anhydrous, sodium benzoate, orange flavor, and yellow dye. Ideally, a pure glucose solution (only glucose and pure water) would be more ideal for the study; however, due to the limited research condition, pure glucose solution was not found, and so the glucose beverage was used for this study. The electric and dielectric properties of the mixed solution, undoubtedly, are different from pure glucose solution. However, it is still representative to characterize the performance of the designed sensor. Distilled water was dropped to the glucose solution to vary the solution concentration, and then the sensor response was recorded. The capacitor and the inductor were connected by a USB cable, and the antenna was connected to an impedance analyzer (Agilent 4396B setup with impedance test kit Agilent 43961A).
3. Results and Discussion
3.1. Sensor Response
The working electrode and reference electrode of the sensor were connected to the inductor to generate a resonator as the LC sensor. The dimensions of the resonator were optimized to resonate at a center frequency about 1.96 MHz.
The measured impedances of both the clean LC sensor and the sensor containing distilled water, with proportions of glucose beverage to water of 1:4 and 600:650, are shown in Figure 2. With the increase of the glucose beverage concentration, both the resonance frequency and the impedance decrease, which implies the capacitance of the glucose solution increases as the concentration of the glucose solution increases.
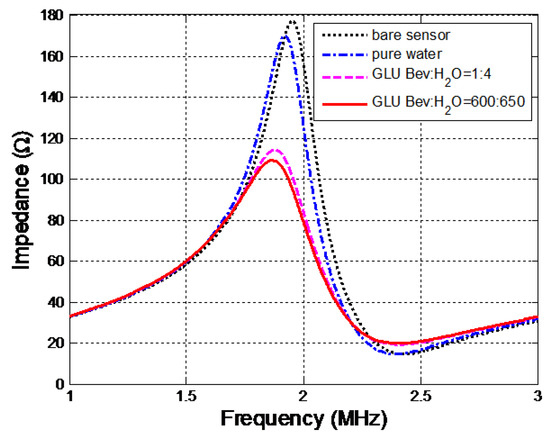
Figure 2.
Frequency and Impedance response of the sensor to glucose concentration.
3.2. Glucose Beverage Solution Proportion 0% to 44%
The sensor response with a glucose beverage proportion of 0% to 44% is shown in Figure 3. The resonance frequency changes from 1.9217 MHz to 1.8681 MHz, while the impedance changes from 170.33 to 110.68 . From the figure, we can see that both the resonance frequency and impedance responses show an exponential decrease with the glucose solution concentration increase. An exponential fit is applied to both the frequency response and impedance response. The regression function is plotted and compared with the experiment data as shown in Figure 3. Both the resonance frequency and the impedance magnitude show a good fit to the exponential function. The resonance frequency shows an average regression error of 1.38%, while the impedance shows an average error of 3.47%.
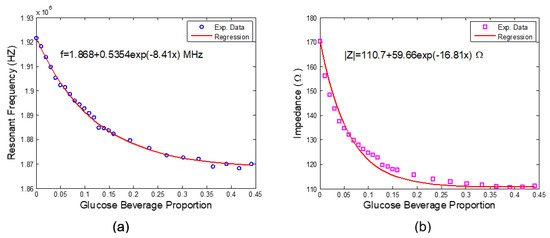
Figure 3.
(a) Frequency response and (b) impedance response to glucose concentrations with exponential regression.
Although the impedance regression has a higher regression error, it shows a more stable and continuous decreasing tendency. The relatively larger error of impedance can be caused by a big jump at a glucose beverage concentration of 0.13, which can be explained by the experiment process error.
3.3. Glucose Beverage Solution Proportion 0 to 4%
In order to see the linearity of the sensor response when the concentration of the tested solution is in a small range, the glucose proportion in the range of 0% to 4% was tested. The linear regression is shown in Figure 4. Both parameters show good linear regressions ( = 0.9853 for frequency response and = 0.9553 for impedance modulus response). The sensor shows a sensitivity of 424.6 kHz and 721.6416 , respectively, to the proportion of the glucose beverage in the range of 0% to 4%.
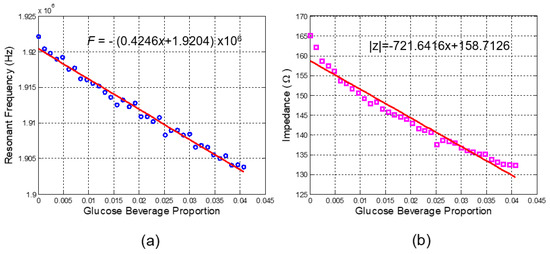
Figure 4.
Linearity of (a) The resonance frequency response and (b) Impedance modulus response to glucose beverage concentration.
In both tests, although both resonance frequency and impedance modulus show good correlation to the glucose beverage concentration, the frequency response regression is slightly better. A lower sensitivity to parasitic resistance on the resonance frequency could be the cause of this discrepancy. Meanwhile, the physical position between the two inductors could affect the impedance modulus as well. In specific applications, which output should be selected needs to be justified based on the specific applications.
3.4. Stability
In order to test the stability of the sensor, one specific concentration of glucose beverage solution (600/1350) was measured 10 times, and the results show good stability and repeatability, with a standard deviation of MHz and 0.367 , respectively, for the frequency response and the impedance.
4. Conclusions
This paper presented a wireless passive sensor for glucose detection. The resonance frequency and impedance modulus as the sensing parameters both showed an exponential response to the glucose proportion variation from 0% to 44%. When the glucose beverage proportion is smaller than 4%, both the resonance frequency response and the impedance response show a well-defined linear response to the glucose solution concentration change. The stability of the sensor behavior was tested, and both frequency and impedance showed high stability. The experiment results indicate a promising application prospect of the sensor for glucose detection. The selectivity of the sensor could be further studied for future work.
Author Contributions
Conceptualization, Y.J. and H.X.; methodology, Y.J.; software, H.X.; validation, H.L. and S.L.; formal analysis, H.L.; investigation, H.L.; resources, H.L.; data curation, H.X.; writing—original draft preparation, H.L.; writing—review and editing, H.X. and S.L.; visualization, S.L.; supervision, Y.J.; project administration, Y.J. All authors have read and agreed to the published version of the manuscript.
Funding
This research received no external funding.
Institutional Review Board Statement
Not applicable.
Informed Consent Statement
Not applicable.
Data Availability Statement
Not applicable.
Acknowledgments
Thanks to Pedro Resto and Manuel Toledo for their time and knowledge dedicated to support this work. In addition, thanks to Ruben Luciano and the staff at the Clinical Laboratory of Hospital Perea for their support with the experiment.
Conflicts of Interest
The authors declare no conflict of interest.
References
- Weibel, M.K.; Bright, H.J. The glucose oxidase mechanism. Interpretation of the pH dependence. J. Biol. Chem. 1971, 246, 2734–2744. [Google Scholar] [CrossRef] [PubMed]
- Yoo, E.-H.; Lee, S.-Y. Glucose Biosensors: An Overview of Use in Clinical Practice. Sensors 2010, 10, 4558–4576. [Google Scholar] [CrossRef] [PubMed]
- Zhu, Z.; Gancedo, L.G.; Flewitt, A.J.; Xie, H.; Moussy, F.; Milne, W.I. A Critical Review of Glucose Biosensors Based on Carbon Nanomaterials: Carbon Nanotubes and Graphene. Sensors 2012, 12, 5996–6022. [Google Scholar] [CrossRef] [PubMed]
- Tian, K.; Prestgard, M.; Tiwari, A. A review of recent advances in nonenzymatic glucose sensors. Mater. Schience Eng. C 2014, 41, 100–118. [Google Scholar] [CrossRef] [PubMed]
- Settu, K.; Chen, C.-J.; Liu, J.T.; Chen, C.-L.; Tsai, J.Z. Impedimetric method for measuring ultra-low E. coli concentrations in human urine. Biosens. Bioelectron. 2015, 66, 244–250. [Google Scholar] [CrossRef] [PubMed]
- Hang, T.C.; Guiseppi-Elie, A. Frequency dependent and surface characterization of DNA immobilization and hybridization. Biosens. Bioelectron. 2004, 19, 1537–1548. [Google Scholar] [CrossRef] [PubMed]
- Yang, M.-Z.; Dai, C.-L.; Hung, C.-B. Fabrication of a glucose sensor with oscillator circuit using CMOS-MEMS technique. Microelectron. Eng. 2012, 97, 353–356. [Google Scholar] [CrossRef]
- Kim, N.-Y.; Adhikari, K.K.; Dhakal, R.; Chuluunbaatar, Z.; Wang, C.; Kim, E.S. Rapid, Sensitive, and Reusable Detection of Glucose by a Robust Radiofrequency Integrated Passive Device Biosensor Chip. Sci. Rep. 2015, 5, 7807. [Google Scholar] [CrossRef] [PubMed]
- Zhang, Z.; Maturavongsadit, P.; Shang, J.; Yan, J.; Li, D.; Wang, Q.; Lin, Q. A dielectric affinity glucose microsensor using hydrogel-functionalized coplanar electrodes. Microfluid. Nanofluid. 2017, 21, 93. [Google Scholar] [CrossRef] [PubMed]
- Xu, H.; Yi, J.; Lisandro, C. Design and characterization of a passive wireless DNA sensor. Eng. Proc. 2021, 10, 39. [Google Scholar]


Publisher’s Note: MDPI stays neutral with regard to jurisdictional claims in published maps and institutional affiliations. |
© 2022 by the authors. Licensee MDPI, Basel, Switzerland. This article is an open access article distributed under the terms and conditions of the Creative Commons Attribution (CC BY) license (https://creativecommons.org/licenses/by/4.0/).