Abstract
Energy efficiency is one of the key characteristics of smart cities and data-driven analytical methods, especially including Internet of Things (IoT) sensors, and meaningful indicators are provided to support initiatives but also changing behavior at the citizen level. The analysis is often undertaken in closed systems that contain sensors, data acquisition, analysis and visualization. To improve the effectiveness of energy-efficiency initiatives in climate programs, harmonization of analytical methods and quality assurance of the data are required. This paper provides an overview of these themes based on the findings from two European Union (EU)-funded projects, European Regional Development Fund (ERDF) 6Aika Climate Friendly Housing Companies and Horizon 2020 mySMARTLife.
1. Introduction
Heating of properties generates 56% of the carbon emissions in the city of Helsinki [1]. Privately owned and rental properties have seen relatively few improvements in energy efficiency in recent years and as part of their climate programs, the cities seek initiatives and incentives to tackle the issue. Reasons for the lack of action in rental properties may also be a range of market barriers and market failures including misinformation, split incentives, and an uneven power dynamic between renters and landlords.
Finland has quite a rare model in the way private buildings are formed as a single legal body that owns the apartment. Instead of owning an apartment as a property, the right to hold the apartment is given by owning shares in the limited liability housing company. This structure may sometimes affect decision making on not only investments but also all the spending, including consulting and analysis that proves the next actions to be reasonable.
It is expected that harmonized analytical methods on commonly available data such as room sensor temperature and humidity values could provide a way to identify the first steps on energy efficiency measures in ways that could be replicated at larger scales, even city-wide analysis. The three most useful analyses are (1) whether the heating curve is optimal, (2) whether temperature levels between apartments are aligned, and (3) what is the level of overheating on both apartments and communal spaces. The three methods together were expected to provide 10–20% savings on primary energy consumption without additional investment on equipment.
For the sensors, data-quality definition was created by implementing some of the ISO 19157 elements and the goal is to create self-explanatory data streams that can be processed live with meaningful results being achieved focusing on the three analyses described in this study.
2. Related Work
Data quality has been the subject of numerous studies, especially for information systems. It has been noted, however, that the focus has mainly been on static data and not sensor or other dynamic data. Specifically, most research has not taken into account the nature of sensor data, including its dynamicity, temporality and heterogeneity [2]. The main exception is the research in the field of geospatial sciences, where the data quality has been included in the program of ISO TC/211 standardization effort as ISO 19157. It is the most comprehensive attempt to describe the data quality and even though it focuses on the geographical data, it could have wider usage as well. The ISO 19157 has been implemented as a DQ_Element in the Open Geospatial Consortium (OGC) SensorThings API that is intended to be a generic sensor data model.
The correlation between humidity and CO2 concentration has been studied by Lazovic et al. [3]. Their methodology was based on measurements made with professional handheld measuring devices that had more advanced measuring principles than typical low-power room sensors. Therefore, it was considered to be beneficial for practical use to repeat the study and see whether lower-grade sensors would provide the same results.
3. Methodology
The study was undertaken using typical wireless home sensor devices and their recommended calibration methods knowing that the quality of collected data is unknown. It was also known that widely used analytical methods in the field of energy efficiency are hardly based on documented scientific research. Several findings were made to encourage future research on the topics.
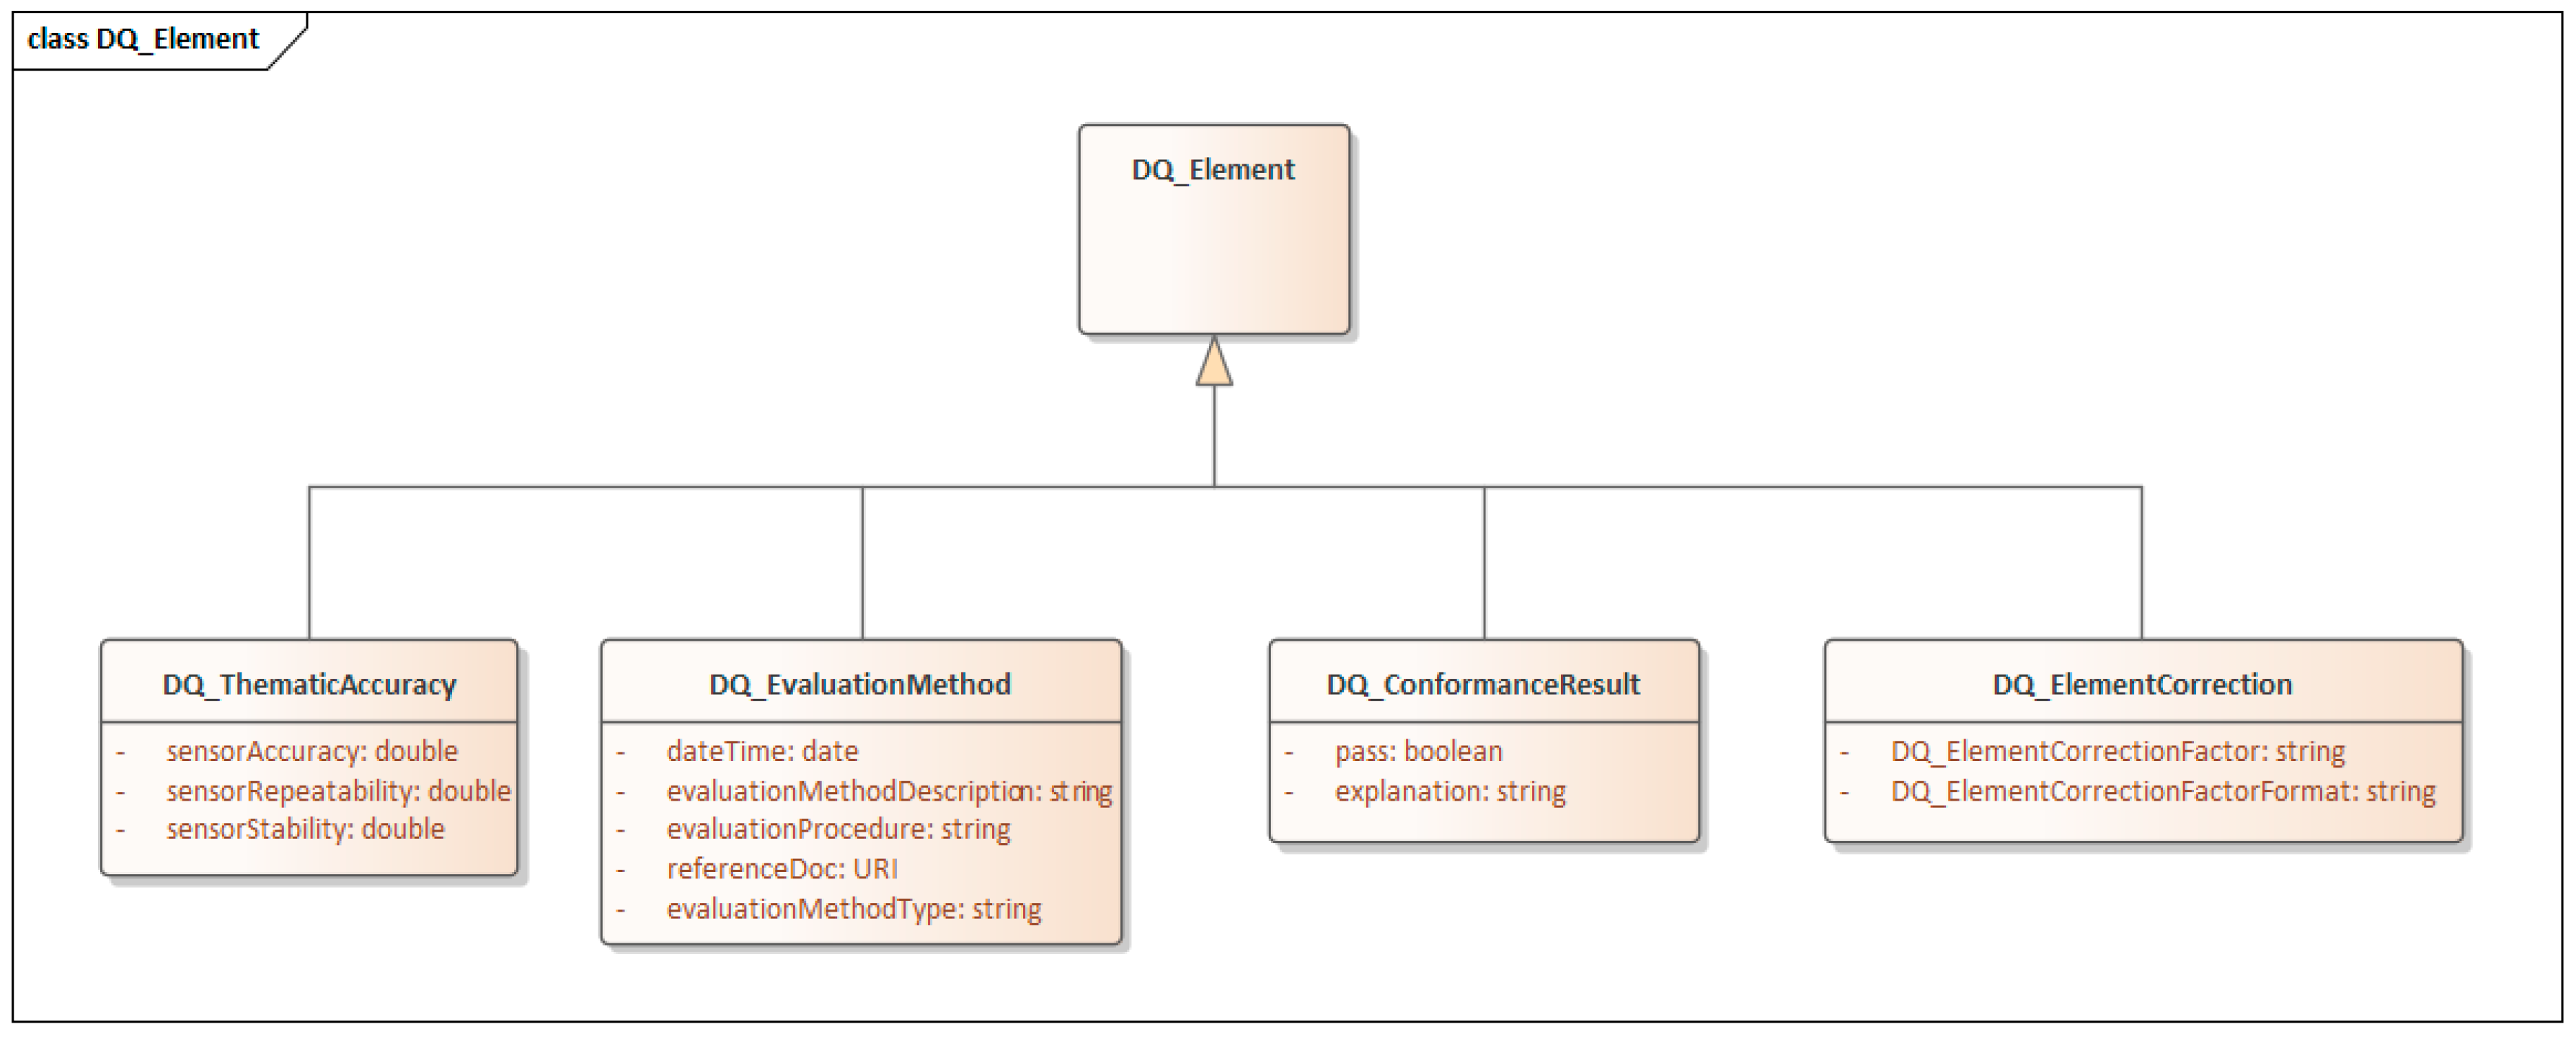
The data quality element (DQ_Element) as illustrated in Figure 1 is based on the ISO 19157 standard was created to manage quality-related metadata of the sensors. In the implementation, the following main elements were included:
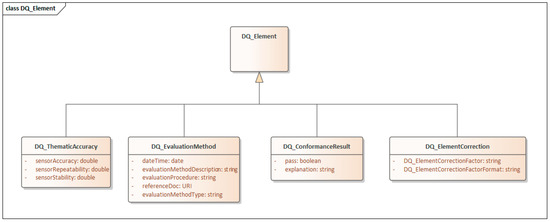
Figure 1.
Data quality element.
- DQ_ThematicAccuracy
- DQ_EvaluationMethod
- DQ_ConformanceResult
- DQ_ElementCorrection
DQ_ElementCorrection was not described in the ISO 19157 standard but was included as a placeholder for the compensation function. The term is used more widely in medical science and an example of a paper defines it in the context of calibration process [4]. It is expected that the element correction factor could maintain the compensation function using notation that is compatible with the str_expr attribute in the SymPy symbolic mathematical library for Python, as part of the Stream Processor concept of Apache Kafka. With this approach, the sensor metadata containing the compensation function the streaming values can be corrected in real time.
The process of real-time data stream compensation is not the subject of this paper. However, the early results from the data acquisition platform show that the effort put into calibration and compensation is meaningful.
The sensor system was selected and commissioned to collect data to answer the following questions:
Q1: Will the indoor temperature remain stable while the outdoor temperature varies?
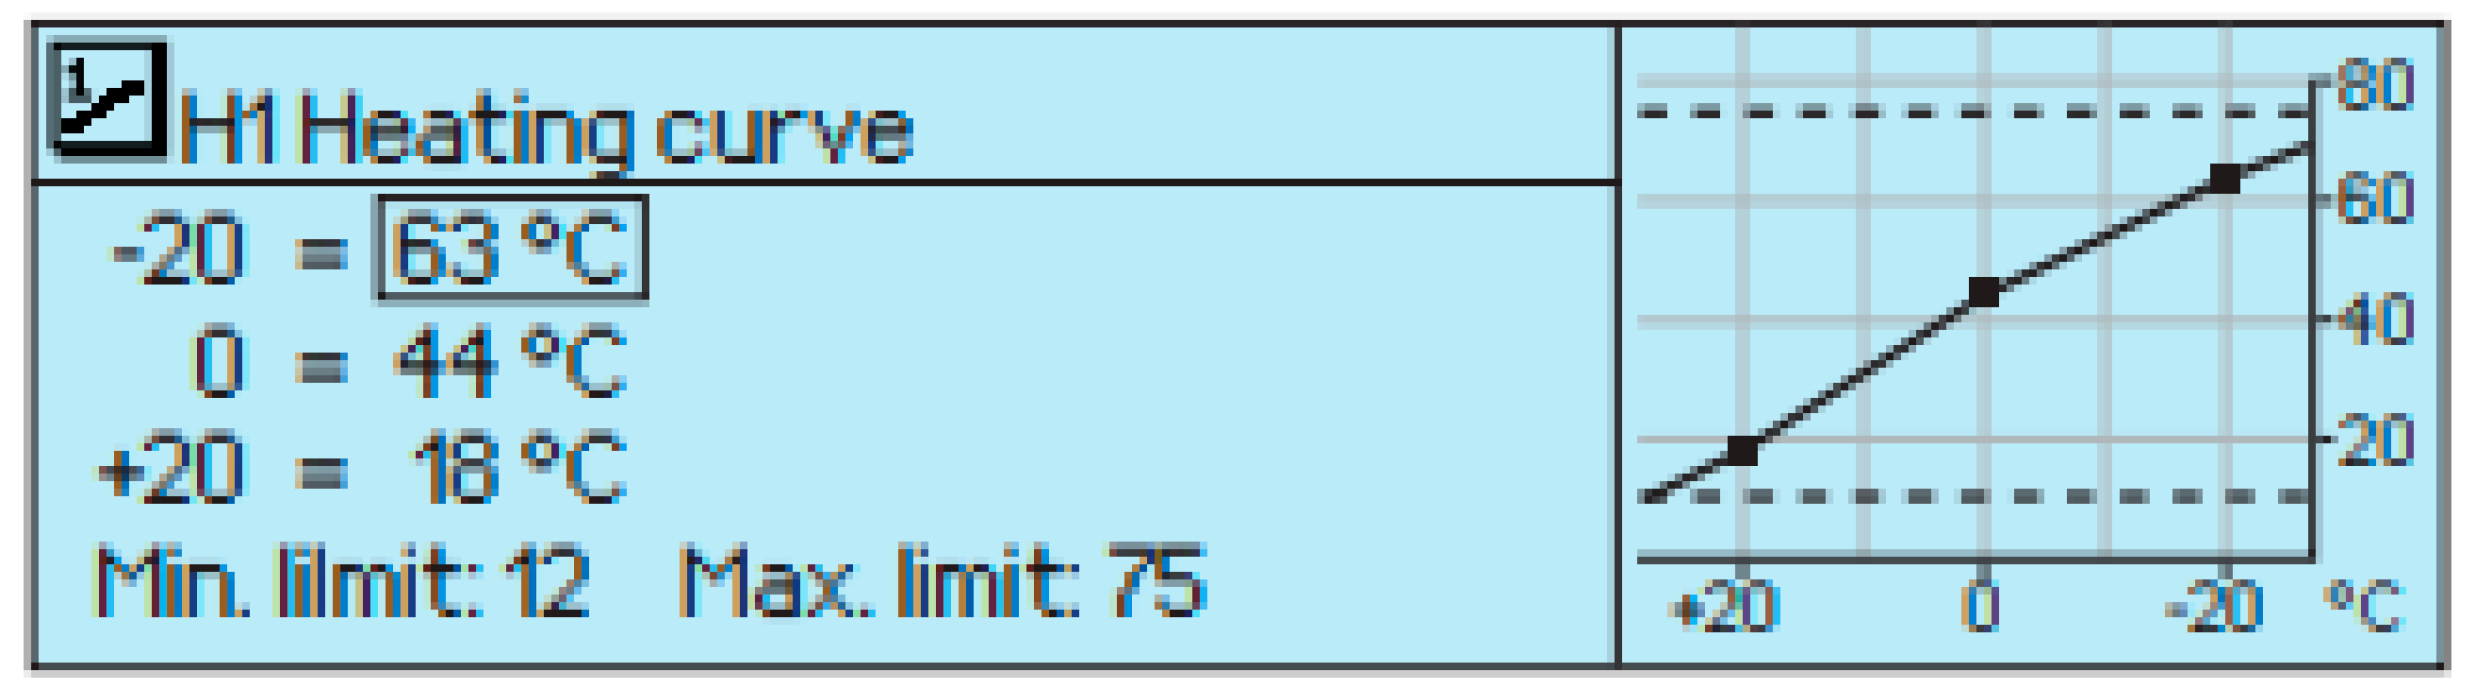
Apartment buildings are typically not equipped with a building automation system (BAS). In the buildings with water-driven central heating the indoor temperature levels are mainly controlled using the central heating controller and thermometers in each of the radiators. The role of the central heating controller is to control the incoming hot water flow according to the outdoor temperature. The controller adjusts the valve based on a heating curve (Figure 2) that is an array of temperature value pairs, linking target water flow temperature with the outdoor air temperature. In simple controllers, the array may consist of three value pairs, typically with outdoor temperatures of −20 °C, 0 °C and +20 °C. The following example from the Ouman heating controller illustrates the heating curve and its configuration:
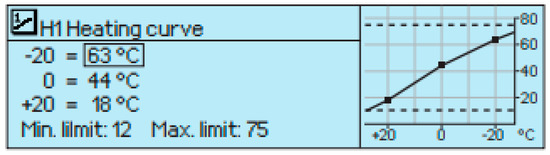
Figure 2.
Heating curve setup.
To achieve energy-efficient heating of buildings, the target is to keep the indoor temperature of all the apartments of the house stable and at the same level. Therefore, the indoor temperature should not be affected by outdoor temperature. In order to find out the stability of warming, it has been studied whether the outdoor temperature has an effect on indoor temperatures in the apartments. In the analysis of data, the outdoor temperature values have been divided into bins of 5 degrees Celsius. For each bin, statistics of indoor temperatures as well as number of samples and mean of outdoor temperatures are computed. The statistics of indoor temperature include median, mean, minimum, maximum values as well as 5% and 95% percentile values.
Q2: Are the indoor temperatures aligned between the apartments, especially between the first and last ones in the heating circuit?
All the apartments should have the same temperature and this temperature should not change when the outdoor temperature decreases or increases. The heat distribution system in the building contains line valves for each line that can be adjusted to control the hot water flow. Also, the thermometers mounted on radiators tend to gradually wear down over the years and their replacement may be a prerequisite for further adjustments.
Q3: Are the CO2 measurements reliable and useful for analysis or can the humidity data provide the same answers?
For this study, statistics of both CO2 and humidity measurements as well as correlations between them during the heating season have been created. Values of CO2 concentration indoors should always be above 400–420 ppm, which is the outdoor concentration of fresh air in Helsinki, Finland.
Q4: What is the percentage of overheating during the heating period and what savings could temperature optimization provide?
The rate of overheating has been studied both in the apartments and in communal spaces of houses. Overheating is computed as positive deviation from recommended temperature. In Finland, the recommended temperature in the apartments is +21 °C and in communal spaces of houses it is +17 °C [5]. To show the deviation the median, mean, and 5% and 95% percentiles are computed. In this study, only the measurements collected during the heating period are used.
4. Results
Q1: Will the indoor temperature remain stable while the outdoor temperature varies?
To be able to study the relationship between indoor and outdoor temperatures the measurements collected from the apartments of one building during one year have been used. The data collection period was from 24 September 2019 to 24 September 2020. The outdoor temperature was from the nearest Finnish Meteorological Institute (FMI) measurement station. Samples were averaged over a four-hour interval. During winter 2019–2020 the four-hour average outdoor temperature did not fall below −7.5 °C at the measurement station at all.
Heating season four hour mean statistics of outdoor temperatures from the nearest FMI measurement station are shown in Table 1 below.

Table 1.
Statistics of heating season outdoor temperature (°C).
As described in the statistics above, the minimum of four hour mean temperatures during the last winter was only −7.1 °C which is over ten degrees warmer than the usual.
The Table 2 shows the number of times and the ratio of four-hour intervals in which the average outdoor temperature has been below 0 °C per heating season. This information is meaningful because the lowest setpoint of the heating curve is −20 °C and such conditions are becoming rare due to the changing climate.
Table 2.
Count and ratio of sub-0 outdoor temperatures during heating season.
The indoor temperatures as shown in Table 3 of the apartments are stable when the outdoor temperature is between −7.5 and 12.5 °C. In the studied building there are two apartments in which the indoor temperature is about 2 °C lower than the average.
Table 3.
Indoor and outdoor temperatures.
Q2: Are the CO2 measurements reliable and useful for analysis or can the humidity data provide the same answers?
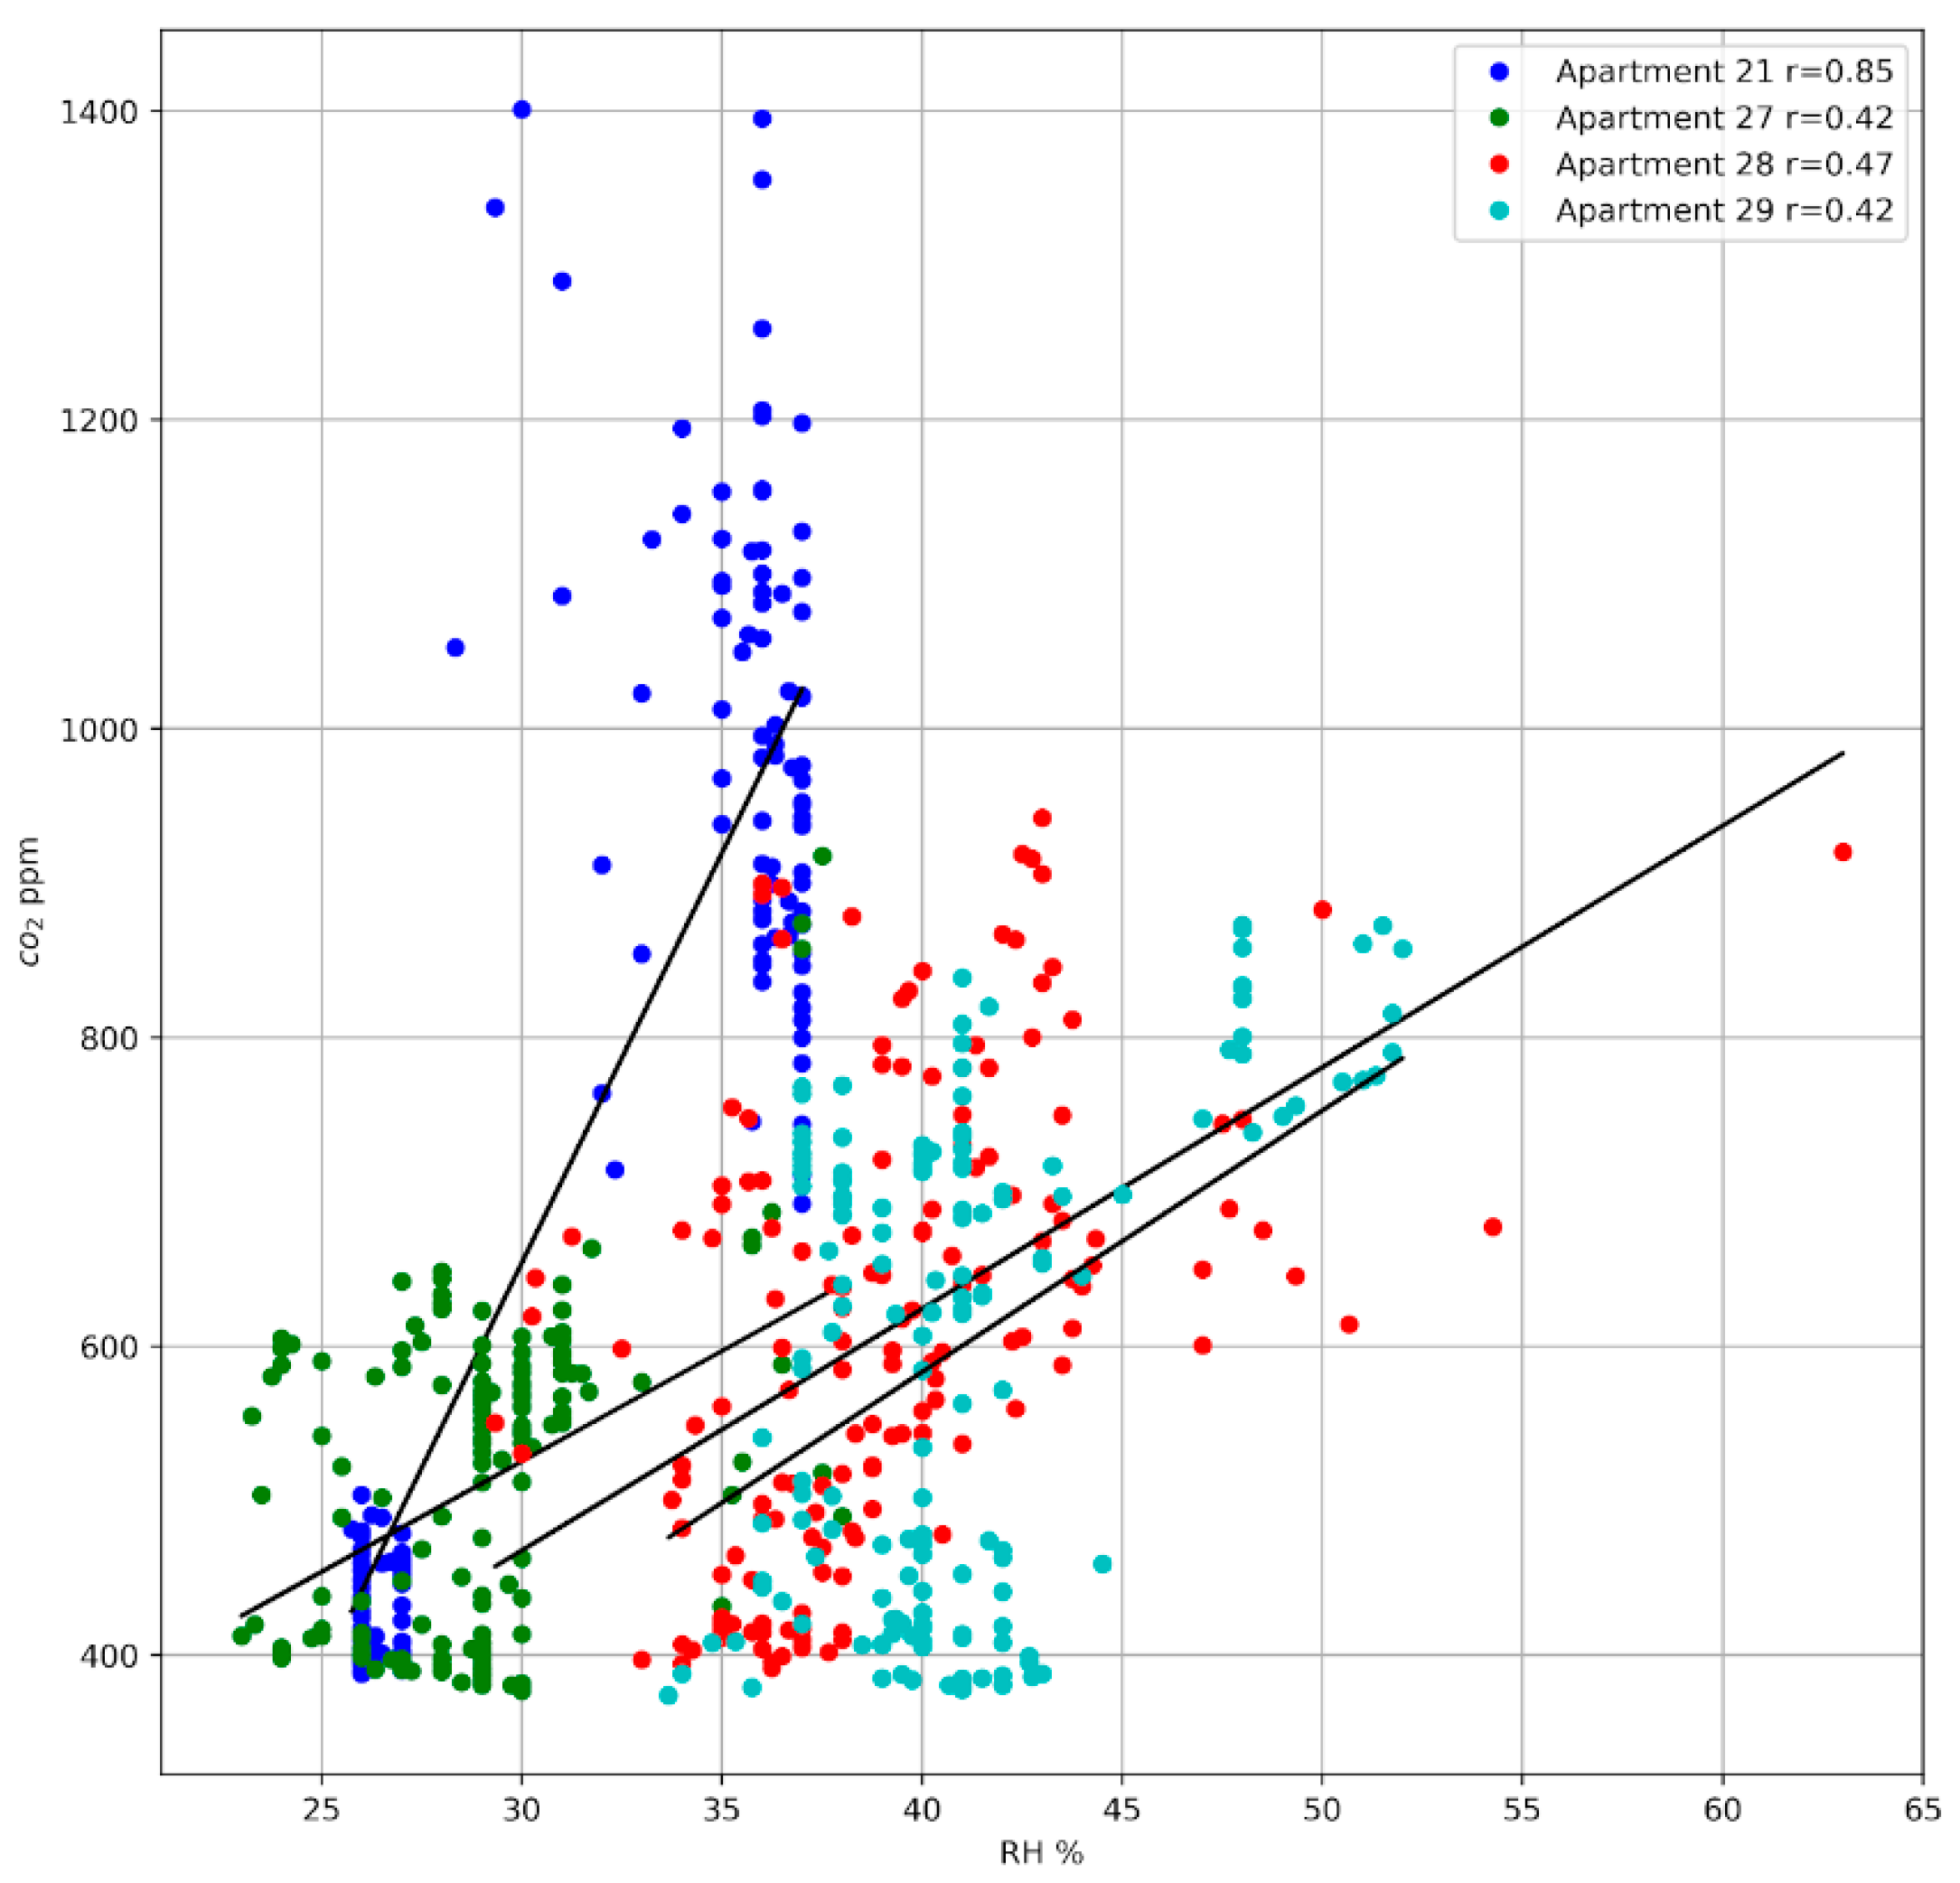
Correlation between CO2 and humidity measurements in sensors of one house is shown in Table 4 and Figure 3. The dataset is collected during the heating season from 1 October 2019 to 15 May 2020.
Table 4.
CO2/Rh Correlation.
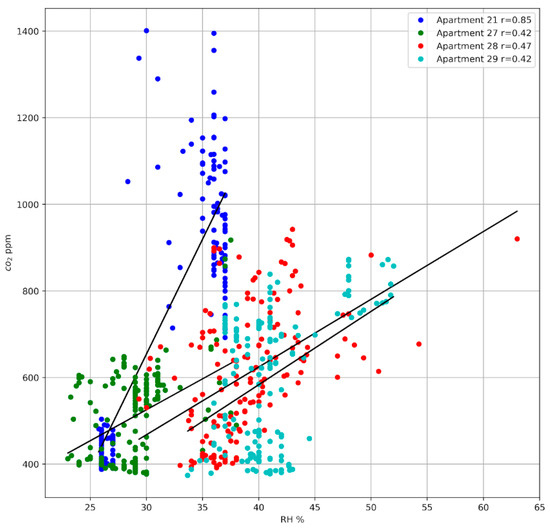
Figure 3.
Correlation of CO2 and humidity in four apartments based on one-week measurements.
Correlation of the CO2 and humidity was computed in 5 °C temperature bins.
Statistics of humidity on different outdoor temperatures (data collected from 24 September 2019 to 24 September 2020) is shown in Table 5. Values have been averaged over a four-hour interval.
Table 5.
Humidity values and outdoor temperatures.
The following Table 6 provides the values of CO2 sensors in Parts per Million (PPM) during the heating season.
Table 6.
CO2 concentration and outdoor temperatures.
Q3: What is the cumulative amount of overheating during the heating period and what savings can optimization provide?
Overheating was measured in degrees Celsius in the apartments of one house. Measurements collected during the heating period from 1 October 2019 to 15 May 2020 were used.
The Table 7 provides statistics of positive deviations of temperature i.e., overheating. Values below recommended temperature values are converted to recommended values. This is due to computation of possible saving % value in energy consumption (last column in table below). Therefore, by adjusting the indoor temperature to the recommended value, savings up to 6.5% per apartment is possible.
Table 7.
Overheating in apartments.
The Table 8 provides a similar overview in the case of communal spaces. The higher savings potential is due to the recommendation of lower base temperatures.
Table 8.
Overheating in communal spaces.
In the pilot location where the average weekly heating energy consumption during the heating season is 11 MWh, it is estimated that on average 75% of the floor area is dwellings and the remaining 25% is communal areas, such as storage spaces, laundry rooms and bike storage. With these assumptions, the savings potential is estimated to be 0.73 MWh on a weekly basis, equaling about 46.00 € as calculated with the current energy list prices of Helen Ltd. (Helsinki, Finland).
5. Discussion
Smart home sensors are often proposed as an entry-level solution to improve energy efficiency, connected with advanced data-driven services. The service providers are not usually transparent on what the analytical methods actually are and the benefits to the consumers remain unclear. In this study, the potential of optimization was narrowed down to three main issues and the expectation was that 10–20% of savings in primary energy were achievable.
The results show that this is somewhat true. While no actual optimization tasks like replacement of thermometers were made, already the potential in recognizing the overheating situations are significant. In the communal spaces in particular, the potential is significant, since typically such spaces are set to the same temperatures as the apartments.
The question on correlation between the humidity and CO2 concentration was raised as a research question due to the fact that the sensor with CO2 sensing capability was about 40 € more expensive than a normal room sensor. It was also suspected that the quality of CO2 data was lower than with the other measurements due to the low-cost and low-power sensing component. In the actual analysis it was even difficult to complete the work since the data were so bad: several sensors provided values lower than the fresh air outdoors even though all of them were calibrated according to the manufacturer’s advice. In practice, it is unlikely that such advice is even always followed or that it is not feasible to do so, for example, because of the large quantity of sensors to be installed. Another issue with the correlation is also the nature of humidity in the home environment: it can quickly rise because of the use of a shower or cooking. With a high number of sensors and a longer trend of datapoints, the correlation would be closer to what was achieved in the earlier study [3]. As a conclusion, however, it can be said that the CO2 sensor capability does not add significant value in normal home settings and should be avoided unless there is a reason to do so. This study did not contain analysis of ventilation, but even in that case it is assumed that the humidity values would provide a useful input for the analysis than CO2 concentration.
The analysis of the cumulative potential of energy savings was based on “common knowledge” that a one-degree change in room temperature equals a 5% change in energy consumption. This information has been widely used in the training of energy specialists and materials created for tenants to motivate them to make sustainable choices in their living. The origin of this information was traced back to theBuilding Technologylaboratory of VTT Research Institute of Finland, where the ratio has been defined using simulations. It was not, however, known if this has ever been documented or published as a scientific article. Such quick and easy indicators have an increasing importance when the energy performance of facilities is becoming more closely followed.
In Finland, many of the tuning and optimization methods of HVAC controls are based on processes that require certain temperature levels outdoors. As an example, the lower setpoint on the basic heating controllers is at −20° Celsius. As shown in Table 1, such winters are becoming rare and in the past seven years only in two winters has the temperature been below that level. Warm winters also increase the risks of issues caused by increasing humidity that typically have been compensated for by increasing the temperature of water in district heating systems, attempting to dry the air. Because of this, new ways to set the heating curves are needed and with continuous monitoring instead of one-time tuning, a building can remain optimized and maintain the level of comfort the tenants expect.
Funding
This research was funded by European Union Horizon 2020 program in mySMARTLife project, grant number 731297. The data collection pilots were part of the European Union European Regional Development Fund project 6Aika Climate Friendly Housing Companies.
Conflicts of Interest
The authors declare no conflict of interest.
References
- City of Helsinki. The Carbon-Neutral Helsinki 2035 Action Plan; City of Helsinki: Helsinki, Finland, 2019. [Google Scholar]
- Rodriguez, C.; Servigne, S. Sensor Data Quality for Geospatial Monitoring Applications. In Proceedings of the AGILE, 15th Internationale Conference on Geographic Information Science, Avignon, France, 24–27 April 2012; pp. 24–27. [Google Scholar]
- Lazovic, I.; Stevanovic, Z.; Jovasevic-Stojanovic, M.; Zivkovic, M.; Banjac, M. Impact of CO2 concentration on indoor air quality and correlation with relative humidity and indoor air temperature in school buildings in Serbia. Therm. Sci. 2016, 20 (Suppl. 1), 297–307. [Google Scholar] [CrossRef]
- Plato, P.; Miklos, J. Production of element correction factors for thermoluminescent dosimeters. Health Phys. 1985, 49, 873–881. [Google Scholar] [CrossRef] [PubMed]
- STM. Asumisterveysohje; Ministry of Social Affairs and Health: Helsinki, Finland, 2003. [Google Scholar]
Publisher’s Note: MDPI stays neutral with regard to jurisdictional claims in published maps and institutional affiliations. |
© 2020 by the authors. Licensee MDPI, Basel, Switzerland. This article is an open access article distributed under the terms and conditions of the Creative Commons Attribution (CC BY) license (https://creativecommons.org/licenses/by/4.0/).