Abstract
This study explores the use of spectral methods for fatigue life assessment, considering the effects of material plasticity. While these methods are widely used for high-cycle fatigue in the linear elastic regime, their application to low-cycle fatigue remains more complex due to nonlinear material behaviour. By incorporating models such as Neuber’s rule and the Ramberg-Osgood formulation, this work examines how spectral methods can be adapted to account for elastic-plastic effects. A comparison is made between fatigue life estimations obtained with spectral approaches and results from time-domain nonlinear simulations. The study provides insights into the applicability of strain-based spectral methods, contributing to a better understanding of their potential and limitations in fatigue assessment.
1. Introduction
In the engineering industry, fatigue has become a significant design criterion, necessitating the development of fatigue methods that more accurately model real physical phenomena. The conventional fatigue approaches that are utilized within this field are defined through the time domain, wherein the input data is typically expressed as a stress or strain time history. Algorithms such as rainflow [1] are utilized for the extraction of stress cycles from the time history, thereby yielding a distribution of stress amplitudes. In order to ascertain the lifetime corresponding to this distribution, it is possible to employ a fatigue law such as the Basquin equation and a damage accumulation rule such as the Palmgren-Miner law [2]. However, it should be noted that the implementation of these methods necessitates the prior knowledge of stress time history or the envelope of this time history. In the context of random vibrations, the mechanical structure may exhibit a dynamic response. The spectral approach to fatigue evaluation of structures has gained considerable popularity, largely due to its efficacy in dealing with random loading, especially when dealing with large data sets, such as those resulting from prolonged stress time histories. The cycle’s distribution is not calculated but is estimated with a probability density of the maxima. This probability density depends on parameters of the PSD and the spectral method selected [3].
The application of spectral methods is extremely valid in industrial fields; however, compared to classic methods in the time domain, there are limitations in their applicability, in particular, the input signal must be stationary, ergodic, Gaussian, and zero-mean. In the case of random fatigue, the behavior of the structure influences the response. Historically, frequency methods have been applied in the field of linear structures. Under these assumptions, the characteristics of the output signal do not change with respect to the properties of the input signal. In the context of linear elastic systems, the response of the system is characterized by the statistical properties of the input. However, material nonlinearity has been shown to disrupt this equivalence, with the result that a random excitation may yield path-dependent local stresses and strains that are characteristic of elasto-plastic behavior. The accurate capture of such inelastic effects thus necessitates the utilization of strain-based methodologies. However, only a limited number of studies have explored the extension of spectral methods into the strain domain. These approaches utilize Neuber’s rule in conjunction with the Ramberg-Osgood constitutive model to derive a probability distribution of strain amplitudes from the linear stress spectrum, e.g., Rognon et al. ([4,5]) and Böhm et al. [6]. More recently, Kara and Benasciutti [7] applied Neuber’s rule to the cumulative density function of linear stress amplitudes in order to develop a fully frequency-domain, strain-based fatigue model. The present work implements a strain-based spectral fatigue method on a case study. The results are then compared with those obtained from a nonlinear finite-element simulation with kinematic plasticity and a linear elastic analysis with Neuber time-domain correction. While the spectral approach offers significant computational efficiency, it also exhibits conservative estimates of strain amplitudes, thus highlighting both its potential and its current limitations.
2. Theoretical Background
2.1. Spectral Properties
Random fatigue is critical in the design of components exposed to random loading; this type of load can be seen as the realization of a stationary random process . In the case of a stationary Gaussian stochastic process, the power spectral density (PSD) contains information defining this process. The PSD is related to the Fourier transform of and provides the energy content of the signal over frequencies [8], its expression is described in Equation (1):
where is the autocorrelation function of the random process.
Two definition of PSD exist, the double-sided and the single-sided , and the relation is provided in Equation (2):
The signal is said to be narrowband if has a peak around a single frequency, generally the resonant frequency of a vibrating system. In all other cases in which the PSD covers a wider range of frequencies, the random signal is not narrowband, and it is named as wideband.
The spectral moments are important characteristics of a random process; they are calculated as in Equation (3):
Spectral moments represent some important properties of the signal , for example, the moment of order zero, denoted as , coincides with the variance of the random signal. The combination of spectral moments of higher order is used to characterize some statistical properties of the random signal [9] that are of interest in fatigue analysis. In particular, for a Gaussian process, the number of zero-upcrossings is defined in Equation (4):
The peak rate is defined as follows in Equation (5):
Other important combinations of spectral moments are the bandwidth parameters, defined in Equation (6):
Among them, and are the most used; they are close to unity for a narrow-band process, less than unity otherwise.
2.2. Fatigue Damage
In time domain fatigue analysis, given a stress history of duration T, after using Rainflow counting algorithms, yields cycles grouped by amplitude and count . The classical Palmgren–Miner rule reads:
with failure predicted when .
The probabilistic definition of the Palmgren-Miner accumulation rule [10] allows the expected damage for a stress time-history of time length T to be expressed as follows:
where is the PDF of cycle amplitudes, is the total number of cycles in time T, the cycles to failure at constant amplitude s.
In classical spectral methods, the fatigue model commonly used is the Basquin equation. This gives a power law relation between stress amplitude and life, as shown in Equation (9).
where b is the curve slope, and is the curve intercept. The application of spectral methods to the case of fatigue strain life necessitates the adoption of the Manson–Coffin fatigue curve [11], as illustrated in Equation (10)
where c is the curve slope of the plastic part, b is the curve slope of the elastic part, is the Fatigue Strength Coefficient and is the Fatigue Ductility Coefficient.
The PDF of cycle amplitudes can be described using various spectral methods. Examples of such methods include the Rayleigh model for narrow-band signals [8] and the Tovo-Benasciutti model [12]. In this particular case study, the adopted model is the Dirlik model [13].
2.3. Neuber’s Rule
The correction method proposed by Neuber provides a practical approach for estimating local elasto-plastic stress and strain concentrations at notch roots [14]. The objective of this study is to achieve this by refining linear-elastic solutions. Typically, this rule is used for time domain analysis. In particular, there is an adaptation of it that takes into consideration the effect of material memory, which is path dependent [15]. Neuber’s rule is employed to evaluate the actual local behavior, with the elastic stress and strain values at a given location being the starting point. The material’s elasto-plastic response is described using a constitutive model, such as the Ramberg–Osgood relation [16] described in Equation (11)a. This objective is realized through the enforcement of the equivalence between elastic and plastic deformation energy, as demonstrated in Equation (11). The graphical representation of this concept is illustrated in Figure 1, which shows the intersection between Neuber’s hyperbola formed from the equivalence of energy of deformation (Equation (11)b), and the stress–strain curve of the material.
where E is the elastic modulus, is the cyclic strength coefficient, and is the cyclic strain hardening exponent. This rule has also been used to enhance the accuracy of fatigue life predictions under random vibration when utilizing frequency-domain spectral approaches, as evidenced in the works of Rognon et al. ([4,5]), Bohm et al. [6], and Kara et al. [7].
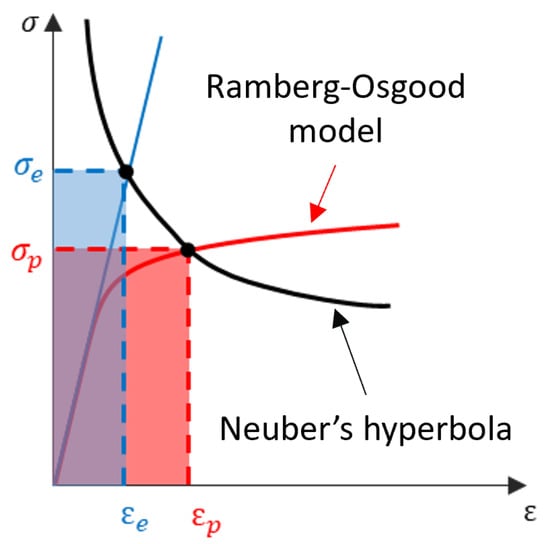
Figure 1.
Application of Neuber’s Rule, in blue the elastic behavior of the material, in red the actual stress–strain curve of the material, in black the Neuber’s hyperbola that estimates the elasto-plastic behavior.
3. Spectral Methods for Strain-Based Fatigue Assessment
3.1. Review of PDF’s Correction Approach
The earliest approach to strain-based spectral methods is the Rognon et al. [4,5]. This methodology consisted of transforming the probability density function (PDF) of elastic stress amplitudes into a corresponding plastic strain probability density function, utilizing Neuber’s rule. In the context of a zero-mean stationary Gaussian random process, the PDF of stress amplitudes, denoted , is discretised into bins of equal width. Each bin has a central value of and a corresponding , such that every bin has an area , representing the probability of finding cycles with stress amplitude . The application of the Neuber rule to the elastic stress PDF results in the derivation of a corresponding PDF of elasto-plastic strain. It is evident that all areas of each bin remain constant , where is the bin width. However, due to the nonlinear nature of Neuber’s rule, the central stress amplitude, designated as , of the bin is shifted to the central strain amplitude, denoted as . The strain amplitude PDF is now discretised with bins that are not evenly spaced, resulting in a distorted distribution compared to the elastic one. Consequently, the transformation resulted in a cycle reallocation in accordance with the strain amplitudes. This process is illustrated in Figure 2.
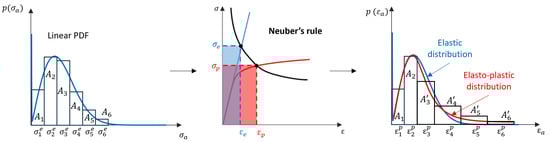
Figure 2.
PDF correction methodology: transformation of the elastic stress PDF (blue) into a corrected elasto-plastic strain distribution (red) through the application of Neuber’s rule.
As demonstrated above, the efficacy of the aforementioned procedures is dependent on the discretization of the elastic stress PDF. Consequently, the accuracy of the results is significantly influenced by the initial determination of the elastic stress bin width. It is evident that selecting larger values results in a substantially inaccurate approximation of .
Another significant result that aligns with the methodology established by Rognon et al. ([4,5]) is the research conducted by Bohm et al. [6], in his research, the procedure proposed by Rognon has been empirically validated, and their findings indicate that the spectral method, augmented by the elasto-plastic correction, exhibits greater precision in predicting failure compared to conventional spectral methods.
3.2. Review of CDF’s Correction Approach
A different strain-based spectral method has been proven to be more rigorous from a theoretical standpoint than the Rognon method ([4,5]). This alternative approach solves the problem of the PDF correction method that is inherited by the numerical discretization of the stress distribution.
Kara and Benasciutti [7] introduced the cumulative distribution function correction method, drawing upon these considerations. The method utilizes Neuber’s rule to transform a specified elastic stress amplitude, denoted as (), into a corresponding strain amplitude, denoted as (), while maintaining the constant probability. This process is illustrated in Equation (12) and Figure 3.
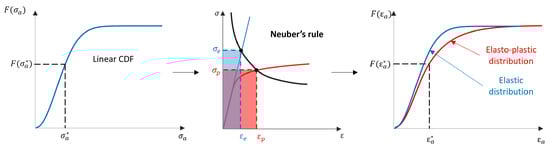
Figure 3.
CDF correction methodology: transformation of the elastic stress CDF (blue) into a corrected elasto-plastic strain distribution (red) through the application of Neuber’s rule.
Subsequent to the acquisition of the elasto-plastic strain amplitude CDF, the corresponding PDF can be calculated using the relation that links PDF and CDF shown in Equation (13):
It is evident that the methodologies outlined above have yielded diverse results. However, the CDF approach stands out for its simplicity and rigorous nature. Consequently, it will be adopted in this paper as the preferred method.
4. Application Case Study
In order to assess the validity of the strain spectral method, a comparison with time-domain simulations is carried out. In particular, two comparisons are made: a nonlinear finite element analysis (FEA) simulation to model accurately the plasticity of the material subjected to random loading, and a linear FEA simulation with time-domain correction using Neuber’s rule.
4.1. Finite Element Model
A specimen that has been identified as a notable example has been selected for the purpose of simulating the response of the elastoplastic material. The specimen selected for this study is a simple plate with a central hole. The dimensions of the specimen are illustrated in Figure 4. The specimen was chosen to obtain a stress concentration factor, , which is defined as the ratio of maximum stress, , to nominal stress, , and is given by the following equation: (see Figure 4c). In the FE model, the nodes on the left side of the specimen are subject to full constraints, while the right side is loaded with a random force.
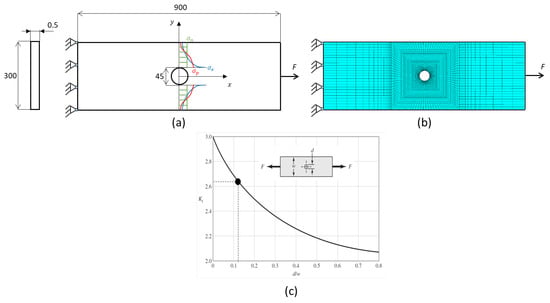
Figure 4.
Case study: (a) dimensions and constraint of the specimen, (b) detail of the mesh of the specimen, (c) evaluation of the stress concentration factor .
The model consists of 3491 elements, with mesh refinement implemented in the proximity of the notch area. The element employed in this instance is a shell element, characterized by four nodes.
4.2. Random Stress Time Histories
The finite-element model shown in Figure 4 is driven by a random force time history applied at its right side. The load in question has zero mean, is stationary, and follows a Gaussian distribution. The force history itself is obtained via a stress-based procedure. Firstly, a narrow-band PSD of the nominal stress is generated with = 500,000 points over s. The variance of this spectrum is chosen to induce plasticity at the notch root. The stress concentration factor is utilised to estimate the local notch-root stress directly from the PSD. Subsequent to the confirmation that these stress fluctuations exceed the yield threshold, the corresponding force history is computed using the following equation . This force time history is then applied to the FE model. Table 1 lists the PSD parameters selected for this case study.

Table 1.
Properties of the Input PSD of nominal stress .
In Figure 5, the input PSD of nominal stress is illustrated.
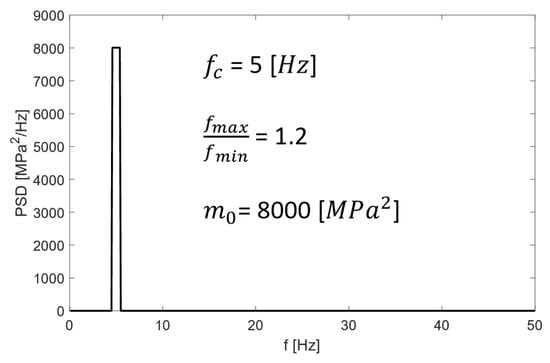
Figure 5.
Illustration of the nominal stress PSD of input with its properties.
For the linear analysis, a static simulation under a unit load was first performed to determine the linear stress and strain fields. Those fields were then scaled in time according to the computed force history, exploiting the FE model’s linearity for efficiency. For the nonlinear simulation, only the turning points of the force history were used as input. This choice reduces computational cost, since simulating all points in a fully nonlinear run would be prohibitive.
4.3. Material Model
In this case study, the material selected is the stainless steel 30304 cold-rolled BHN = 327, the basic mechanical properties of which are outlined in Table 2. As illustrated in Figure 6, the stress–strain curve employed in the nonlinear FE model is described using the Ramberg-Osgood model. The coefficients of this model are shown in Table 2.
Table 2.
Stainless steel 30304 material properties and fatigue parameters.
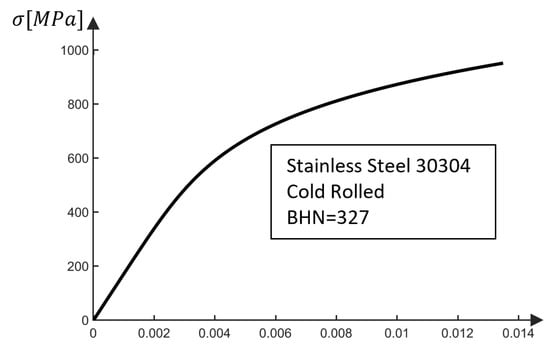
Figure 6.
Stainless steel 30304 Ramberg-Osgood model of the stress–strain curve.
The objective of this study is to compute the fatigue damage in the case of strain life and stress life. In order to undertake this task, the properties of the Manson–Coffin curve and the Basquin curve are also provided in Table 2. All these properties are taken from the material library of the website “efatigue” [17].
In the finite element model, the material elasto-plastic behavior was simulated by a kinematic hardening model, which correlates the stress amplitudes to plastic strain amplitudes for stabilized cycles. The utilization of the multilinear kinematic model is of particular significance in this context. Multilinear kinematic hardening models [18] capture the Bauschinger effect by defining successive linear segments of the stress–strain curve, each characterized by distinct hardening moduli. This piecewise approach enables accurate prediction of cyclic ratcheting and mean stress relaxation under non-proportional loading with minimal computational overhead.
5. Results
Nonlinear and linear finite element analyses were conducted, with the resulting outputs being the stress and strain time histories of the notch area. Subsequently, the resultant data from the linear analysis underwent transformation using the Neuber correction in the time domain. The statistical distribution of the time histories of results was evaluated by means of an empirical cumulative distribution function (ECDF). A comparison of the stress and strain CDFs and PDFs is made, taking into account the element at the tip of the notch that experiences the maximum strain and stress.
As demonstrated in Figure 7, a comparison of stress CDFs is made.
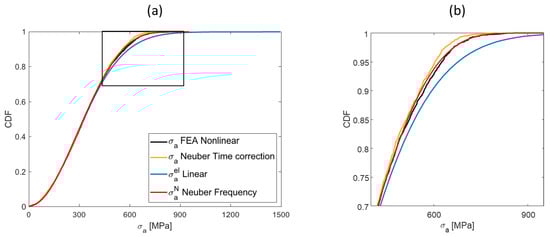
Figure 7.
(a) CDF stress comparison, (b) Zoom of the zone with plasticisation. In black the nonlinear finite element stress CDF, in yellow the linear finite element with time domain Neuber correction stress CDF, in blue, the classical spectral method stress CDF, in red, the strain-based spectral method stress CDF.
The black curve represents the CDF of stress amplitudes obtained from the nonlinear FEA. The yellow curve illustrates the CDF of stress amplitude obtained from the linear FEA results, corrected with Neuber in the time domain. The blue curve denotes the CDF of stress amplitude obtained using the spectral method in the case of a linear elastic material. The red curve illustrates the strain-based spectral method, i.e., the spectral method corrected with Neuber in the frequency domain.
It is important to note the differences in results for estimating the stress amplitude between the various approaches. As shown in Figure 6, the plastic behavior of the stainless steel 30304 commences at stresses ranging from 400 to 500 MPa. This is evident in Figure 7a, and in particular in Figure 7b, which shows the overestimation of stress amplitudes performed by the classical spectral method compared to the other methods that consider the plasticity of the material. The utilization of the spectral method, corrected with Neuber, has been demonstrated to yield results that are comparable to those of nonlinear FEA. Furthermore, the implementation of linear FEA analysis, corrected with Neuber in the time domain, has been shown to produce satisfactory outcomes, although with a tendency to slightly overestimate stress.
Since fatigue damage calculations in spectral methods rely on the PDF of elastic stress, Figure 8a,b presents the corresponding stress PDFs computed via Equation (13), with the resulting data presented in Figure 8. It is important to note that a comparison of PDFs provides a clearer insight into the behavior of the various approaches. However, as demonstrated in Figure 8a,b, the classical spectral method overestimates the actual stress, while the strain-based spectral method and the Neuber time domain approach underestimate it.
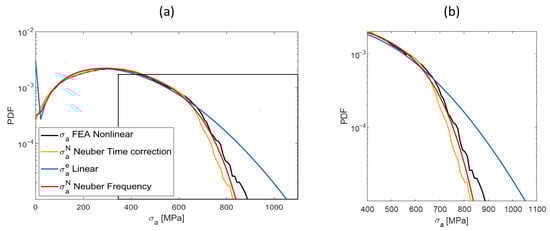
Figure 8.
(a) PDF stress comparison, (b) Zoom of the zone with plasticisation. In black the nonlinear finite element stress PDF, in yellow the linear finite element with time domain Neuber correction stress PDF, in blue, the classical spectral method stress PDF, in red, the strain-based spectral method stress PDF.
It is evident that the stress life fatigue assessment approach is invalid due to the effect of plasticisation. Therefore, a strain-life approach is required. The strain amplitude distribution is compared with the same procedure as for the stress amplitudes. First, an initial CDF comparison is made, followed by a PDF comparison between the various approaches.
Figure 9 shows a comparison of the strain CDFs. It is evident that, for the case study under consideration, there is a high degree of agreement between the nonlinear time domain simulation and the strain-based spectral method. However, there are some differences in the circumstances of strain levels with amplitude greater than , wherein the strain-based spectral technique tends to exaggerate the true deformations. This exaggeration is an inherent limitation common to all spectral methods and arises from the statistical evaluation of the desired range of amplitudes for coverage.
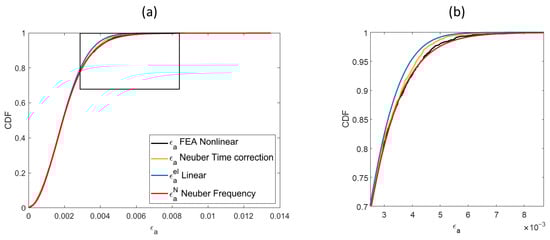
Figure 9.
(a) CDF strain comparison, (b) Zoom of the zone with plasticisation. In black the nonlinear finite element strain CDF, in yellow the linear finite element with time domain Neuber correction strain CDF, in blue, the classical spectral method strain CDF, in red, the strain-based spectral method strain CDF.
It is also noteworthy that the linear spectral approach deviates from the CDF, exhibiting nonlinear behavior around a strain of , as shown in Figure 6. Consequently, this approach tends to underestimate the actual local strains.
In order to compute the fatigue damage in case of strain-life, it is necessary to rebuild the PDFs from the CDFs using Equation (13). The results obtained are shown in Figure 10, which highlights the overestimation of the strain-based spectral method for strains over . Conversely, the linear FEA corrected with Neuber tends to underestimate the actual deformation.
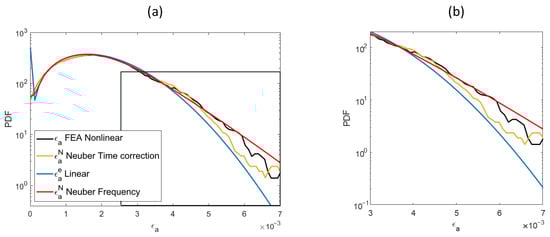
Figure 10.
(a) PDF strain comparison, (b) Zoom of the zone with plasticisation. In black the nonlinear finite element strain PDF, in yellow the linear finite element with time domain Neuber correction strain PDF, in blue, the classical spectral method strain PDF, in red, the strain-based spectral method strain PDF.
In order to comprehend the discrepancies between the assorted methodologies, a comparative analysis of fatigue damage is conducted. The results of the spectral method employed in conjunction with linear material behavior are analyzed using a stress life approach, with the Basquin curve (Table 2) being utilized for this purpose. Conversely, the results obtained from the nonlinear FEA, the linear FEA corrected with Neuber in the time domain, and the strain-based spectral method are analyzed using a strain life approach, with the Manson–Coffin curve (Table 2) being employed for this purpose. As demonstrated in Table 3, the fatigue damage assessment results are presented, with the outcomes from the nonlinear FEA serving as a benchmark. It is evident that the stress life fatigue evaluation results significantly overestimate the actual damage value, with an excess of . This is attributable to the occurrence of material plasticisation. Linear FEA corrected with Neuber in the time domain has been shown to produce highly satisfactory results, with only minor underestimation of damage. Furthermore, this method requires less computation time than nonlinear FEA. In comparison to the nonlinear FEA, the strain-based spectral method has a tendency to overestimate the result (i.e., ) of the percentage of energy dissipation. Nevertheless, the duration required to obtain this result is considerably diminished, from hours to seconds. Moreover, the model under consideration has a very simple geometry, comprising a minimal number of elements. Consequently, this result assumes greater significance for a more complex model, one with millions of elements.
Table 3.
Comparison of fatigue damage methods, reference model Nonlinear FEA.
As demonstrated in Figure 11, a comparison of damage maps on a logarithmic scale is provided. It is evident that nonlinear FEA captures the effect of plasticisation of the specimen in a more realistic manner, while linear FEA with time domain correction and the strain-based spectral method, using Neuber’s rule, makes the intrinsic assumption that the effect of plasticity is local. Furthermore, these methods do not take into account the effect of plasticisation of adjacent elements, which is one of the main drawbacks of Neuber’s rule.
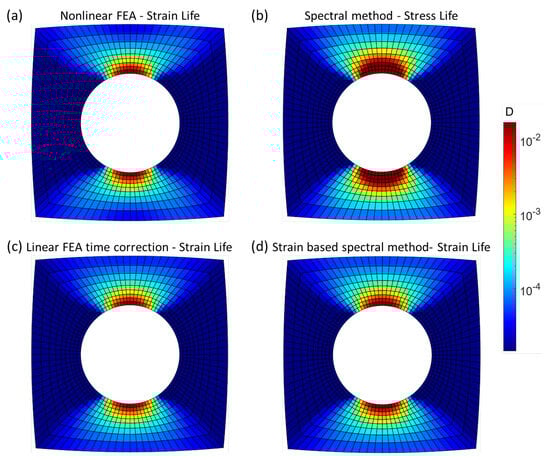
Figure 11.
Logarithmic-scalee comparison of damage maps: (a) nonlinear FEA, strain-life fatigue evaluation; (b) Stress-based spectral method, stress-life fatigue evaluation; (c) linear FEA time domain correction, strain-life fatigue evaluation; (d) strain-based spectral method, strain-life fatigue evaluation.
6. Conclusions
This study successfully demonstrates the viability of strain-based spectral methods for fatigue assessment in elastic-plastic regimes, with the frequency-domain Neuber correction approach showing excellent agreement with nonlinear finite element analysis while providing substantial computational advantages. The proposed strain-based spectral method, utilizing cumulative distribution function correction, evaluates fatigue damage in seconds compared to hours required for traditional FEA approaches, representing a dramatic improvement in computational efficiency without compromising accuracy. Although the method exhibits a conservative tendency with a overestimation in fatigue damage calculations, this characteristic actually enhances safety margins in engineering applications. The current methodology is constrained by its validity for uniaxial loading conditions only and its inability to account for material memory effects and mean stress influences, while applying local plasticity corrections that do not consider element interactions. Future research efforts should focus on experimental validation using real specimens to build industrial confidence and extend the methodology to multiaxial stress states, which would significantly broaden its applicability across diverse engineering scenarios. The demonstrated computational efficiency, combined with reasonable accuracy, positions this strain-based spectral approach as a promising tool for practical fatigue assessment in elastic-plastic regimes, particularly in preliminary design phases where rapid evaluation is essential.
Author Contributions
Conceptualization, F.F. and M.P.; methodology, F.F. and M.P.; software, F.F.; validation, F.F. and M.P.; formal analysis, F.F. and M.P.; investigation, F.F.; resources, F.F.; data curation, F.F. and M.P.; writing—original draft preparation, F.F.; writing—review and editing, F.F., M.P. and F.C.; visualization, F.C.; supervision, F.C.; project administration, F.F. All authors have read and agreed to the published version of the manuscript.
Funding
This research received no external funding.
Institutional Review Board Statement
Not applicable.
Informed Consent Statement
Not applicable.
Data Availability Statement
All data is available upon request.
Conflicts of Interest
The authors declare no conflicts of interest.
References
- Downing, S.; Socie, D. Simple rainflow counting algorithms. Int. J. Fatigue 1982, 4, 31–40. [Google Scholar] [CrossRef]
- Miner, M.A. Cumulative damage in fatigue. J. Appl. Mech. 1945, 12, A159–A164. [Google Scholar] [CrossRef]
- Slavič, J.; Boltezar, M.; Mrsnik, M.; Cesnik, M.; Javh, J. Vibration Fatigue by Spectral Methods: From Structural Dynamics to Fatigue Damage–Theory and Experiments; Elsevier: Amsterdam, The Netherlands, 2020. [Google Scholar]
- Rognon, H.; Da Silva Botelho, T.; Tawfiq, I.; Galtier, A.; Bennebach, M. Modeling of Plasticity in Spectral Methods for Fatigue Damage Estimation of Narrowband Random Vibrations. In Proceedings of the ASME 2011 International Design Engineering Technical Conferences and Computers and Information in Engineering Conference, Washington, DC, USA, 28–31 August 2011; pp. 771–779. [Google Scholar] [CrossRef]
- Rognon, H.; Botelho, T.D.S.; Tawfiq, I.; Bennebach, M. Spectral methods plasticity modeling for fatigue damageestimation: Experimental application–uniaxial case. Mech. Ind. 2014, 15, 233–242. [Google Scholar] [CrossRef]
- Böhm, M.; Kowalski, M.; Niesłony, A. Influence of the Elastoplastic Strain on Fatigue Durability Determined with the Use of the Spectral Method. Materials 2020, 13, 423. [Google Scholar] [CrossRef] [PubMed]
- Kara, A.; Benasciutti, D. On applying the Neuber’s rule to spectral fatigue damage estimation under elasto-plastic strain. Procedia Struct. Integr. 2024, 61, 98–107. [Google Scholar] [CrossRef]
- Bendat, J.S.; Piersol, A.G. Random Data: Analysis and Measurement Procedures; John Wiley & Sons: Hoboken, NJ, USA, 2011. [Google Scholar]
- Rice, S.O. Mathematical analysis of random noise. Bell Syst. Tech. J. 1944, 23, 282–332. [Google Scholar] [CrossRef]
- Dirlik, T.; Benasciutti, D. Dirlik and Tovo-Benasciutti Spectral Methods in Vibration Fatigue: A Review with a Historical Perspective. Metals 2021, 11, 1333. [Google Scholar] [CrossRef]
- Manson, S.S.; Halford, G.R. Fatigue and Durability of Structural Materials; ASM International: Materials Park, OH, USA, 2006. [Google Scholar]
- Benasciutti, D.; Tovo, R. Spectral methods for lifetime prediction under wide-band stationary random processes. Int. J. Fatigue 2005, 27, 867–877. [Google Scholar] [CrossRef]
- Dirlik, T. Application of Computers in Fatigue Analysis. Ph.D. Thesis, University of Warwick, Coventry, UK, 1985. [Google Scholar]
- Neuber, H. Theory of Stress Concentration for Shear-Strained Prismatical Bodies with Arbitrary Nonlinear Stress-Strain Law. J. Appl. Mech. 1961, 28, 544–550. [Google Scholar] [CrossRef]
- Fraser, R.C. The Simulation of Local Stress-Strain Behaviour with Application to Fatigue Analysis; Structures Report 385; Aeronautical Research Laboratories: Melbourne, Australia, 1979. [Google Scholar]
- Ramberg, W.; Osgood, W.R. Description of Stress-Strain Curves by Three Parameters; Technical Note No. 902; National Advisory Committee for Aeronautics: Washington, DC, USA, 1943. [Google Scholar]
- eFatigue.com. Materials—Constant Amplitude Fatigue. 2025. Available online: https://www.efatigue.com/constantamplitude/materials/ (accessed on 1 July 2025).
- Chaboche, J.L. A review of some plasticity and viscoplasticity constitutive theories. Int. J. Plast. 2008, 24, 1642–1693. [Google Scholar] [CrossRef]


Disclaimer/Publisher’s Note: The statements, opinions and data contained in all publications are solely those of the individual author(s) and contributor(s) and not of MDPI and/or the editor(s). MDPI and/or the editor(s) disclaim responsibility for any injury to people or property resulting from any ideas, methods, instructions or products referred to in the content. |
© 2026 by the authors. Licensee MDPI, Basel, Switzerland. This article is an open access article distributed under the terms and conditions of the Creative Commons Attribution (CC BY) license.