Abstract
We developed a Bluetooth Low Energy-based indoor asset-tracking system oriented toward elderly care and cultural heritage stewardship. The system stabilizes the noisy received signal strength indicator using a Kalman filter, adapts a logarithmic path loss model to local attenuation via dynamic calibration, and estimates positions with an inverse distance weighted centroid. Built on inexpensive beacons and commodity gateways, it supports real-time updates and map-based visualization while remaining easy to deploy and scale across rooms and facilities. We validate the pipeline in a laboratory grid and discuss applicability to workflows such as geofenced reminders, caregiver situational awareness, and collection movement oversight, offering an affordable, interoperable path to reliable indoor tracking for care institutions, museums, and smart buildings.
1. Introduction
Indoor positioning is critical for various IoT applications, particularly where GPS is ineffective due to signal blockage and multipath interference. Technologies such as ultra-wideband (UWB), Wireless Fidelity (Wi-Fi), and radio frequency identification (RFID) each have limitations in cost, accuracy, or applicability [1,2]. BLE is a promising solution due to its accessibility and low cost [3,4]. However, received signal strength indicator (RSSI)-based distance estimation is often unstable in indoor environments [3,5,6]. We developed a BLE-based indoor positioning system integrating Kalman filtering and a dynamically optimized path loss model [3,5]. By employing Raspberry Pi devices and inverse distance weighted centroid positioning, the system achieves real-time, sub-meter accuracy with minimal hardware requirements [7]. The low-cost BLE platform delivers high-precision indoor positioning, offering a practical solution for IoT applications with minimal infrastructure overhead.
2. Related Work
2.1. Overview of Indoor Positioning Technologies
At present, indoor positioning methods can be broadly categorized into two main types: wireless signal-based and physical property-based methods.
2.1.1. Wireless Signal-Based Positioning Methods
Time difference of arrival (TDOA) positioning based on Wi-Fi relies on signal strength fingerprint matching, as exemplified by the RADAR system. This approach requires the construction of an offline database and enables real-time comparison during operation. However, it is susceptible to multipath effects, human movement, and electronic interference, which result in accuracy fluctuations typically within two to five meters.
Ultra-wideband (UWB) positioning employs nanosecond-level narrow pulses to achieve high precision, ranging from 10 to 30 cm, through TIME OF ARRIVAL (TOA) or TDOA measurements. While UWB offers strong anti-interference capabilities and penetration, its widespread adoption is limited by high equipment costs, complex base station deployment requirements, and significant power consumption.
ZigBee positioning is a low-power, low-data-rate technology in which multiple nodes form a network. Positioning is achieved using signal strength and distance measurements combined with trilateration or centroid algorithms. ZigBee systems are characterized by strong self-organizing capabilities and low power consumption. However, they suffer from a limited transmission distance and meter-level accuracy, making them most suitable for large-scale sensor networks where only low precision is required [8].
2.1.2. Physical Property-Based Positioning Methods
Infrared positioning utilizes modulated infrared signals transmitted by emitters and received by indoor optical sensors. This method achieves high positioning accuracy in unobstructed environments due to the straight-line propagation of infrared signals. Nevertheless, it is vulnerable to obstruction by physical barriers and interference from ambient light in complex indoor settings. These limitations restrict its application to short-distance, line-of-sight scenarios, and the high deployment costs further constrain its use.
Ultrasonic positioning relies on the propagation characteristics of ultrasonic waves in air. Distances are calculated by measuring the time of flight (TOF) of ultrasonic signals from transmitters to receivers. Systems such as Cricket can achieve positioning accuracy within 30 cm. However, ultrasonic propagation is significantly affected by multipath effects and non-line-of-sight conditions. In addition, the hardware requires precise synchronization, which increases costs and limits practical application scenarios.
Geomagnetic positioning leverages the relatively stable characteristics of the Earth’s magnetic field in indoor environments. Locations are determined by measuring the magnetic field strength and direction around the device and matching these values with pre-collected geomagnetic fingerprint databases. This method eliminates the need for additional hardware deployment. However, it is prone to interference from metallic objects and electrical equipment, which can lead to unstable positioning accuracy, typically within a few meters.
2.2. BLE Positioning
BLE positioning, as a mainstream indoor positioning technology, has been widely applied in recent years. By improving the existing Bluetooth positioning method, the new solution addresses indoor positioning problems with a high precision and stable control signal [2,7].
iBeacon devices periodically broadcast BLE signals, and receivers (such as smartphones, Raspberry Pi, etc.) estimate distance by parsing the Received Signal Strength Indicator (RSSI). Based on the logarithmic path loss model, RSSI is calculated as follows [2,4].
where A is the reference signal strength at 1 m (measured to be approximately −55 dBm in indoor environments), n is the path loss exponent (indoor values typically between 2.8–3.5), d0 = 1 m, and ξ is Gaussian-distributed random noise (standard deviation approximately 7 dBm). Through this model, the distance between the transmitter and receiver can be inversely calculated based on RSSI values.
2.3. Positioning Algorithm and Design
Multiple iBeacon devices are deployed in indoor environments, where receivers obtain RSSI values from at least three beacons and calculate the corresponding distances. By treating the beacons as circle centers and the calculated distances as radii, circles are drawn to estimate the receiver’s position. Theoretically, the position is determined by the intersection of three circles. However, in practice, measurement errors create an error region formed by multiple intersecting circles. This method is relatively simple to implement, but RSSI values are highly susceptible to environmental interference, resulting in positioning accuracy typically within three to five meters [4,5].
To enhance positioning accuracy, filtering and noise reduction, techniques such as Kalman filtering are commonly applied. Through iterative updates of state and observation equations, RSSI estimates are refined, thereby suppressing the impact of environmental noise on signals. In addition, least squares methods can be used to fit path loss parameters. By collecting multiple sets of distance–RSSI data across different areas, matrix equations are constructed to solve for optimal values of parameters A and n. This approach adapts to indoor multipath effects and environmental variability, further optimizing positioning performance [3,5,6].
3. Methodology
3.1. Kalman Filter Signal Noise Reduction
Targeting multipath effects and non-line-of-sight (NLOS) interference in laboratory testbed environments, a discrete-time state-space model was constructed as follows [3]. The state equation is defined as follows.
where process noise, characterizes random signal fluctuations in open fields, x(k) is the RSSI state estimate at time k; w(k) is process noise following the Gaussian distribution w(k) ~ N(0, Q) Q = 0.1, describing random effects of environmental interference (such as multipath effects, and electromagnetic noise) on signals. Based on laboratory testbed indoor environment characteristics, noise covariance Q is set to 0.1.
x(k) = x(k − 1) + w(k)
The observation equation is as follows.
where measurement noise adapts to sudden interference caused by personnel movement, z(k) is the actual RSSI measurement at time k, collected by Raspberry Pi data, and v(k) is measurement noise (assumed Gaussian with variance R). In this 1D RSSI model, the observation matrix is H = 1.
z(k) = x(k) + v(k)
3.2. Kalman Filtering Iteration
The filtering iteration process is as follows. State and covariance are estimated using the following equations.
where (k|k − 1) is the predicted RSSI at time k given measurements up to k − 1, (k − 1|k − 1) is the posterior estimate at time k − 1, and P(·) denotes the corresponding estimation error covariance. We set the process noise variance Q = 0.1 and the measurement noise variance R = 7 based on the laboratory testbed measurements.
State is updated using Equation (6).
The state correction equation is defined as follows.
where K(k) is the Kalman gain, which balances the contributions of the predicted and observed values. A larger K(k) places more weight on the observation (larger correction), whereas a smaller K(k) relies more on the prediction. Here, R = 7 denotes the measurement-noise variance, corresponding to v(k) ~ N(0, 7) in the observation equation. The innovation term z(k) − (k|k − 1) represents the prediction residual.
In the state correction equation, represents the new optimal RSSI estimate obtained at time k after fusing observation data at time k. This is the final output, corrected high-precision RSSI value used for subsequent distance calculations. z(k) represents the original RSSI observation value actually collected by the Raspberry Pi at time k, i.e., the original signal without filtering processing. represents observation residual, i.e., the difference between the actual observation value and predicted value. The larger the difference, the greater the required correction amplitude.
3.3. RSSI–Distance Model Dynamic Optimization
The logarithmic path loss model is used to describe signal attenuation [5,6].
Environment parameters for the laboratory testbed are fitted using the least squares method [5].
RSSI data was collected at 256 test points, forming an overdetermined system of equations.
where dm is the actual distance from the test point to the iBeacon, and RSSIm is the corresponding filtered mean RSSI at that distance.
The overdetermined system is converted to matrix form K·θ = B, where the optimal solution is obtained through the pseudo-inverse matrix.
The optimal solution is as follows.
where K is the coefficient matrix and B is the RSSI observation vector. Through dynamic fitting, it adapts to environmental changes such as indoor walls and personnel movement, improving ranging accuracy [6].
By converting the matrix, Kθ = B, the optimal solution is obtained by means of a pseudo-inverse matrix.
The logarithmic path loss model describes signal attenuation patterns, where RSSI is the stable signal strength after Kalman filtering, A is the baseline signal value at 1 m reference distance, n is the path loss exponent adapted to the laboratory testbed environment, and d is the distance between the transmitter and receiver. To adapt to the laboratory testbed environment, data was collected at 256 test points to construct an overdetermined system of equations, solved through matrix form Kθ = B and pseudo-inverse, obtaining optimal parameters (A = −55.34, n = 2.65), making ranging errors throughout the area converge within 0.3 m, validating the supporting role of model dynamic optimization for high-precision positioning.
4. Experiment
4.1. Study Site
We selected the school laboratory testbed as the experimental development space, utilizing its open and relatively controllable interference environment characteristics. Within the laboratory testbed, a 5 × 5 m rectangular open space was precisely designated as the core experimental area. To refine signal collection and positioning verification dimensions, using 0.3 m as the node spacing, a regular grid was constructed within this open space, forming multiple test nodes (specific number: 5/0.3 ≈ 16 nodes/side, total 16 × 16 = 256 nodes), covering different spatial positions within the experimental area to simulate diverse distribution scenarios of mobile devices.
In the deployment, three iBeacon devices were fixed at preset coordinate points (e.g., the vertices) of the 5 m × 5 m area as signal transmitters. A Raspberry Pi (BLE scanner) was placed at each grid node for 1–3 min to collect RSSI from all three beacons, providing sufficient measurements for distance estimation and positioning verification (Figure 1).
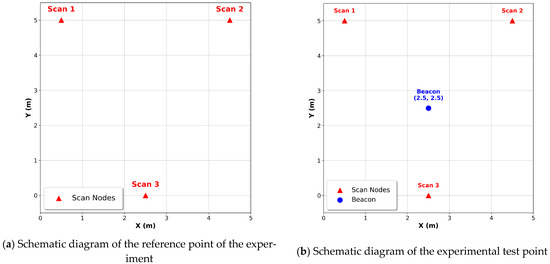
Figure 1.
(a) The red triangle is a device that scans Bluetooth signals. (b) Currently, detection devices are being deployed in the test area, with the blue devices being beacon devices that emit Bluetooth signals.
4.2. Experimental Process
The experimental process is shown in Figure 2.
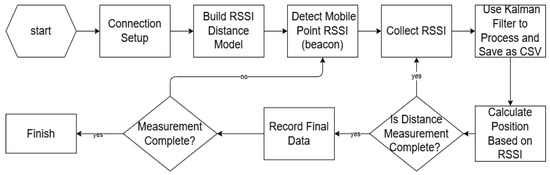
Figure 2.
Experiment process.
The process begins by establishing connections and building the system hardware setup. Three iBeacon devices are fixed at the vertex coordinates of the experimental area to serve as signal sources, while Raspberry Pi 4B units integrated with BLE modules are deployed as receivers at each test node to ensure normal communication among devices. An RSSI distance model is then established based on the logarithmic path loss model. Data are collected from 256 grid nodes at 0.3 m intervals, and the least squares method is used to calibrate the path loss model by estimating A = −55.34 and n = 2.65 for the laboratory testbed. This step establishes the mapping relationship between RSSI values and distance.
Next, the RSSI of the moving point is detected. At each test node, the Raspberry Pi remains stationary for 1 to 120 s, during which RSSI data are collected from the three iBeacons at a frequency of 1 Hz. The collected RSSI values are then summarized to ensure that each test node contains a sufficient number of valid data points. The data are saved in CSV format to facilitate management, viewing, and subsequent processing and analysis.
The collected data are subsequently processed using a Kalman filter. A discrete-time state-space model is constructed for iterative filtering to address the effects of multipath propagation and non-line-of-sight interference. This reduces the standard deviation of RSSI values and improves signal stability. Sample RSSI values after Kalman filtering at selected grid points are presented in Table 1.

Table 1.
Sample RSSI values after Kalman filtering at selected grid points.
Distances are then calculated by converting the filtered RSSI values into corresponding distance estimates using the established distance model. The receiver’s position is determined using the inverse distance weighted centroid algorithm, which calculates weights and solves the position coordinates based on the coordinates of the three iBeacons and the calculated distances d1, d2, and d3.
Finally, the calculated position coordinates and other results are recorded as experimental outputs for subsequent analysis and verification. If the measurement process is not yet complete, the procedure returns to the step of detecting the RSSI of the moving point to continue measurements at the next node. If the process is complete, the entire experiment is completed.
5. Results
Weighted Centroid Positioning Algorithm Calculation
Three beacon coordinates A1(2.5, 0), A2(0, 5), and A3(5, 5) are defined based on filtered distances d1, d2, and d3. Then, a weight is calculated.
The coordinate is calculated as follows.
Taking test point (2.5, 2.5) as an example, measured RSSI-converted distances are estimated as follows.
The weight is calculated as follows.
The solved coordinates are (2.5, 2.43), with an error of 0.07 m.
The RSSI optimization results after Kalman filtering are shown in Figure 3.
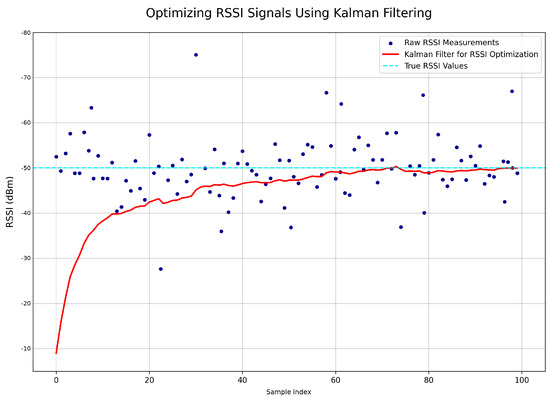
Figure 3.
Optimizing RSSI Signals Using Kalman Filtering.
6. Conclusions
We designed and implemented an indoor positioning system based on iBeacon and Raspberry Pi, achieving 0.3 m positioning accuracy and real-time updates once per second in a 5 m × 5 m laboratory testbed environment, providing a feasible solution for low-cost, high-precision indoor positioning. Considering the characteristics of open environments, we constructed a complete signal optimization and positioning calculation process and designed specialized Kalman filter parameter settings, reducing the RSSI standard deviation from 8.7 to 2.3 dBm and achieving 73.6% noise suppression. Through large-scale data collection at 256 high-density test points, localized path loss model parameters were established, significantly improving environmental adaptability. In terms of positioning algorithms, the proposed improved distance inverse weighted centroid algorithm achieved 39% accuracy improvement compared to traditional trilateration.
The current research has limitations, mainly reflected in verification only in open environments, the test area being limited to a 5 × 5 m range, and relatively single algorithms. For multi-sensor fusion, hierarchical collaboration between BLE, IMU, Wi-Fi, and UWB will be explored. BLE serves as the primary solution in static scenarios; in dynamic or occluded environments, IMU is employed for short-term extrapolation, with UWB integrated for calibration in critical areas. When expanding to large-scale or complex settings (e.g., multi-floor environments), signal attenuation and cross-floor switching must be addressed through distributed beacon deployment, a 3D coordinate system, and anchor beacons to ensure positioning continuity. Additionally, deep learning will be introduced to develop LSTM-based RSSI prediction models and CNN-based fingerprint positioning models, thereby enhancing the system’s forward-looking capabilities and adaptability.
The proposed system is applicable to indoor asset and personnel tracking scenarios such as care facilities, hospitals, museums, office buildings, and warehouse logistics, providing a practical foundation for scalable BLE-based indoor positioning.
Author Contributions
Conceptualization, K.H. and M.C.; methodology, K.H.; software, J.C.; validation, K.H. and M.C.; formal analysis, K.H. and M.C.; investigation, J.Z., I.-C.L., J.P., C.G. and J.C.; resources, K.H.; data curation, J.C.; writing—original draft preparation, J.Z.; writing—review and editing, K.H. and M.C.; visualization, J.C.; supervision, K.H.; project administration, J.Z.; funding acquisition, M.C. All authors have read and agreed to the published version of the manuscript.
Funding
The Conservation and Research Center, Cheng Shiu University, Kaohsiung, Taiwan 833301.
Institutional Review Board Statement
Not applicable.
Informed Consent Statement
Not applicable.
Data Availability Statement
The data presented in this study are available on request from the corresponding author. The data are not publicly available due to privacy/ethical restrictions.
Conflicts of Interest
The authors declare no conflict of interest.
References
- Shih, S.T.; Hsieh, K.; Chen, P.Y. An Improvement Approach of Indoor Location Sensing Using Active RFID. In Proceedings of the First International Conference on Innovative Computing, Information and Control (ICICIC 2006), Beijing, China, 30 August–1 September 2006; pp. 453–456. [Google Scholar]
- Ni, L.M.; Liu, Y.; Lau, Y.C.; Patil, A.P. LANDMARC: Indoor location sensing using active RFID. Wirel. Netw. 2004, 10, 701–710. [Google Scholar] [CrossRef]
- Alsmadi, L.; Kong, X.; Sandrasegaran, K. Improve Indoor Positioning Accuracy Using Filtered RSSI and Beacon Weight Approach in iBeacon Network. In Proceedings of the 19th International Symposium on Communications and Information Technologies (ISCIT 2019), Ho Chi Minh City, Vietnam, 25–27 September 2019; pp. 42–46. [Google Scholar]
- Yang, J. Research on Deployment Strategies and Positioning Algorithms for Low-Power Bluetooth Anchor Nodes for Indoor Localization. Master’s Thesis, Harbin Engineering University, Harbin, China, 2024. [Google Scholar]
- Peng, D.; Peng, L.; Yang, Y. Optimization of indoor Bluetooth ranging model based on RSSI. Front. Signal Process. 2021, 1, 45–53. [Google Scholar] [CrossRef]
- Qiao, X.; Chang, F.; Wang, J.; Wang, X.; Jiang, Y. Coal mine underground positioning algorithm based on RSSI model correction and node cooperation. Arch. Min. Sci. 2025, 70, 45–62. [Google Scholar] [CrossRef]
- Wang, W.; Liu, X.; Li, M.; Zhang, H.; Yu, Y. Optimizing node localization in wireless sensor networks based on received signal strength indicator. IEEE Access 2019, 7, 125758–125768. [Google Scholar] [CrossRef]
- Chen, P.Y. Application of ZigBee Technology in Wireless Location Tracking System. Master’s Thesis, Zhengzhou University of Science and Technology, Zhengzhou, China, 2007. [Google Scholar]


Disclaimer/Publisher’s Note: The statements, opinions and data contained in all publications are solely those of the individual author(s) and contributor(s) and not of MDPI and/or the editor(s). MDPI and/or the editor(s) disclaim responsibility for any injury to people or property resulting from any ideas, methods, instructions or products referred to in the content. |
© 2026 by the authors. Licensee MDPI, Basel, Switzerland. This article is an open access article distributed under the terms and conditions of the Creative Commons Attribution (CC BY) license.