Abstract
We researched, analyzed and predicted building energy consumption data using cloud computing and constructed an intelligent model. A local outlier factor outlier discovery algorithm was created to monitor abnormal energy consumption. A random forest algorithm was used for high-dimensional data to predict building energy consumption and analyze data in the Commercial Building Energy Consumption Survey database. The degree of importance of independent variables was evaluated to analyze how the architectural attributes of office buildings affect energy consumption.
1. Introduction
As an industrial power of the world, China consumes considerable energy, accounting for about 23% of global energy consumption. However, its overall utilization efficiency is very low, at only 36.3% compared with other countries with 10% higher efficiency. In those countries, buildings are a major source of energy consumption [1]. Buildings are one of the important energy use sources when considering how to control consumption and achieve energy conservation and emission reduction.
In building energy consumption analysis and monitoring research, monitoring systems have been developed based on mature and widely used technologies [2]. These technologies have been developed by MEILEK in Germany, the ABB company in Sweden, ARAD in Israel, and other companies based on bus communication. Intellon, Enika, Thomosn, Atlnel, National and other companies have also developed related technologies based on power line carrier technology communication. Wireless communication technology is also used by Swedish ABB and other companies.
At present, China’s large-scale public energy consumption data collection technology is still in the initial stage [3]. Energy consumption data collection means are still in development, but the development of technology has gradually transformed traditional manual methods into automated data collection methods. Various data acquisition methods are being introduced to energy consumption monitoring through automation and networking. The literature review results show that a lack of complete building information and reliable energy consumption data limits current research on energy consumption analysis, especially the assessment of the impact of high-dimensional variables on energy consumption [4,5,6,7].
2. Data Analysis Model Based on Data Mining
2.1. Outlier Analysis
Abnormal values of energy consumption are caused by deviation between the energy consumption values monitored and predicted [8]. The circumstances that cause the abnormal value of energy consumption generally fall into the following three categories.
- The power consumption equipment of the monitored building fails, and the energy consumption value obtained is too large or too small.
- The operating state of the monitored building is different from usual, and the energy consumption value obtained is too large or too small.
- The energy consumption monitoring system’s collection and measurement equipment is abnormal or the network is faulty, and the energy consumption data is lost or the value is too small.
2.2. Local Outlier Factor (LOF) Algorithm
The main idea of the LOF algorithm is to identify the outliers of a sample by estimating the degree of separation between that sample and its neighborhood. In Figure 1, C1 is a low-density region, and C2 is a high-density region. The density is computed as measured by the distance between points P, C1, and C2. Outliers are determined by evaluating the relative density of each point P to its neighbors, where density is defined in terms of the distance between points. As the distance between points increases, the density decreases, and vice versa [9]. Density is calculated based on localized data rather than global data. The LOF algorithm does not directly label samples as “abnormal” or “non-abnormal”, but rather assigns each sample an outlier score that reflects the degree of abnormality, i.e., the degree to which it deviates from the normal data distribution.
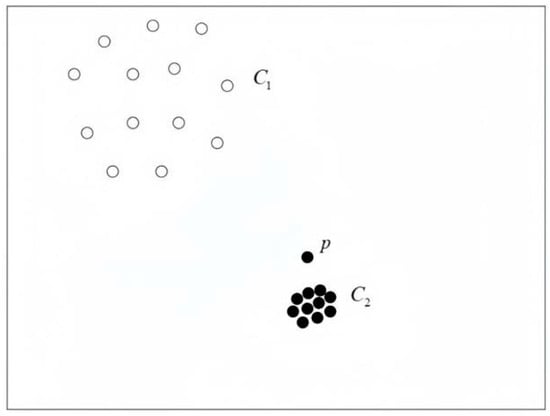
Figure 1.
LOF algorithm’s identification of outlier.
2.3. Energy Consumption Prediction Algorithm
We adopted a random forest algorithm to process high-dimensional data and predict building energy consumption. Leveraging the advantages of a random forest, this algorithm deals with multi-classification problems, as it is insensitive to missing values of data and provides data on the importance of features. Specifically, a random forest is made up of multiple trees [10]. The training set used by each tree is obtained from the original sample set with sampling, while the feature set is obtained from the original feature set with sampling in a certain proportion. The total number of features is set to n, then this ratio becomes . For a new test sample, each tree presents its result, and the final result is a combination of the results from each tree. The algorithm’s process in a random forest is as follows.
- Set the training set with n samples, and repeatedly sample these samples as a new dataset when building each tree.
- Select m (m < n) features from the original feature set as the new feature set.
- Construct a decision tree based on the new training set and feature set without pruning.
- Predict new test samples by combining the results of all decision trees.
This random forest was chosen for a building energy consumption prediction algorithm as it gives the importance measure of features. In theory, the overlap rate between the subsample set and the original sample set is 63.2%. Samples not used in the algorithm are called out-of-pocket data [11]. There are many ways to measure the importance of random forest variables. In this study, mean decrease accuracy (MDA) was used to measure the importance of random forest variables. MDA is defined as the average reduction in prediction accuracy after slight perturbation of attribute value and prediction accuracy before perturbation of out-of-pocket data.
3. Results and Discussion
3.1. Dataset
Building information and energy consumption data were obtained from the Commercial Building Energy Consumption Survey (CBECS) database [12]; 22 variables in the CBECS database were selected for mining analysis in this study, as shown in Table 1.

Table 1.
Description of variables.
3.2. Data Preprocessing
Considering the large size of the attribute variables and sample set of the target building in the database, many statistics may be missing, which affects the performance of the algorithm. Therefore, it was necessary to process missing data. In this process, the attribute variables of a building were defined as X1, X2, …, Xn, while the missing variables were defined as miss1, miss2, …, missn. When the jth attribute variable missj > 0.1, the attribute variable was removed [13]. When an attribute variable had a high missing rate, the value of null was assigned or it was removed. The process of preprocessing the data is as follows.
- The average annual electricity consumption and average annual natural gas energy consumption are unified as heat units.
- The annual average energy consumption of the final target variable is calculated.
- Each attribute variable with too high a missing rate is removed to calculate the missj rate of each attribute variable. If missj > 0.1, the attribute variable is removed.
- Each sample with too high a missing rate is removed. If the value of the sample on a certain attribute is null, then the sample is removed [14].
The pre-processed data set contained 425 samples from the CBECS database.
3.3. Evaluation Indicators
To predict the energy consumption of each building, we used the random forest regression algorithm. This is a powerful regression tool used to evaluate the metrics of the regression model. Here, we chose explained variance (EV) as the evaluation index, which is a value located between 0 and 1. The closer the value is to 1, the better the prediction of the model. Also, a random forest is an efficient prediction algorithm whose predictive performance is evaluated by comparing predicted and actual values, which usually involves calculating different types of average errors. Specifically, we used the mean absolute error (MAE) as one of the evaluation metrics. For N samples, each with a predicted value of (i = 1, 2, …, N) and a true value of yi (i = 1, 2, …, N), the MAE is defined as
Also commonly used is the mean square error (MSE), expressed as
The mean square error (MSE) is more widely used than the MAE, as the MSE is easier to calculate and crucial for analyzing errors [15]. However, the MSE and the target variable do not have the same units, so users cannot quickly understand the size of the error and evaluate the predictive performance of the model. Therefore, normalized MSE (NMSE) is used to compare to the average of the target variable. In other words, all target variables are predicted as the average of target variables, and the prediction model is used as the baseline model to calculate the MSE of the baseline model [16]. The NMSE ranges from 0 to 1. If the model predicts higher performance than the benchmark model, then the NMSE is less than 1, and the smaller the value, the better the model performs.
3.4. Analysis of Results
All data preprocessing and machine learning algorithms in this study were implemented using Python software (version 3.9, Python Software Foundation, Wilmington, DE, USA) and the scikit-learn library. The cloud computing and model training tasks were executed on an Alibaba Cloud server (Alibaba Cloud Computing Co., Ltd., Hangzhou, China).To avoid overfitting problems in the model, the ratio of the training sample and test sample sets was set as 3:1, and the number of trees was set as 50, 100, …, 500. The random forest model adopted the smallest error for the final model. The regression algorithm index built by the random forest on the training set is shown in Table 2.
Table 2.
Indicators of regression algorithm built by random forest on training set.
When the number of trees was 50 to 500, the index of the random forest algorithm on the training set included the residual square mean and the proportion of variance interpretation. The performance indicators of the algorithm on the test set included the MAE and NMSE after standardization [17]. The increase in the number of trees and the residual square mean on the training set decreased, while the proportion of variance explanation increased. The closer the proportion of variance explanation was to 1, the better the model’s performance. The variance ratio and NMSE with the number of trees is shown in Figure 2.
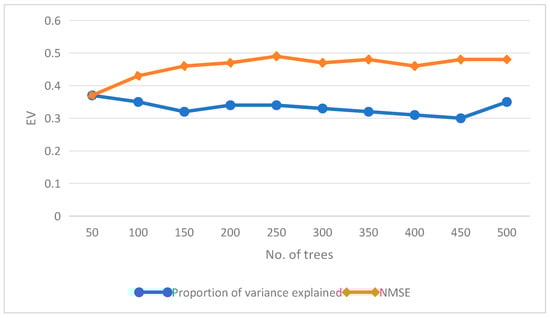
Figure 2.
Variation trend of variance interpretation ratio and NMSE with number of trees.
When the number of trees increased from 50 to 200, the proportion of variance interpretation increased, while when the number of trees increased to 250, the proportion of variance interpretation no longer increased and showed fluctuation [18]. Similarly, the NMSE decreased with an increase in the number of trees and fluctuated when the number of trees was 150. The trend of the NMSE did not explain the proportion of variance significantly, because the NMSE presented the performance on the test set, and its results became unstable. Therefore, the number of trees was set at 250.
To evaluate the performance of the algorithm, we used a scatterplot for visual analysis. We drew scatter plots on the training and test sets with predicted values as the horizontal axis and true values as the vertical axis. The scatterplot of the training set is shown in Figure 3, while the scatterplot of the test set is shown in Figure 4. With these two scatter plots, the proximity between the predicted and real values was visualized to assess the prediction accuracy of the algorithm.
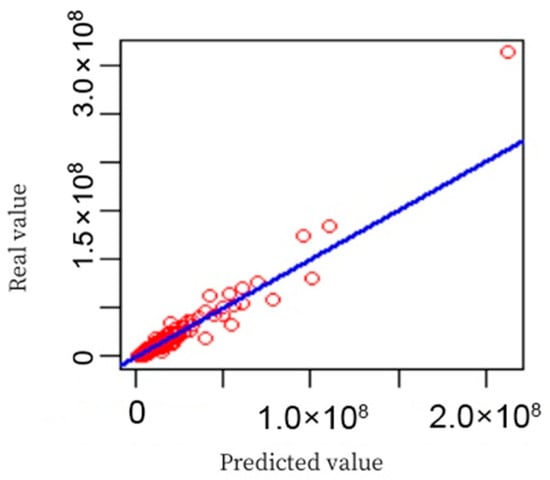
Figure 3.
Training set scatterplot. The red circles represent individual data samples, and the solid blue line represents the fitting line. The closer the data points are to the blue line, the smaller the prediction error.
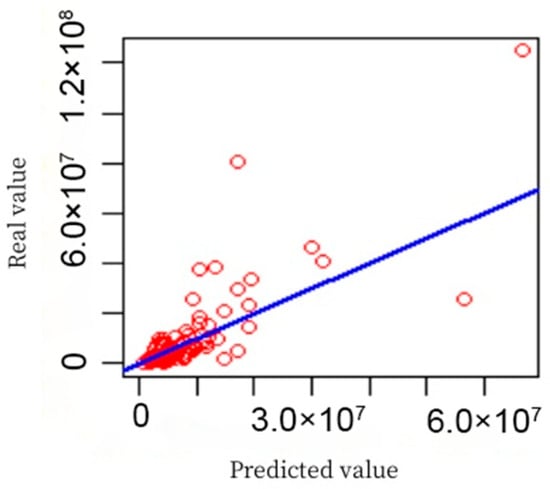
Figure 4.
Test hub diagram. The red circles represent individual data samples, and the solid blue line represents the fitting line. The closer the data points are to the blue line, the smaller the prediction error.
Most points in Figure 3 fall on the blue line, and only one point deviates from the blue line, indicating that the model had a good fitting effect [19]. Figure 4 shows more points that deviate from the blue line, but they still fluctuate around the blue line in general. Most variables scored very low, while only a few variables scored much higher than others did. For this reason, the top ten variables were selected, and their scores are shown in a bar chart in Figure 5.
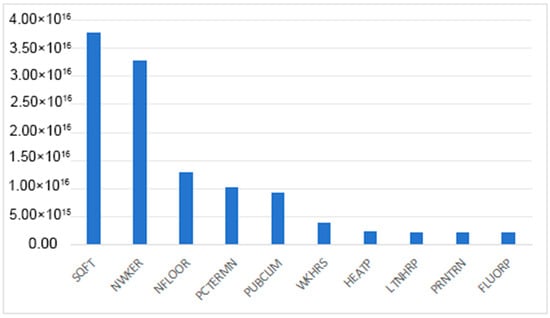
Figure 5.
Importance scores of top ten variables.
SQFT and NWKER were the most effective energy consumption strategies, so they were classified into the first influence level, while NFLOOR, PCTERMN and PUBCLIM belonged to the second influence level, and the remaining variables were classified as the third influence level.
4. Conclusions
The development of electronic and information technology provides new programs to reduce building energy consumption. An intelligent model for building energy consumption analysis and monitoring was developed in this study. The LOF algorithm was used to monitor abnormal energy consumption with the random forest algorithm. High-dimensional data were used to predict building energy consumption obtained from the CBECS database. The degree of importance of the independent variables was determined using the average declining accuracy and analyzing how the architectural attributes of office buildings affected energy consumption. Given the significant differences in the internal structure of various types of public buildings and the numerous and complex factors affecting energy consumption, it is challenging to construct a unified and detailed classification and itemization energy consumption monitoring model that can be applied to most public buildings. This challenge makes it difficult for energy monitoring systems to accurately implement effective energy monitoring and data collection for each energy-consuming item of a building in engineering. This affects the accuracy of the overall energy consumption of the building and the accuracy of energy efficiency assessment. Given this situation, future research is needed to explore and apply intelligent cloud-computing models.
Author Contributions
Conceptualization, L.H. and X.R.; methodology, L.H.; software, X.R.; writing—original draft preparation, L.H.; writing—review and editing, X.Z. All authors have read and agreed to the published version of the manuscript.
Funding
This research received no external funding.
Institutional Review Board Statement
Not applicable.
Informed Consent Statement
Not applicable.
Data Availability Statement
Publicly available datasets were analyzed in this study. The Commercial Buildings Energy Consumption Survey (CBECS) data can be found here: https://www.eia.gov/consumption/commercial/ (accessed on 3 March 2026).
Conflicts of Interest
Author Xiangfeng Ren was employed by the company China Nuclear Industry Fifth Construction Co., Ltd. The remaining authors declare that the research was conducted in the absence of any commercial or financial relationships that could be construed as a potential conflict of interest.
References
- Amasyali, K.; El-Gohary, N.M. A review of data-driven building energy consumption prediction studies. Renew. Sustain. Energy Rev. 2018, 81, 1192–1205. [Google Scholar] [CrossRef]
- Somu, N.; Raman M R, G.; Ramamritham, K. A deep learning framework for building energy consumption forecast. Renew. Sustain. Energy Rev. 2021, 137, 110591. [Google Scholar] [CrossRef]
- Bourdeau, M.; Zhai, X.Q.; Nefzaoui, E.; Guo, X.; Chatellier, P. Modeling and forecasting building energy consumption: A review of data-driven techniques. Sustain. Cities Soc. 2019, 48, 101533. [Google Scholar] [CrossRef]
- Khalil, M.; McGough, A.S.; Pourmirza, Z.; Pazhoohesh, M.; Walker, S. Machine Learning, Deep Learning and Statistical Analysis for forecasting building energy consumption—A systematic review. Eng. Appl. Artif. Intell. 2022, 115, 105287. [Google Scholar] [CrossRef]
- Somu, N.; Raman M R, G.; Ramamritham, K. A hybrid model for building energy consumption forecasting using long short term memory networks. Appl. Energy 2020, 261, 114131. [Google Scholar] [CrossRef]
- Chen, Y.; Guo, M.; Chen, Z.; Chen, Z.; Ji, Y. Physical energy and data-driven models in building energy prediction: A review. Energy Rep. 2022, 8, 2656–2671. [Google Scholar] [CrossRef]
- Divina, F.; Torres, M.G.; Vela, F.A.G.; Noguera, J.L.V. A comparative study of time series forecasting methods for short term electric energy consumption prediction in smart buildings. Energies 2019, 12, 1934. [Google Scholar] [CrossRef]
- Seyedzadeh, S.; Pour Rahimian, F.; Glesk, I.; Roper, M. Machine learning for estimation of building energy consumption and performance: A review. Vis. Eng. 2018, 6, 1–20. [Google Scholar] [CrossRef]
- Olu-Ajayi, R.; Alaka, H.; Sulaimon, I.; Sunmola, F.; Ajayi, S. Building energy consumption prediction for residential buildings using deep learning and other machine learning techniques. J. Build. Eng. 2022, 45, 103406. [Google Scholar] [CrossRef]
- Gao, Y.; Ruan, Y.; Fang, C.; Yin, S. Deep learning and transfer learning models of energy consumption forecasting for a building with poor information data. Energy Build. 2020, 223, 110156. [Google Scholar] [CrossRef]
- González-Torres, M.; Pérez-Lombard, L.; Coronel, J.F.; Maestre, I.R.; Yan, D. A review on buildings energy information: Trends, end-uses, fuels and drivers. Energy Rep. 2022, 8, 626–637. [Google Scholar] [CrossRef]
- Parekh, R. Comparison Analysis of Construction Costs according to LEED and non-LEED Certified Educational Buildings. SSRN 2024, 4924703. [Google Scholar] [CrossRef]
- Alzoubi, A. Machine learning for intelligent energy consumption in smart homes. Int. J. Comput. Inf. Manuf. (IJCIM) 2022, 2, 62–75. [Google Scholar] [CrossRef]
- Khan, I.; Zakari, A.; Ahmad, M.; Irfan, M.; Hou, F. Linking energy transitions, energy consumption, and environmental sustainability in OECD countries. Gondwana Res. 2022, 103, 445–457. [Google Scholar] [CrossRef]
- Himeur, Y.; Elnour, M.; Fadli, F.; Meskin, N.; Petri, I.; Rezgui, Y.; Bensaali, F.; Amira, A. AI-big data analytics for building automation and management systems: A survey, actual challenges and future perspectives. Artif. Intell. Rev. 2023, 56, 4929–5021. [Google Scholar] [CrossRef] [PubMed]
- Wilberforce, T.; Olabi, A.; Sayed, E.T.; Elsaid, K.; Maghrabie, H.M.; Abdelkareem, M.A. A review on zero energy buildings–Pros and cons. Energy Built Environ. 2023, 4, 25–38. [Google Scholar] [CrossRef]
- D’Agostino, D.; Parker, D.; Epifani, I.; Crawley, D.; Lawrie, L. How will future climate impact the design and performance of nearly zero energy buildings (NZEBs)? Energy 2022, 240, 122479. [Google Scholar] [CrossRef]
- Degen, F.; Schütte, M. Life cycle assessment of the energy consumption and GHG emissions of state-of-the-art automotive battery cell production. J. Clean. Prod. 2022, 330, 129798. [Google Scholar] [CrossRef]
- Strielkowski, W.; Vlasov, A.; Selivanov, K.; Muraviev, K.; Shakhnov, V. Prospects and challenges of the machine learning and data-driven methods for the predictive analysis of power systems: A review. Energies 2023, 16, 4025. [Google Scholar] [CrossRef]


Disclaimer/Publisher’s Note: The statements, opinions and data contained in all publications are solely those of the individual author(s) and contributor(s) and not of MDPI and/or the editor(s). MDPI and/or the editor(s) disclaim responsibility for any injury to people or property resulting from any ideas, methods, instructions or products referred to in the content. |
© 2026 by the authors. Licensee MDPI, Basel, Switzerland. This article is an open access article distributed under the terms and conditions of the Creative Commons Attribution (CC BY) license.