Abstract
User interfaces (UIs) have become prevalent and dominant to maximize overall user experience. In order to enhance UI design, the effects of their base properties must be mapped out. Therefore, we constructed a structural equation model, considering the direct effects of design properties and the mediating effects of user performance, with the specific goal of maximizing the UI for users. A total of thirty-six participants were surveyed with different random combinations of UIs while using an eye tracker and measuring their final perception. Significant direct, mediating, and moderating effects were found in this study. Design guidelines were made for maximizing user experience in this study.
1. Introduction
In contemporary society, user interfaces (UIs) have become ubiquitous, with individuals spending an average of six hours per day on screens. As the primary link between users and digital products such as websites and applications, the appearance and design style of a UI significantly influence its success. Over recent years, UI design has undergone notable changes. Skeuomorphism facilitated user navigation of digital devices but was gradually phased out as users became more familiar with technology [1]. However, the transition to simpler flat design introduced challenges to intuitiveness and usability. In response, modern design styles such as material design, neumorphism, glassmorphism, and claymorphism have emerged, blending elements of flat and skeuomorphic approaches to achieve an optimal balance that leverages the strengths of both.
These design styles are created through the manipulation of design properties, which determine the appearance of each UI element [2]. By adjusting these properties, an extensive range of design styles can be generated, particularly when combining aspects of flat and skeuomorphic design. Objects, icons, and typography remain the most fundamental elements of any interface, forming the foundation upon which design styles are built. The rapid evolution of design styles presents opportunities to enhance user experience, with the ultimate goal of maximizing visual esthetics, usability, and minimizing cognitive load.
- Despite this progress, no previous study has comprehensively examined these three components together or investigated the broader factors that may influence them. The existing literature has primarily focused on skeuomorphic and flat design, excluding modern hybrid styles that integrate both. Moreover, most studies have adopted narrow scopes, often limited to age-related differences, while neglecting other demographic variables such as gender and education level. Research has also concentrated on icon design rather than evaluating entire interfaces or websites [3,4,5,6,7]. A critical gap remains in the exploration of design properties themselves, leaving current studies unable to analyze incremental changes in modern styles or explain why specific styles produce particular effects, especially in terms of which elements or properties contribute most to those outcomes.
- Addressing this gap, we examined the performance and limitations of design styles that have evolved from skeuomorphism and flat design. We established a framework defining the relationship among design properties, user performance, and user experience moderated by demographic factors. Based on the results, we assessed the direct effects of design properties on user experience to identify the role of design properties in shaping user performance as a determinant of user experience, examined the factors that influence the impact of each property on user experience, and developed design guidelines that enumerate the distinct properties of each style while accounting for the performance and preferences of diverse demographic groups.
2. Literature Review
2.1. Goals of User Interface Design
The goals of UI design vary across products, but one principle remains constant: designers must understand the intended audience [8]. Each interface serves as the link between a digital product and its users, and its objectives differ depending on the brand and user base [2]. Across industries and in the literature, these goals ultimately converge on enhancing user experience.
2.2. Skeuomorphism
UI design initially embraced skeuomorphism, which replicated real-world, three-dimensional objects to aid user navigation. As users became more familiar with digital devices, reliance on such metaphors diminished. Apple popularized skeuomorphism with the launch of the iPhone, but its complex 3D characteristics were eventually criticized for creating cluttered interfaces [9]. In 2013, Apple shifted toward a flat design, which simplified objects and icons into abstract forms, representing the conceptual opposite of skeuomorphism.
2.3. Modern Design Styles and Design Properties
Contemporary design styles have evolved by blending skeuomorphic and flat elements, aiming to combine their advantages while minimizing drawbacks. This integration is achieved through the manipulation of design properties, which form the foundation of all design styles. Without analyzing these properties, evaluations of design styles remain incomplete. Moreover, focusing on design properties enables future-proof analysis, providing a stable foundation for ongoing research. The first step in this process is to determine the direct effects of design properties on user experience.
2.4. User Performance and User Experience
Researchers distinguish between two dependent variables: user performance and user experience. User performance refers to objective measures such as speed, accuracy, eye fixation, and pupil dilation, while user experience encompasses subjective perceptions, including visual attractiveness, cognitive load, and usability. Differentiating these categories is essential, as they complement one another in providing a comprehensive understanding of interface effectiveness and user satisfaction. Furthermore, measuring user performance may help explain how design properties influence overall user experience.
2.5. User Demographics
Incorporating user characteristics into UI design enhances the overall experience [10]. Differences in performance across genders are examined [11,12], emphasizing the importance of considering education level to account for developmental skills [13]. While age initially served as the primary moderator in understanding differences among UI design styles [14,15], subsequent research has revealed the influence of additional demographic factors. This progression underscores the need for inclusivity in UI design, ensuring that styles accommodate diverse user groups [16].
2.6. Overall Synthesis
Despite the evolution of design styles, research remains limited in examining their effects on diverse user groups. A closer investigation of design properties, with user performance metrics such as speed, accuracy, fixation, and pupil dilation serving as mediators for user experience, helps resolve misconceptions regarding the impact of design styles. The absence of such mediation explains discrepancies observed in existing studies. In addition, the moderating effects of demographic variables such as gender and education level warrant further exploration, as they provide valuable insights into the distinct needs of specific user groups.
3. Materials and Methods
A visual search-and-click experiment was conducted to simulate user interaction with a website. Design combinations were generated using the Taguchi L18 orthogonal array, modeled loosely on the general layout of the Amazon.com e-commerce platform. Three scenarios were created to meet the minimum sample size of 100, resulting in 54 user interfaces (3 × 18).
3.1. Participants
A total of participants took part in the pilot experiment. Convenience sampling was employed to recruit students from De La Salle University–Manila, the Philippines, based on availability. Eligibility criteria required participants to be digitally literate, proficient in English, and free from color blindness.
3.2. Apparatus
The experiments were conducted in a dedicated laboratory equipped with adequate lighting, a desk and chair, and a 27-inch desktop computer with a 1920 × 1080 resolution. Experimental testbeds were designed in Figma (Figure 1) and deployed using the OpenSesame experiment builder software version 4. Eye-tracking data were collected using Tobii Pro Glasses 2 with Tobii Pro Lab 24.21. Questionnaire items were constructed in Google Forms and accessed via a separate device provided by the researchers. Structural equation modeling (SEM) was used with IBM Statistical Package for the Social Sciences Amos 31.0.
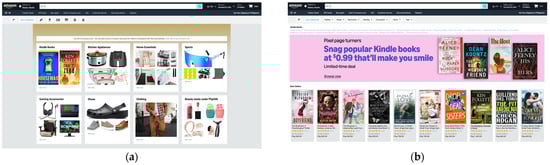
Figure 1.
Screenshot of experimental testbed: (a) Page 1 of Scenario 1; (b) Page 2 of Scenario 2.
3.3. Measurements
Demographic information, including age, gender, and education level, was collected through Google Forms, alongside user experience variables such as visual esthetics, usability, and cognitive load, derived from questionnaire responses. Speed and accuracy were recorded by OpenSesame, while pupil dilation and gaze duration were captured using the eye tracker.
3.4. Procedure
Participants were seated at the desktop computer and fitted with the eye tracker. They provided demographic information and consent via Google Forms before being briefed on the study’s purpose and instructions. The eye tracker was recalibrated, and practice trials were conducted to familiarize participants with the experiment flow and restrictions (e.g., avoiding the use of the search bar). Following practice trials, participants proceeded to the main experiment. Each shopping scenario was presented sequentially, requiring navigation through eight pages, each containing a target to be clicked before advancing. After completing each scenario, participants evaluated the website using a 12-item questionnaire in Google Forms. This process was repeated for all three scenarios. Upon completion, participants provided insights on their performance across scenarios, and self-reported data were reviewed for inconsistencies or missing entries. Those who completed the experiment received a 50 PHP token.
3.5. Analysis Method
Data were analyzed using the SEM framework [17]. The dataset was cleaned and tested for normality, linearity, and multicollinearity, with non-normal data transformed or normalized as necessary. Exploratory and confirmatory factor analyses were conducted to validate the structure and reliability of questionnaire items. Factor scores were then prepared for SEM, forming the basis for hypothesis testing.
4. Results
4.1. SEM
Following data preparation, factor analysis was conducted to assess the validity and reliability of the questionnaire items. The exploratory factor analysis (EFA) produced strong results, with a Kaiser–Meyer–Olkin (KMO) value of 0.848 and Bartlett’s test of sphericity (p < 0.001) indicating a high proportion of variance among the variables (Table 1). Factor loadings exceeded the recommended threshold of 0.70, supporting convergent validity, while Cronbach’s alpha values were above 0.70. The total variance explained was 72.75%, surpassing the 60% benchmark.

Table 1.
Structural equation modeling results.
Confirmatory factor analysis was performed to validate the factor structure extracted from the EFA. Although the initial model satisfied convergent and discriminant validity metrics, it did not meet the criteria for good model fit. To address this, items from each factor were removed, resulting in an excellent model fit and invariance. Similarly, the structural equation model required verification of model fit. The initial model did not meet the thresholds proposed by Hu and Bentler [18] due to unaccounted strong relationships. Six additional relationships were incorporated to achieve sufficient fit, and the same adjustments were applied to moderating variables, all of which ultimately met the fit requirements.
4.2. Hypothesis Testing
Of the 14 hypotheses tested, 11 were supported at α = 0.05. The three rejected hypotheses concerned the effects of icon and typography design properties on user experience and user performance, as well as search efficiency as a mediator between UI design properties and usability. Figure 2 presents the overall results.

Figure 2.
Hypothesis test results.
5. Discussion
5.1. Objective 1: Direct Effects on and Between User Performance and User Experience
The results indicate that moderate object borders reduce cognitive load, high drop shadows enhance usability, and both solid and gradient fills improve usability. Conversely, excessive object borders increase cognitive load and reduce usability. A strong direct relationship was observed between user performance and user experience. Visual attention measures (gaze duration and pupil dilation) were significantly related to cognitive load, while search efficiency (speed and accuracy) was directly associated with usability, consistent with the original hypotheses.
5.2. Objective 2: Mediating Effects of User Performance
Only border radius and icon detail significantly contributed to mediating effects. The limited findings may be attributed to the simplicity of the experimental design, which did not sufficiently challenge participants to elicit strong cognitive responses. Based on these results, pupil dilation is not recommended as a mediator when testing variations of the same website, whereas gaze duration proved effective by capturing points of interest. Contrary to prior studies, speed and accuracy were unreliable mediators, likely because this study focused on gradual cosmetic changes rather than drastic technical modifications.
5.3. Objective 3: Effects of Design Properties on General and Specific Users
For general users, object borders emerged as the most influential property, with moderate levels consistently producing positive effects across user experience components, while extreme levels were detrimental or negligible. Age differences revealed that younger users were more perceptive and sensitive to UI changes, whereas older users followed the general pattern, benefiting most from moderate levels. Gender differences showed significant effects among females, who displayed unique preferences such as a dislike for object roundness, while male responses aligned more closely with the general model but were less pronounced. Education level also influenced sensitivity: lower-year students responded strongly to gradient fills, resembling general users, while higher-year students exhibited patterns similar to older users but were more responsive to subtle properties such as inner shadows.
6. Conclusions
The results of this study demonstrate how specific design properties influence user experience and performance, particularly when moderated by age, gender, and education. Incorporating skeuomorphic elements into full UI designs enhances both usability and performance. By focusing on individual design properties, UI styles producing specific effects and inconsistencies were identified from the existing literature. The results provide a foundation for developing new design styles and offer a rigorous framework for analyzing existing ones. UI/UX designers can leverage these findings to improve website design by manipulating properties of UI elements with which users have reported negative experiences. For users, the appropriate combination of design properties facilitates a smoother interaction with UI elements, potentially improving conversion rates and retention.
Future research is necessary to expand sample sizes and demographic diversity, explore design properties as continuous variables, and investigate their interaction effects. Additionally, the scope of UI design properties must be examined, and additional measures of user performance and experience must be incorporated to strengthen the generalizability of the findings.
Author Contributions
Conceptualization, P.J.B., K.R.R., C.A.T., R.I.V. and E.B.; methodology, P.J.B., K.R.R., C.A.T., R.I.V. and E.B.; software, P.J.B., K.R.R., C.A.T. and R.I.V.; validation, P.J.B., K.R.R., C.A.T., R.I.V. and E.B.; formal analysis, P.J.B., K.R.R., C.A.T. and R.I.V.; investigation, P.J.B., K.R.R., C.A.T. and R.I.V.; resources, P.J.B., K.R.R., C.A.T. and R.I.V.; data curation, P.J.B., K.R.R., C.A.T. and R.I.V.; writing—original draft preparation, P.J.B., K.R.R., C.A.T. and R.I.V.; writing—review and editing, P.J.B., K.R.R., C.A.T. and R.I.V.; visualization, P.J.B., K.R.R., C.A.T. and R.I.V.; supervision, E.B. and C.S.-B.; project administration, E.B. All authors have read and agreed to the published version of the manuscript.
Funding
This research received no external funding.
Institutional Review Board Statement
Not applicable.
Informed Consent Statement
Not applicable.
Data Availability Statement
The raw data supporting the conclusions of this article will be made available by the authors on request.
Acknowledgments
Our sincere gratitude goes to our thesis committee, colleagues, and friends for their constructive feedback and support. We appreciate the assistance from the Industrial Engineering laboratory staff, Reginal Salinas, for lending us the laboratory room and eye tracker.
Conflicts of Interest
The authors declare no conflicts of interest.
References
- Kim, S.; Lee, S. Smash the dichotomy of Skeuomorphism and flat design: Designing an affordable interface to correspond with the human perceptuomotor process. Int. J. Hum. Comput. Stud. 2020, 141, 102435. [Google Scholar] [CrossRef]
- Malewicz, M.; Malewicz, D. Designing User Interfaces, 1st ed.; Hype4Academy: Warsaw, Poland, 2022; pp. 1–300. [Google Scholar]
- Backhaus, N.; Trapp, A.K.; Thüring, M. Skeuomorph versus flat design: User experience and age-related preferences. In User Experience, and Usability: Designing Interactions (DUXU 2018), 2nd ed.; Lecture Notes in Computer Science; Springer: Cham, Switzerland, 2018; Volume 10919, pp. 527–542. [Google Scholar]
- Chen, R.; Huang, J.; Zhou, J. Skeuomorphic or flat icons for an efficient visual search by younger and older adults? Appl. Ergon. 2020, 85, 103073. [Google Scholar] [CrossRef] [PubMed]
- Mu, D.; Huang, Y.; Wang, Y.; Yang, J.; Li, J.; Kang, Z. Neumorphic or flat? Impact of icon depth on user attention and visual search efficiency. Int. J. Ind. Ergon. 2022, 89, 103281. [Google Scholar] [CrossRef]
- Krallis, D.; Balaskas, S.; Rigou, M. Flat vs. skeuomorphic design for smart home devices: An exploratory eye-tracking study. In Proceedings of the 17th International Conference on Intelligent Environments (IE), Dubai, United Arab Emirates, 14–17 June 2022; pp. 44–51. [Google Scholar]
- Liu, H.; Wang, W.; Liu, Y.; Song, F.H.; Wang, S.; Guo, H. Study on the differences of icon cognition of graphical interface for age-friendly design. J. Gerontol. Soc. Work 2023, 66, 662–679. [Google Scholar] [CrossRef] [PubMed]
- Norman, D.A. Affordances and Design. Available online: https://www.researchgate.net/publication/265618710 (accessed on 9 March 2025).
- Bjork, S. Flat and neumorphic design: Aesthetic preferences compared between age groups. In Proceedings of the 21st Student Conference in Interaction Technology and Design, Umeå, Sweden, 30 June 2021; p. 145. [Google Scholar]
- Alves, T.; Natálio, J.; Henriques-Calado, J.; Gama, S. Incorporating personality in user interface design: A review. Pers. Individ. Dif. 2020, 155, 109709. [Google Scholar] [CrossRef]
- Arambepola, N.; Munasinghe, L. Empirical analysis of user factors that affect the user interface design in mobile applications. In Proceedings of the 20th International Conference on Advances in ICT for Emerging Regions (ICTer), Colombo, Sri Lanka, 25–26 November 2020; pp. 166–171. [Google Scholar]
- Lin, C.J.; Hsieh, T.L. Exploring the design criteria of website interfaces for gender. Int. J. Ind. Ergon. 2016, 53, 306–311. [Google Scholar] [CrossRef]
- Frye, D.; Soloway, E. Interface design: A neglected issue in educational software. In Proceedings of the SIGCHI/GI Conference on Human Factors in Computing Systems and Graphics Interface (CHI ’87), Toronto, ON, Canada, 5–9 April 1987. [Google Scholar] [CrossRef]
- Urbano, I.C.V.P.; Guerreiro, J.P.V.; Nicolau, H.M.A.A. From skeuomorphism to flat design: Age-related differences in performance and aesthetic perceptions. Behav. Inf. Technol. 2022, 41, 452–467. [Google Scholar] [CrossRef]
- Ellis, A.; Marshall, M.T. Can skeuomorphic design provide a better online banking user experience for older adults? Multimodal Technol. Interact. 2019, 3, 63. [Google Scholar] [CrossRef]
- Oswald, D. Affordances and metaphors revisited: Testing flat vs. skeuomorph design with digital natives and digital immigrants. In Proceedings of the 32nd International BCS Human Computer Interaction Conference (HCI 2018), Belfast, UK, 2–6 July 2018. [Google Scholar]
- Gaskin, J. Data Prep. Gaskination’s StatWiki. Available online: http://statwiki.gaskination.com (accessed on 9 March 2025).
- Hu, L.T.; Bentler, P.M. Cutoff criteria for fit indexes in covariance structure analysis: Conventional criteria versus new alternatives. Struct. Equ. Model. 1999, 6, 1–55. [Google Scholar] [CrossRef]


Disclaimer/Publisher’s Note: The statements, opinions and data contained in all publications are solely those of the individual author(s) and contributor(s) and not of MDPI and/or the editor(s). MDPI and/or the editor(s) disclaim responsibility for any injury to people or property resulting from any ideas, methods, instructions or products referred to in the content. |
© 2026 by the authors. Licensee MDPI, Basel, Switzerland. This article is an open access article distributed under the terms and conditions of the Creative Commons Attribution (CC BY) license.