Abstract
Geospatial data analysis systems are currently very relevant. Most such systems use either relational databases or graph databases. This paper presents the idea of using both approaches, taking into account the main features and advantages of each. A concrete example of a city transport network is used to experimentally examine the use of this hybrid approach. A special ETL procedure was developed to transform data from the corresponding graph database to a relational one, as well as the reverse process from the relational to the graph database. The results show which type of queries are better suited for relational databases, and which for graph databases. Additionally, for certain specific queries and applications, neither database type is capable of providing any results. Although this kind of hybrid architecture has issues with data duplication, the performance gains achieved are significant, making this approach highly efficient.
1. Introduction
In recent years, there has been a significant increase in the volume and complexity of geolocation data collected from various sources including mobile devices, IoT sensors, and smart city systems. This data is increasingly used for analytical purposes, such as optimizing traffic flows, infrastructure management, user behaviour analysis, and urban planning. Such analysis requires an efficient approach to modelling and querying spatial and relational data, which poses considerable challenges in terms of scalability, performance, and the adequacy of existing database systems [1,2].
Traditionally, relational database management systems (RDBMS) have been used for storing structured data with well-defined schemas and support for complex SQL queries. Their strengths lie in technological maturity, data consistency, and a rich ecosystem of tools. However, when it comes to modelling relationships between entities, such as connections within a transportation network, the relational model often proves to be a rigid solution that requires complex and inefficient queries.
In contrast, graph databases are designed to model relationships between entities directly, with nodes and edges forming the core data structure. This approach enables more natural and faster execution of queries involving multiple hops across the network, which is particularly beneficial for geoanalysis tasks that involve linking locations, routes, and dependencies. Nevertheless, graph databases are often not optimal for traditional aggregation operations and tabular views common in analytical systems [3,4,5].
This paper explores the potential of combining the advantages of both approaches by developing a hybrid architecture for data storage and analysis [6]. A real-world example of a city’s transportation network is used as a case study. The core idea is to design ETL processes that allow bidirectional data transformation between a graph database and a relational database. This enables the use of the most suitable data model depending on the type of query and the expected performance [7,8].
The aim of this research is to experimentally evaluate which types of queries and operations perform better in each database model and to identify the limitations of both approaches in the context of geoanalysis. Special attention is given to identifying cases where neither model provides satisfactory results, as well as evaluating the cost of data redundancy introduced by the hybrid approach.
The article is divided into five main chapters. Chapter two describes current use of relational and graph databases in geoanalysis. Chapter three describes our selected DB systems and dataset. Chapter four shows our experimental results. Chapter five covers our hybrid approach. Chapter six concludes the article.
2. Overview of Graph and Relational Databases
Understanding the strengths and limitations of different database paradigms is crucial when dealing with complex geospatial data. As the demand for efficient geoanalytics increases, choosing the right data model becomes a key architectural decision.
This section provides an overview of how both relational and graph databases are applied in geoanalysis. By comparing these two approaches, we aim to identify scenarios where one model outperforms the other and highlight the potential benefits of a hybrid solution that leverages both technologies.
2.1. Relational Databases in Geoanalysis
Relational databases (RDBMS) have long served as the foundation for storing and managing structured data, including spatial information. Modern RDBMS platforms such as PostgreSQL with the PostGIS extension, Microsoft SQL Server with Geometry and Geography types, and Oracle Spatial offer robust capabilities for storing, indexing, and analysing geospatial data.
Spatial types in relational databases include points, lines, polygons, and multi-geometry objects (e.g., MULTIPOLYGON, LINESTRING). In addition to data types, spatial indexing (most often implemented via R-trees [9]) enables efficient spatial queries. Examples of these queries are as follows: retrieving objects within a bounding box (ST_Within, ST_Contains), measuring spatial distances (ST_Distance), and detecting geometry intersections (ST_Intersects) [10].
Advantages of relational databases in geoanalysis are as follows: technological maturity and standardization (e.g., Open GIS Consortium Simple Features), powerful query language (SQL) with spatial extensions, integration with traditional analytical and business intelligence tools, and transactional consistency with full ACID compliance.
However, when it comes to multi-step relationships (e.g., multiple hops across locations), the relational model often requires complex JOIN operations, which negatively affect performance.
2.2. Graph Databases in Geoanalysis
Graph databases (e.g., Neo4j, ArangoDB, TigerGraph) model data as nodes (entities) and edges (relationships), while relational databases rely on tables and predefined relations. In geoanalysis, nodes can represent locations, and edges can represent connections such as roads or flows.
Advantages of graph databases in geoanalysis are explicit modelling of relationships and optimized traversal algorithms (e.g., shortest path, k-hop, clustering, centrality measures), high performance for network- and relationship-based queries, flexible data modelling without requiring a predefined schema, and natural representation of connected infrastructures such as transportation or utility networks.
Graph databases are less suitable for classical aggregations, reporting, or geometric calculations, unless extended with spatial features.
A comparison of some basic features between RDBMS and graph databases used for geoanalysis is given in Table 1.

Table 1.
Comparison of RDBMS and graph data models.
2.3. Why Combine Relational and Graph Models?
Since neither model is universally optimal, an increasing number of systems adopt hybrid architectures that combine relational and graph databases7. This allows leveraging the strengths of both models:
Hybrid systems require carefully designed ETL (Extract–Transform–Load [8]) processes that allow bidirectional synchronization between the two models. This ensures that a single dataset can be utilized in different ways depending on the nature of the query or analytical task.
While this approach introduces some overhead in terms of data redundancy and maintenance, experimental results (including those presented in this paper) show significant performance improvements and broader applicability of the system.
3. Model Description and Dataset
The choice of technologies used in this research was guided by their complementarity in handling different aspects of geospatial data analysis. The goal was to explore how a hybrid architecture, based on two specialized systems, could leverage the strengths of each approach (relational and graph-based) to support complex geoanalytical tasks more effectively.
PostgreSQL 17.5 with the PostGIS Bundle 3 extension was selected due to its mature support for spatial data types, indexing, and compliance with Open Geospatial Consortium (OGC) standards. It provides a robust foundation for storing and querying precise geometries, performing spatial joins, and executing aggregation and filtering operations commonly found in GIS workflows [11,12].
Neo4j 2.0.2 was chosen as the graph database component because of its optimized performance in analysing relationships and network structures. It offers a natural way to model and query entities such as transportation nodes and their interconnections, enabling efficient execution of path finding, neighbourhood discovery, and topological analysis. Neo4j’s query language, Cypher [13,14], is particularly suited for expressing complex traversals across highly connected datasets.
By combining these two systems, we aimed to demonstrate how spatial data can be analysed from both geometric and topological perspectives: using the relational model for metric and spatial precision, and the graph model for connectivity reasoning.
3.1. Use of PostgreSQL/PostGIS for Spatial Data Storage and Processing
PostgreSQL, an open-source object-relational database, was extended with Post-GIS to support advanced geospatial operations. The spatial data model included standard geometry types, such as POINT, LINESTRING, and POLYGON, along with composite geometries like MULTILINESTRING and MULTIPOLYGON. These were used to represent elements such as roads, intersections, zones, and stations.
Spatial indexing was achieved using GiST (Generalized Search Tree) indexes, enabling efficient execution of spatial queries.
Data stored in PostGIS served as the foundation for spatial visualizations, spatial filtering, and attribute-based reporting. It also acted as a reliable source for exporting structured spatial datasets to other components in the system, including the graph DB.
Suppose we have a table of stations consisting of their ID, name, and geom, which represents the geographical point of the station. An example of a query that computes the distance between stations with IDs 1 and 2 using PostGIS could be as shown in Algorithm 1.
| Algorithm 1: Computing distance between two nodes using PostGIS |
| SELECT s1.name AS station_a, s2.name AS station_b, ST_Distance(s1.geom, s2.geom) AS distance_meters FROM stations s1 JOIN stations s2 ON s1.id = 1 AND s2.id = 2; |
3.2. Use of Neo4j for Connectivity Analysis
In Neo4j, spatial entities such as transport nodes (stations, intersections) were modelled as nodes, while the links between them (e.g., road segments, transit lines) were modelled as edges. Each node was enriched with attributes such as name, coordinates, and type, while edges contained metadata, such as distance, travel time, or directionality.
The graph schema allowed intuitive modelling of bidirectional and unidirectional connections, multi-modal transport routes, and hierarchical relationships (e.g., station groups or route clusters).
Using Cypher queries, the system efficiently handled the following: shortest path calculations between nodes (e.g., using shortestPath()), K-hop neighbourhood detection to identify zones of influence or coverage, and graph algorithms (e.g., PageRank or centrality measures) to evaluate node importance and network robustness.
Neo4j’s visualization capabilities and interactive query environment also proved useful during exploration and debugging of the graph structure.
If we consider similar examples with stations like above, Cypher query for computing distance between two stations would look like Algorithm 2.
| Algorithm 2: Computing distance between two nodes using Cypher |
| MATCH (a:Station {id: 1}), (b:Station {id: 2}) RETURN a.name AS station_a, b.name AS station_b, distance(a.location, b.location) AS distance_meters; |
However, the true power of graph databases can be better shown through examples like finding the fastest path between stations or finding all stations within a 3-hop neighbourhood.
3.3. Our Dataset
We used publicly available OSM (Open Street Map) data of junctions and roads in Croatia, which is regularly updated [15]. This database has 170,442 nodes and 392,024 relations.
Using a Python 3.10 script, we transformed this data into our PostgreSQL database. The simple algorithm representing this ETL is shown in Figure 1.

Figure 1.
Algorithm of ETL process to convert our dataset from graph to relational DB.
To migrate tables from a relational database to a graph database, data must be fetched with SQL SELECT queries and inserted into Neo4j using Cypher. Data consistency between Neo4j and PostgreSQL is maintained by a synchronization layer that ensures that updates in one database are automatically propagated to the other in real time.
4. Experimental Results
In the experimental section, we will employ a set of representative queries to compare the performance and capabilities of both database models (graph and relational) and present the obtained results.
4.1. Queries Executed on Both Databases
Table 2 presents the execution times of queries that can be executed on both databases (graph and relational), along with the corresponding query formulations. Each measurement was performed ten times, and the reported values represent the average execution time in milliseconds.
Table 2.
Comparison of results for RDBMS and graph queries (problems A, B, C and D) and their execution times.
The results presented in Table 2 reveal notable differences in the performance of relational (PostgreSQL + PostGIS) and graph-based (Neo4j) database approaches when applied to spatial road network problems. For relatively simple aggregate computations, such as the total length of all roads (Problem A), both systems perform comparably, with Neo4j slightly outperforming PostGIS (259 ms vs. 334 ms). This suggests that for straightforward summations, graph traversal overhead does not impose a significant penalty.
In Problem B (finding all dead-end roads in Croatia), both systems returned 48,783 results, but PostGIS took over 2 h, while Neo4j finished in 2.7 s, highlighting the efficiency of graph databases for topological queries.
For proximity-based queries (Problems C and D), the performance varied. In Problem C, PostGIS (289 ms) slightly outperformed Neo4j (471 ms), likely due to PostGIS’s optimized spatial indexing for nearest-neighbour searches. Conversely, in Problem D, which required retrieving all roads within a 5 km radius, Neo4j was markedly faster (345 ms vs. 1180 ms). This indicates that graph traversal combined with spatial filtering may be more efficient than traditional relational joins in certain range queries.
Overall, these results highlight that while relational spatial databases like PostGIS remain strong for geometric and purely spatial operations, graph databases such as Neo4j exhibit clear advantages in topological and connectivity-related tasks. Therefore, the choice of database paradigm should be guided by the dominant query type: PostGIS for spatially intensive calculations, and Neo4j for topological or network-oriented analyses.
4.2. Queries Supported by Only One Database
Table 3 presents queries that can only be executed on one of the databases (relational or graph) due to the specific capabilities of their query languages.
Table 3.
Queries (for problems E and F) executed on one specific database.
We will now provide graphical representation of the above two problems (E and F) in Figure 2.
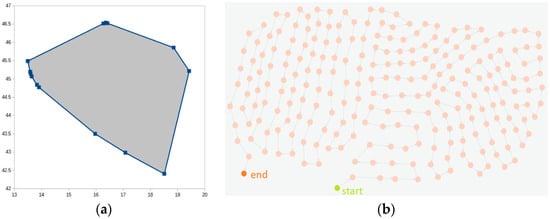
Figure 2.
(a) Visual representation of results for problem (E) (b) Visual representation of results for problem (F).
5. Hybrid Approach
Our hybrid approach is based on API to determine which of the database systems will be used for certain queries. Text analysis of the given query is performed by comparing it against keywords common in the query language. Once a decision is made, the appropriate DB system is selected. Figure 3 illustrates our model.
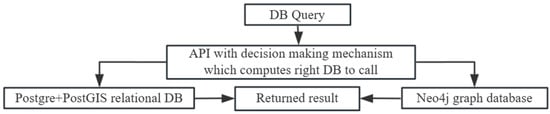
Figure 3.
Diagram of our hybrid decision model.
If the correct DB is always selected, the query will be executed in the optimal (minimum) time. Certain problems can only be executed on one DB system, i.e., problems (E) and (F) from Table 3 above. Router logic is given with Algorithm 3.
| Algorithm 3: Router logic algorithm in python |
| def decide_query_type(query: str) -> str: spatial_keywords = [“ST_DWithin”, “ST_Within”, “ST_Buffer”, “ST_Intersection”, “ST_Distance”] graph_keywords = [“shortestPath”, “centrality”, “neighbors”, “path”] if any(word.lower() in query.lower() for word in spatial_keywords): return “postgres” elif any(word.lower() in query.lower() for word in graph_keywords): return “neo4j” else: return “postgres”s; |
6. Conclusions
In this paper, we explored the integration of relational and graph database technologies for the purpose of geospatial analysis within urban transport networks. Through a case study using a hybrid architecture, we demonstrated that each database model has distinct strengths depending on the nature of the query.
Relational databases, such as PostgreSQL with PostGIS, are highly effective for spatial operations involving geometric calculations, filtering based on attribute values, and when working with well-structured tabular data. In contrast, graph databases like Neo4j are significantly more efficient when analysing network connectivity, pathfinding, and neighbourhood traversal queries, particularly in complex and highly connected systems.
The main conclusion is that there is no universal solution. Relational databases are preferable for tasks requiring precise spatial queries and standardized spatial data models. Graph databases are better suited for analysing relationships and dynamics within large-scale networks.
A key challenge in hybrid architectures is maintaining data consistency and avoiding unnecessary duplication. However, with well-designed ETL processes and clear query separation logic, hybrid solutions can yield significant performance and analytical benefits.
In future work, we plan to explore the automation of data synchronization between graph and relational databases, as well as deeper integration with real-time data sources (e.g., sensors, GPS). Another promising direction involves the use of graph analytics algorithms (e.g., centrality, community detection) to improve the understanding and optimization of transport networks. Additionally, developing generic middleware for hybrid querying across systems could significantly streamline geoanalytical workflows.
Author Contributions
Conceptualization, A.B. and T.G.; methodology, A.B.; software, A.B.; validation, A.B., T.G. and Č.L.; formal analysis, A.B.; investigation, G.M.; resources, A.B.; data curation, A.B.; writing—original draft preparation, A.B.; writing—review and editing, A.B.; visualization, Č.L.; supervision, T.G.; project administration, A.B.; funding acquisition, A.B. All authors have read and agreed to the published version of the manuscript.
Funding
This research was funded by the European union-NextGenerationEU trough tje project Efficient multimodal environment for data analysis and anomaly detection using machine learning methods in time-critical applications (ANO-ML), funding number: 581-UNIOS-34.
Institutional Review Board Statement
Not applicable.
Informed Consent Statement
Not applicable.
Data Availability Statement
The data presented in this study are available upon request from the corresponding author.
Conflicts of Interest
The authors declare no conflict of interest.
References
- Shekhar, S.; Evans, M.R.; Kang, J.M.; Mohan, P. Identifying patterns in spatial information: A survey of methods. Wiley Interdiscip. Rev. Data Min. Knowl. Discov. 2011, 1, 193–214. [Google Scholar] [CrossRef]
- Yuan, J.; Zheng, Y.; Xie, X. Discovering regions of different functions in a city using human mobility and POIs. In Proceedings of the 18th ACM SIGKDD International Conference on Knowledge Discovery and Data Mining; Association for Computing Machinery: New York, NY, USA, 2012; pp. 186–194. [Google Scholar]
- Angles, R.; Gutierrez, C. Survey of graph database models. ACM Comput. Surv. 2008, 40, 1–39. [Google Scholar] [CrossRef]
- Stonebraker, M.; Çetintemel, U. “One size fits all”: An idea whose time has come and gone. In Proceedings of the 21st International Conference on Data Engineering; Association for Computing Machinery: New York, NY, USA, 2025; pp. 2–11. [Google Scholar]
- Robinson, I.; Webber, J.; Eifrem, E. Graph Databases: New Opportunities for Connected Data, 2nd ed.; O’Reilly Media: Sebastopol, CA, USA, 2015. [Google Scholar]
- Sadalage, P.J.; Fowler, M. NoSQL Distilled: A Brief Guide to the Emerging World of Polyglot Persistence; Addison-Wesley: Boston, MA, USA, 2012. [Google Scholar]
- Vyawahare, H.R.; Karde, P.P.; Thakare, V.M. A Hybrid Database Approach Using Graph and Relational Database. In Proceedings of the 2018 International Conference on Research in Intelligent and Computing in Engineering (RICE), San Salvador, El Salvador, 22–24 August 2018; pp. 1–4. [Google Scholar]
- Vassiliadis, P.; Simitsis, A.; Skiadopoulos, S. Conceptual modeling for ETL processes. In Proceedings of the 5th ACM International Workshop on Data Warehousing and OLAP; Association for Computing Machinery: New York, NY, USA, 2002; pp. 14–21. [Google Scholar]
- Rigaux, P.; Scholl, M.; Voisard, A. Spatial Databases: With Application to GIS; Morgan Kaufmann: Burlington, MA, USA, 2002. [Google Scholar]
- Obe, R.O.; Hsu, L.S. PostGIS in Action, 3rd ed.; Manning Publications: Shelter Island, NY, USA, 2020. [Google Scholar]
- Open Geospatial Consortium (OGC): OpenGIS® Simple Feature Access—Part 1: Common Architecture, Version 1.2.1; OGC Document 06-103r4, 2005. Available online: https://portal.ogc.org/files/?artifact_id=25355 (accessed on 21 August 2025).
- Bédard, Y.; Rivest, S.; Proulx, M.J. Spatial OLAP and GIS: A review of integration models and future directions. In Proceedings of the 9th International Conference on Geoinformatics, Lyon, France, 13–15 April 2007. [Google Scholar]
- van Bruggen, W. Learning Cypher; Packt Publishing: Birmingham, UK, 2014. [Google Scholar]
- Francis, N.; Green, A.; Guagliardo, P.; Libkin, L.; Lindaaker, T.; Marsault, V.; Plantikow, S.; Rydberg, M.; Selmer, P.; Taylor, A.; et al. Cypher: An Evolving Query Language for Property Graphs. In Proceedings of the 2018 International Conference on Management of Data (SIGMOD); Association for Computing Machinery: New York, NY, USA, 2018; pp. 1433–1445. [Google Scholar]
- OpenStreetMap Contributors. Planet Dump [Data File from 2025-08-08]. 2015. Available online: https://planet.openstreetmap.org (accessed on 8 August 2025).


Disclaimer/Publisher’s Note: The statements, opinions and data contained in all publications are solely those of the individual author(s) and contributor(s) and not of MDPI and/or the editor(s). MDPI and/or the editor(s) disclaim responsibility for any injury to people or property resulting from any ideas, methods, instructions or products referred to in the content. |
© 2026 by the authors. Licensee MDPI, Basel, Switzerland. This article is an open access article distributed under the terms and conditions of the Creative Commons Attribution (CC BY) license.