Abstract
Mount Etna, considered to be one of the world’s most active volcanoes, is located in Europe. In this study, we physically characterize and model the geohazard area recently caused by the active Etna volcano. An advanced image processing method is presented, in which the scene is acquired simultaneously by two high-resolution remote sensors, the NOAA and SUOMI NFP. The proposed experimental protocol for data visualization and analysis is as follows. First, the images are processed with the same spectral reflectance using VIIRS I-bands at 375 m spatial resolution. In more detail, the spectral signatures of pixels confirm the environmental changes according to color visualization coding. In this context, the widespread volcano clouds over Mount Etna are estimated approximately through a signal-processing measurement algorithm. Second, the images are acquired by two high-resolution sensors, which are the NOAA and SUOMI NFP, in the visible spectrum wavelength. The synchronization of both sensors provides more details about the area occupied by the volcano’s fires. A spectral wavelength analysis is presented in both cases: (1) non-synchronized (i.e., each sensor separately) and (2) synchronized (i.e., combination of two sensors). Third, the protocol of active fire detection applied to the geohazard of the Etna volcano is displayed: fire area detection and estimation, spectral measurement, synchronization of remote sensors, and assessment of the fire spread. Finally, the strengths and limitations of satellite-based active fire detection are presented with respect to the synchronization of different sensors. A theoretical and experimental study will be presented.
1. Introduction
Volcanoes are known as complex dynamic systems. Monitoring and supervising their activity pose several challenges, particularly for frequently and randomly erupting volcanoes in densely populated areas [1,2,3,4]. Advanced technologies dedicated to the observation of natural hazards are required, as volcanoes require the techniques of data fusion. Specifically, the combination of heterogeneous information derived from multiple sensors operating at different spectral, spatial, and temporal resolutions generate a more complete and reliable characterization of volcanic processes.
In this work, we propose an advanced data-driven approach applied to an active fire viewed on the Etna volcano’s eruption. This hot topic is founded on several points of view in society [4,5,6]. The multiple remote sensors could provide information about distant volcanoes or hazards worldwide [5,6]. In this context, we propose studying the synchronization of two sensors operating on equivalent spectral bands to visualize and analyze the data captured over Etna.
2. Study Area
Mount Etna is located on the east coast of Sicily. It is one of the most active volcanoes in the world. The volcano is considered to be a source of active fire in summit craters. The volcano’s activity consists of degassing, explosive phenomena, and lava flows movement. Moreover, the recurrent effusive eruptions caused by winds could extend the lava flows moving widespread over several kilometers, which significantly impacts the landscape. Figure 1 shows the studied area, depicting the Etna volcano geo-located in the Sicilian Island, Italy, during its last eruption on 2 June 2025.
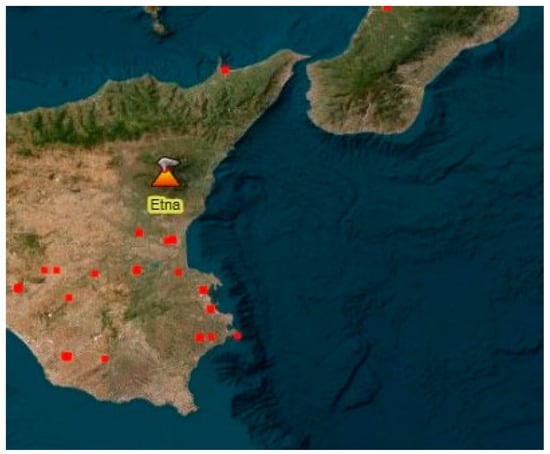
Figure 1.
Study area. Mount Etna located in Sicily, Italy (spatial resolution is 50 km). The red hotspots correspond to active fires detection data acquired by polar orbiting satellites using S-NPP and NOAA-20.
3. Satellite Sensors: S-NPP and NOAA-20
The Visible Infrared Imaging Radiometer Suite (VIIRS) is an instrument onboard the Suomi National Polar-Orbiting Partnership (S-NPP) [5]. Known as an experimental satellite. It was launched by the Joint Polar Satellite System (JPSS) and coordinated by both NASA and NOAA-20 or N20 platforms. The VIIRS (S-NPP and NOAA-20) platforms are placed in a polar orbit at a nominal altitude of 824 km. Both sensors have an FOV of 112.56°, with a swath width of 3060 km. The sensors provide full coverage of the globe at both daytime and nighttime [7]. The data are collected across 22 spectral bands, from 0.412 μm to 12.01 μm of wavelengths [8,9,10,11].
The characteristics of the NASA Earth observations satellites SNPP and NOAA-20 sensors, used in this study, are summarized in Table 1. Particularly, we are focused on the imaging (I4 and I5; 375 m) spatial resolution to assess and visualize the volcanic activity [11].

Table 1.
The specifications of sensors experimented in the study: SNPP and NOAA-20.
4. Experiments and Results
We investigated the Etna volcano, which is characterized by its volcanic heat sources and its frequent eruptive events. The data are acquired at the last eruption on 2 June 2025.
The synchronization of both sensors using comparable mid-infrared and thermal infrared bands provides a more accurate visualization of the studied area. In our case, the images of Mount Etna were analyzed using VIIRS I-bands at 375 m spatial resolution. The lava flows are depicted in Figure 1 with red and yellow colors, corresponding to images captured by the NOAA-20 and S-NPP satellites.
A macro-visualization of the eruption phenomena is obtained by selecting the near-real-time specifications focused on the same location and synchronizing both sensors’ wavelengths to collect more spectral information about the intensity of the lava. The corresponding color-based data analysis is displayed in Figure 2.
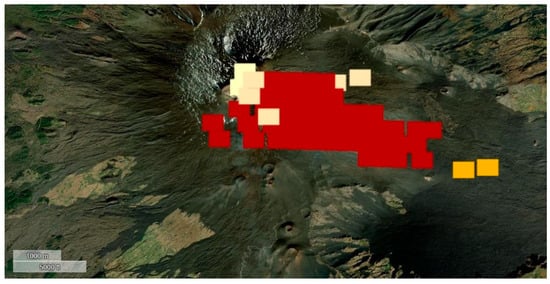
Figure 2.
The visualization of the lava flows of Etna volcano. The spatial resolution is 1 km. The red and yellow colored areas correspond to the time-based hotspots detected from NOAA-20 and SNPP satellites, respectively (ie. red = NOAA-20 and yellow = S-NPP).
To estimate the severity of the volcano’s activity, both sensors are employed at a larger spatial resolution, which corresponds to the adjustments of the optical view camera. For a better understanding, we present an experiment in Figure 3, in which the spatial resolution is equal to 10 km. It is clearly seen that the severity of the eruption is regionally labeled from yellow (low) to orange (high). Such results allow for better human monitoring of the hazard.
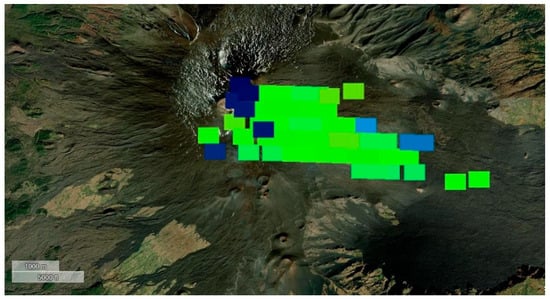
Figure 3.
The macro-visualization of the lava flows of Etna volcano (green = NOAA-20, blue = S-NPP). The spatial resolution is 1 km.
The enlarged area is based on the mixed-pixel phenomena, which highlights the severity of the volcano (from low to high) according to pixel reflectance. This macro-visualization strategy is presented in Figure 4 as a zoomed image of Figure 5. It is clearly noticed that the overlapping of the pixel reflectance procedure records the severity of the hazards around the focused area.
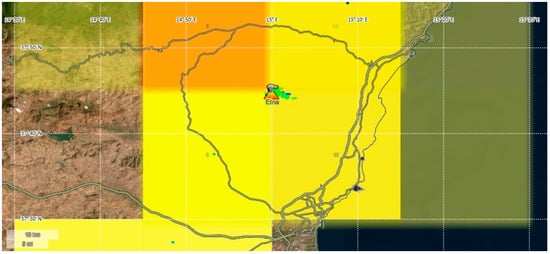
Figure 4.
The macro-visualization of Etna volcano (the spatial resolution is 10 km). All green-blue color nuances (seen in Figure 3) are clearly displayed. The severity of the eruption of the volcano is labeled by yellow (low) and orange colors (high).
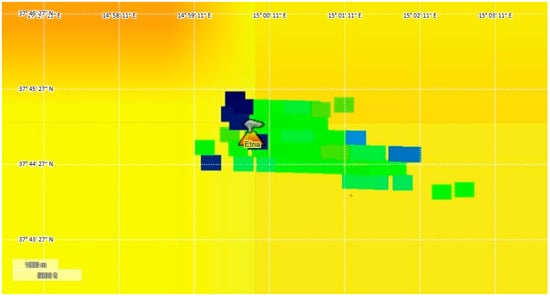
Figure 5.
The enlarged visualization of Figure 4 (green = NOAA-20, blue = S-NPP) highlighting the severity of the eruption of the volcano in depth (low to high correspond to yellow and orange colors, respectively). The spatial resolution is 1 km.
5. Conclusions and Future Insights
In this study, we presented an experimental study to estimate the severity of the Etna volcano’s eruption through the synchronization of the NOAA-20 and S-NPP sensors with the same wavelength. The lava flows are remotely visualized over an active volcano. The visualization was performed at two spatial resolutions (1 km and 10 km), which allows for complementary perspectives on the volcanic activity. The mixed pixels in the images highlighted the severity and the intensity of the heat and the lava flow in the landscape in depth, according to their pixel reflectance.
In future research, we will investigate the estimation of the air quality impacted by the latent heat flux transfer in a thermally active volcanic area of Mount Etna. To extend our proposed technique, we plan to apply the techniques recently cited in [12,13,14,15]. Experimentally, we propose to capture direct measurements of vapor flow to quickly identify thermal anomalies [16]. In the context of signal processing, we will model the images captured from both sensors and study the overlaying of their squared pixels on the same location (i.e., overlap), with partial overlap and with no overlap.
Funding
The Author declares no external funding.
Institutional Review Board Statement
Not applicable.
Informed Consent Statement
Not applicable.
Data Availability Statement
The data presented in this study are available on request from the corresponding author.
Acknowledgments
The Author thanks B. Blevins and J. Hewson and B. Quayle for the technical support and the accessibility of the Lance platform developed by the NASA administration.
Conflicts of Interest
The author declares no conflicts of interest.
References
- Malaguti, A.B.; Corradino, C.; La Spina, A.; Branca, S.; Del Negro, C. Machine Learning Insights into the Last 400 Years of Etna Lateral Eruptions from Historical Volcanological Data. Geosciences 2024, 14, 295. [Google Scholar] [CrossRef]
- Amato, E.; Corradino, C.; Torrisi, F.; Del Negro, C. A Deep Convolutional Neural Network for Detecting Volcanic Thermal Anomalies from Satellite Images. Remote Sens. 2023, 15, 3718. [Google Scholar] [CrossRef]
- Pailot-Bonnétat, S.; Rafflin, V.; Harris, A.; Diliberto, L.S.; Ganci, G.; Bilotta, G.; Cappello, A.; Boudoire, G.; Grassa, F.; Gattuso, A.; et al. Anatomy of thermal unrest at a hydrothermal system: Case study of the 2021–2022 crisis at Vulcano. Earth Planets Space 2023, 75, 159. [Google Scholar] [CrossRef]
- Di Martino, R.M.R.; Capasso, G.; Camarda, M. Spatial domain analysis of carbon dioxide from soils on Vulcano Island: Implications for CO2 output evaluation. Chem. Geol. 2016, 444, 59–70. [Google Scholar] [CrossRef]
- Ganci, G.; Bilotta, G.; Zuccarello, F.; Calvari, S.; Cappello, A.A. Multi-Sensor Satellite Approach to Characterize the Volcanic Deposits Emitted during Etna’s Lava Fountaining: The 2020–2022 Study Case. Remote Sens. 2023, 15, 916. [Google Scholar] [CrossRef]
- Corradino, C.; Ganci, G.; Cappello, A.; Bilotta, G.; Calvari, S.; Del Negro, C. Recognizing Eruptions of Mount Etna through Machine Learning Using Multiperspective Infrared Images. Remote Sens. 2020, 12, 970. [Google Scholar] [CrossRef]
- Justice, C.O.; Román, M.O.; Csiszar, I.; Vermote, E.F.; Wolfe, R.E.; Hook, S.J.; Friedl, M.; Wang, Z.; Schaaf, C.B.; Miura, T.; et al. Land and cryosphere products from Suomi NPP VIIRS: Overview and status. J. Geophys. Res. Atmos. 2013, 118, 9753–9765. [Google Scholar] [CrossRef] [PubMed]
- Schroeder, W.; Oliva, P.; Giglio, L.; Quayle, B.; Lorenz, E.; Morelli, F. Active fire detection using Landsat-8/OLI data. Remote Sens. Environ. 2016, 185, 210–220. [Google Scholar] [CrossRef]
- Blackett, M. An Overview of Infrared Remote Sensing of Volcanic Activity. J. Imaging 2017, 3, 13. [Google Scholar] [CrossRef]
- Cariello, S.; Malaguti, A.B.; Corradino, C.; Del Negro, C. V-STAR: A Cloud-Based Tool for Satellite Detection and Mapping of Volcanic Thermal Anomalies. GeoHazards 2025, 6, 24. [Google Scholar] [CrossRef]
- Coppola, D.; Aveni, S.; Campus, A.; Laiolo, M.; Massimetti, F.; Bernard, B. Rapid Response to Effusive Eruptions Using Satellite Infrared Data: The March 2024 Eruption of Fernandina (Galápagos). Remote Sens. 2025, 17, 1191. [Google Scholar] [CrossRef]
- Hallabia, H. A Graph-Based Superpixel Segmentation Approach Applied to Pansharpening. Sensors 2025, 25, 4992. [Google Scholar] [CrossRef] [PubMed]
- Di Bella, G.S.; Corradino, C.; Cariello, S.; Torrisi, F.; Del Negro, C. Advancing Volcanic Activity Monitoring: A Near-Real-Time Approach with Remote Sensing Data Fusion for Radiative Power Estimation. Remote Sens. 2024, 16, 2879. [Google Scholar] [CrossRef]
- Giglio, L.; Schroeder, W.; Justice, C.O. The collection 6 MODIS active fire detection algorithm and fire products. Remote Sens. Environ. 2016, 178, 31–41. [Google Scholar] [CrossRef] [PubMed]
- Li, X.; Li, C.; Vivone, G.; Hong, D. SeaMo: A season-aware multimodal foundation model for remote sensing. Inf. Fusion 2026, 125, 103334. [Google Scholar] [CrossRef]
- Mazza, A.; Guarino, G.; Scarpa, G.; Yuan, Q.; Vivone, G. PM2.5 Retrieval With Sentinel-5P Data Over Europe Exploiting Deep Learning. IEEE Trans. Geosci. Remote Sens. 2025, 63, 5510717. [Google Scholar] [CrossRef]
Disclaimer/Publisher’s Note: The statements, opinions and data contained in all publications are solely those of the individual author(s) and contributor(s) and not of MDPI and/or the editor(s). MDPI and/or the editor(s) disclaim responsibility for any injury to people or property resulting from any ideas, methods, instructions or products referred to in the content. |
© 2025 by the author. Licensee MDPI, Basel, Switzerland. This article is an open access article distributed under the terms and conditions of the Creative Commons Attribution (CC BY) license (https://creativecommons.org/licenses/by/4.0/).