Abstract
This research is framed within a larger project, whose general objective is the implementation of a SMG (Smart Micro-Grid) for distributed generation from renewable energy sources, with hydrogen as a backup. This project in-corporates an energy management system to optimize the operation of each of the systems involved while ensuring energy demand. Additionally, a hydrogen management strategy is included to maximize performance in its production, storage, and consumption within the SMG. Specifically, this work focuses on the design and implementation of a monitoring and optimization system for a SMG composed of a photovoltaic generator, a short-term energy storage system using a lithium battery, and a system for the generation, storage, and use of hydrogen produced in a fuel cell. The objective is the development of an HMI (Human Machine Interface) based on a touch operator panel KTP700 by the manufacturer Siemens, which runs in parallel with the existing SCADA (Supervisory Control and Data Acquisition) application implemented using the graphical programming software LabVIEW. The purpose of this HMI is to complement the SCADA system in such a way that it allows for direct, simple, and immediate interaction with all the equipment that comprises the SMG. This will provide quick and secure access to the monitoring of relevant variables and the parameterization of the hydrogen generator. Furthermore, due to the robustness and reliability of the industrial operator panels, the aim is to establish a supervision system with continuous and permanent operation, similar to the industrial plants automation and management systems.
1. Introduction
In recent years, the advancement of smart grids has driven the integration of more versatile supervision and control systems, capable of improving operational efficiency and the management of distributed energy resources. Within this context, smart micro-grids have emerged as a key solution to optimize energy generation, distribution, and consumption at a local scale [1].
However, in industrial and research environments, the operation of such systems often relies on the continuous execution of programming software—such as TIA Portal—on a central computer. This dependency limits [2] operational flexibility and may increase response times in the event of incidents or the need for on-site adjustments.
This work presents the implementation of a SIEMENS touch panel as a direct interface for the supervision and control of the devices that compose a smart micro-grid. The developed solution enables an operator to perform operations and adjustments without the need to keep the programming file active in TIA Portal, thus increasing system autonomy and reducing reliance on a running PC.
The objective of this paper is to describe the adopted architecture, the process of integrating the touch panel into the system, and the benefits obtained in terms of operability, reliability, and ease of use.
2. Materials and Methods
The control system is the key element that confers the “smart” attribute to the MicroGrid, thus constituting a Smart MicroGrid (SMG). On one hand, it ensures the proper operation of all components within the SMG. On the other hand, it manages the flow of energy and hydrogen across their respective buses to achieve optimal utilization of renewable energy resources.
This is a distributed control system, orchestrated around an industrial PROFINET communication network, which consists of three programmable logic controllers (PLCs) with identical CPU specifications and their associated distributed peripherals. All manufactured materials utilized in this study were sourced and produced in Madrid, Spain, in accordance with applicable industrial and quality standards. In this project, SIMATIC S7-1500 PLCs have been used. Specifically, the SIEMENS CPU 1516-3 PN/DP, (reference “6ES7516-3AN01-0AB0”) has been employed.
This modular, fanless control system is particularly well-suited for the implementation of distributed control architectures, as it features three PROFINET communication ports and one PROFIBUS DP port. The appearance of the CPU used is shown in Figure 1.
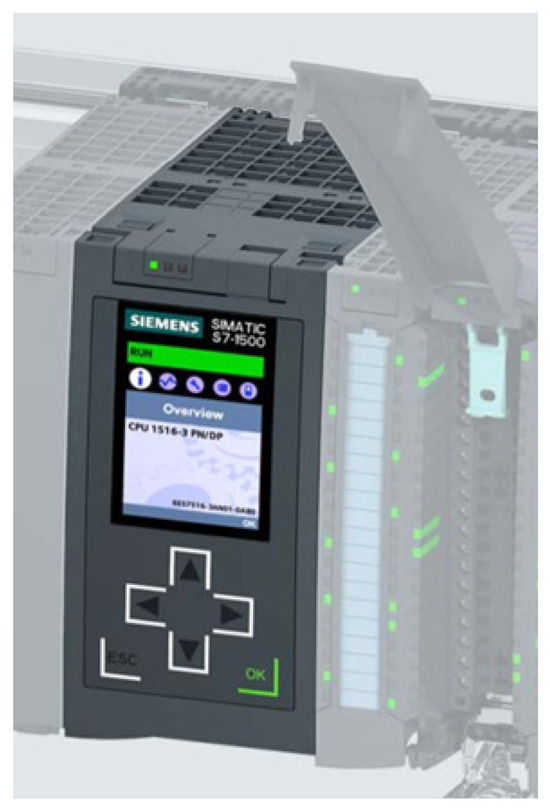
Figure 1.
CPU S7-1516-3PN/DP.
To complete the hardware configuration of each programmable logic controller (PLC), the following components will be included:
- A power supply unit, model 6EP1333-4BA00, to power the CPU, as well as the input/output modules and the sensors and actuators connected to the PLC.
- Digital input module DI 32x24VDC HF, which provides 32 digital inputs with an input voltage of 24 V DC.
- Digital output module DQ 32x24VDC/0.5A, which provides the PLC with 32 digital outputs at 24 V DC and a nominal current of 0.5 A per channel.
- Analog input module AI 8xU/I/RTD/TC ST, with 8 analog inputs that can be configured individually for each channel.
- Analog output module AQ 4xU/I ST, providing 4 analog outputs with voltage and current selection configurable per channel.
Figure 2 shows the complete equipment assembly.
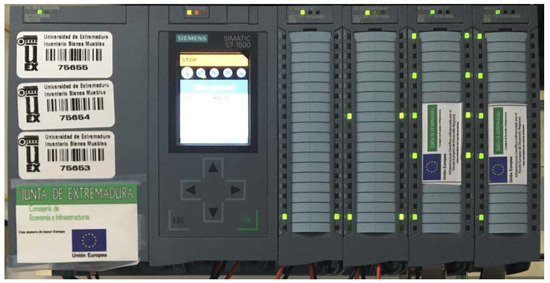
Figure 2.
Assembly of S7-1516.
In addition, distributed peripherals are used for acquiring relevant data from the photovoltaic panels. In this case, the SIMATIC ET 200SP decentralized peripheral system from Siemens is employed. This is a scalable solution that offers high flexibility for connecting process signals to a central controller via PROFINET, as shown in Figure 3.
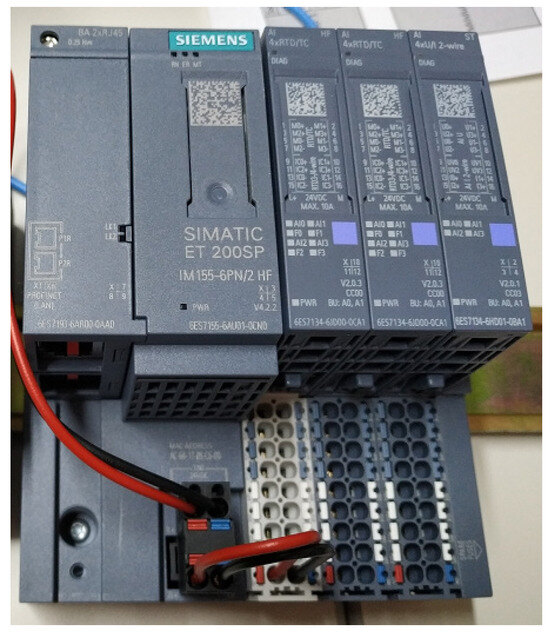
Figure 3.
ET200SP.
The system consists of an interface module, which communicates with all controllers compliant with the PROFINET IEC 61158 standard, up to 64 peripheral modules, which are inserted into passive base units (BaseUnits) in any combination, and a server module, which completes the SIMATIC ET 200SP configuration. This module is connected to the PLC via PROFINET and is installed on the rooftop, in situ, adjacent to the photovoltaic panels.
The three programmable logic controllers (PLCs) used for the control and management of the smart micro-grid (SMG) are arranged as follows:
- PLC1: Responsible for the management and control of the photovoltaic generator, the short-term energy storage system (lithium batteries), and the electronic load.
- Electrolyzer PLC: Responsible for the management and control of the hydrogen generator (electrolyzer).
- Fuel Cell PLC: Responsible for the management and control of the secondary electrical energy generator (fuel cell).
2.1. Supervisory System
To ensure the proper operation and management of the Smart MicroGrid (SMG), various automation, supervision, and control devices have been deployed. Additionally, due to the nature of the project, a redundant system has been implemented for the acquisition, monitoring, and large-scale storage of relevant data.
As previously mentioned, a distributed control system has been developed both for the management of the SMG and for controlling the operation of all its components. This system is distributed across two laboratories, D1.20 and D2.20. Each laboratory is equipped with a network switch connected to the Local Area Network (LAN) of the School of Industrial Engineering. Both switches are interconnected to form a micro-LAN, enabling communication among all components of the SMG’s control and data acquisition system.
Figure 4 shows the connection diagram of the equipment, along with their respective IP addresses.
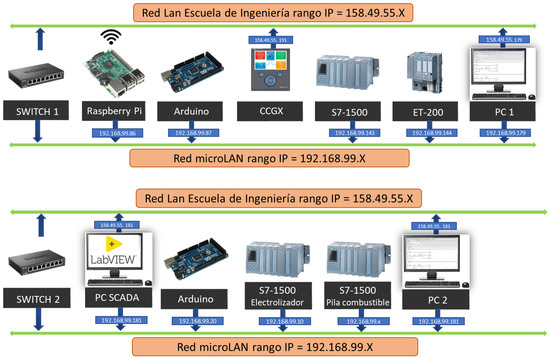
Figure 4.
Connection diagram of equipment.
The equipment comprising the subnet includes:
- PLC1, responsible for the automation and control of the photovoltaic generator, battery system, and electronic load. It also functions as a data acquisition system for the sensors connected to the local I/O modules corresponding to the battery, the electronic load, and the photovoltaic modules, via the Color Control GX communication center.
- ET200 distributed I/O system, providing access to the sensors of the solar panels located on the rooftop.
- Color Control GX communication center, manufactured by Victron Energy (Figure 4, serving as a graphical interface to display data from the panels, battery, and MPPT. It also provides Modbus TCP connectivity with the control system.
- Raspberry Pi and Arduino Mega 2560, used for acquiring data from the temperature sensors of the panels. Additionally, they act as a web server and database manager.
- PC, for online access and programming of the control system.
2.2. Comfort Panel TP700
The HMI interface developed in this project will be implemented on a TP700 operator panel from the Comfort Panels range manufactured by SIEMENS. The SIMATIC HMI Comfort Panels are a product line developed by SIEMENS, available in both touch-panel and keypad-panel configurations. This product line includes the following variants:
- Key Panels (keyboard-operated) with 4″, 7″, 9″, 12″, and 15″ displays.
- Touch Panels (touchscreen-operated) with 7″, 9″, 12″, 15″, 19″, and 22″ displays.
- Key & Touch Panels (keyboard and touchscreen operation) with a 4″ display.
All devices share the same functionalities and are configured exclusively using HMI WinCC V17 software, which is integrated into the Totally Integrated Automation Portal engineering framework.
The following sections describe the basic structure of the device used in this project, specifically the TP700 Comfort Touch Panel, which features a 7″ display diagonal.
3. Results and Discussion
The HMI interface developed in this work is not intended to replace the LabVIEW SCADA application; in fact, not all features available in the SCADA system can be implemented on the operator panel. Nevertheless, certain additional functionalities have been incorporated, such as alarm message sending and remote access, which are feasible thanks to the operator panel used.
The objective of this HMI interface is to complement the SCADA system by enabling direct, simple, and immediate control over all equipment comprising the SMG. Furthermore, due to the robustness and reliability of industrial operator panels, the goal is to provide a monitoring and supervision system with continuous and permanent operation, mirroring the plant automation and management system.
The HMI system will be integrated into the automation project developed using Siemens TIA Portal programming software.
3.1. Hardware Configuration
For the initial hardware configuration, the setup wizard provided by the programming environment will be used when a new HMI system is inserted into the project. This wizard follows a series of steps that facilitate the configuration and parameterization of the HMI interface.
Although the TP700 operator panel is physically installed in a different room than the PLC responsible for managing the generator, it was deemed appropriate to enable access to all the PLCs that make up the SMG automation and management system from the HMI interface. Figure 5 shows the configuration of the established connections to the PLCs for accessing the variables stored therein.
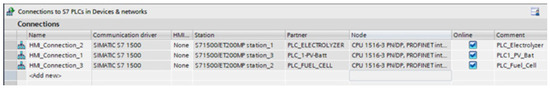
Figure 5.
Connections to S7 PLCs within Devices & Networks.
3.2. Screens
A dynamic and user-friendly interface has been designed to facilitate understanding of the SMG’s operation, including the internal visualization of each subsystem and the evolution of energy and hydrogen flows through the SMG. Since it is a complex system involving several processes, different screens have been defined within the same application, each with its own synoptics, active areas, and associated variables. The transition from one screen to another is carried out in an orderly manner by the operator through buttons activated by a graphical cursor linked to the mouse or by buttons on the screen to view the process evolution. Figure 6 shows the developed navigation scheme between screens.
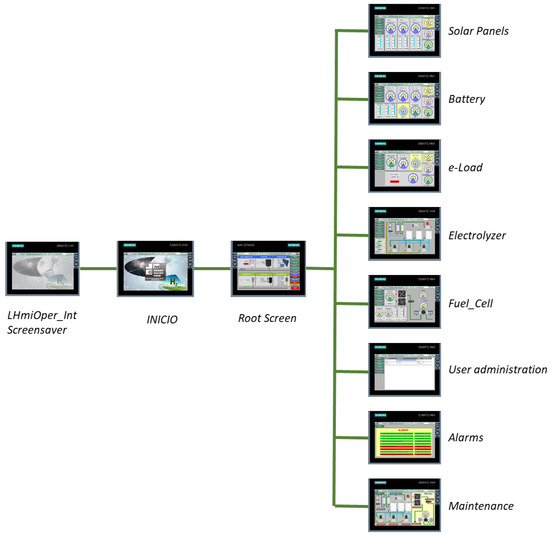
Figure 6.
Screen navigation.
3.3. “Root Screen”
This screen displays a general overview of the SMG, while also providing access to the other screens and the option to stop the HMI interface. This screen aims to show the most relevant information of each SMG subsystem, but without the capability to interact with them. In addition to the links included in the side menu, links to each process screen have been added to make navigation more intuitive. To achieve this, buttons have been created over each box where the title of the subsystem block is located, performing the same action as the corresponding button for that subsystem in the side menu. These buttons allow direct access to the processes while also providing the title for each subsystem’s box. The final view of the main panel is shown in Figure 7.
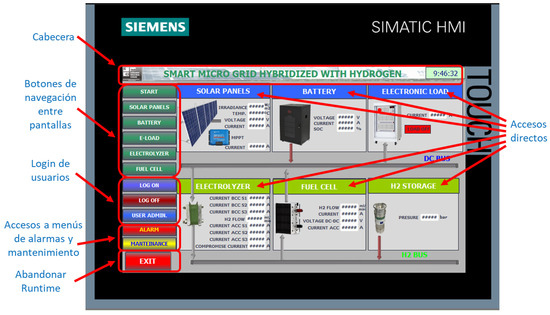
Figure 7.
Screen “Root Screen”.
As can be seen in Figure 7, the screen is divided into 6 distinct sections in several independent blocks for direct access to each subsystem. Additionally, to provide a more intuitive identification of the overall status of the SMG, arrows have been included in the synoptic diagram connected to the electric and hydrogen buses to indicate the active flows and their direction. The buses are always shown as active, and the arrows are displayed depending on the conditions of the electrical energy or H2 flows.
3.4. Screen “Solar Panel”
This screen displays the data from the solar panels. Since no variables can be modified by the user on the solar panels, this screen only allows data visualization, as shown in Figure 8.
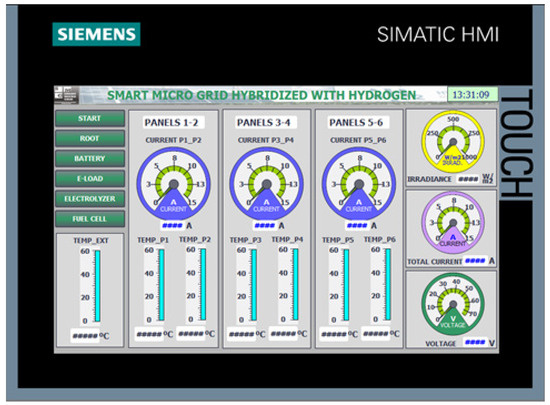
Figure 8.
“Solar Panels”.
This screen contains indicators with the following real-time information:
- Irradiance;
- Ambient temperature;
- Current of each parallel combination of solar panels;
- Temperature of each solar panel;
- Total current of the solar panels and total voltage of the solar panels.
3.5. Screen “Battery”
This screen is responsible for displaying the battery data. As with the solar panels, the battery does not allow the user to modify any variables; therefore, it will also be a data visualization interface, as shown in Figure 9.
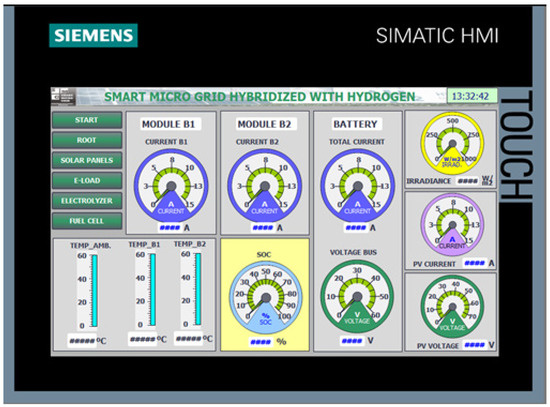
Figure 9.
“Battery”.
This screen contains indicators with the following real-time information:
- Current of modules B1 and B2;
- Total current and voltage of the battery;
- State of Charge (SOC);
- Battery temperature;
- Ambient temperature;
- Irradiance;
- Current and voltage of the solar panels.
3.6. Screen “e-Load”
In the SCADA system developed in LabVIEW, this screen aimed to define the consumption profile of the SMG by remotely controlling the electronic load. However, in this case, its functionality is reduced compared to the implemented version. This is because the commands that allow the user to control the electronic load by selecting the parameterization modes are sent via a serial communication managed from LabVIEW. That is, the load control is not performed from the PLC but resolved by the SCADA system. As a consequence, these parameters are not accessible from the HMI interface. Therefore, this screen also serves as an interface to visualize the instantaneous current demand of the electronic load.
To enrich this interface, additional content has been included, adding indicators with real-time information related to the energy demand, as shown in Figure 10. The variables considered are: total battery current and DC Bus voltage, battery State of Charge (SOC), irradiance, current of the solar panels, and voltage of the solar panels.
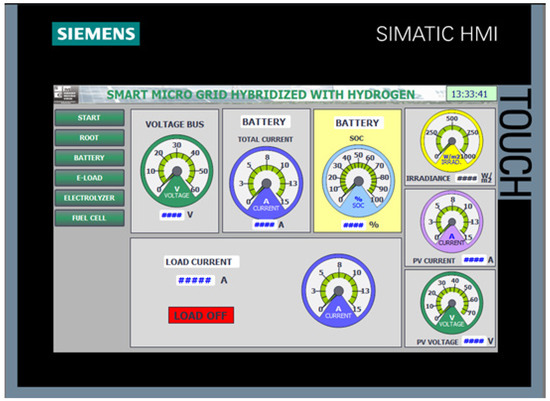
Figure 10.
“e-Load”.
An attempt was also made to include a Script on the operator panel to handle communication with the load using the RS485 serial interface. This option was discarded because the load only supports communication via the RS232 serial link.
Another possible solution to enable information exchange between the PLC and the electronic load is to use the open-source hardware/software platform Arduino. In this way, the Arduino microcontroller acts as an intermediary between both devices. For this, a communication channel must be defined between the PLC and Arduino using the ModBus TCP protocol to send the load parameterization signals to the Arduino microcontroller. These commands will then be forwarded from Arduino to the electronic load via one of Arduino’s serial ports.
3.7. Screen “Electrolyzer”
This screen is intended to monitor the operation of the modular electrolyzer. Figure 11 shows the screen with the electrolyzer synoptic, which includes all the constituent elements arranged to provide an intuitive visualization of its operation. This synoptic includes the following information: real-time indicators of bus current, current and voltage of each of the three stacks composing the modular electrolyzer, hydrogen production pressure, and flow rate.
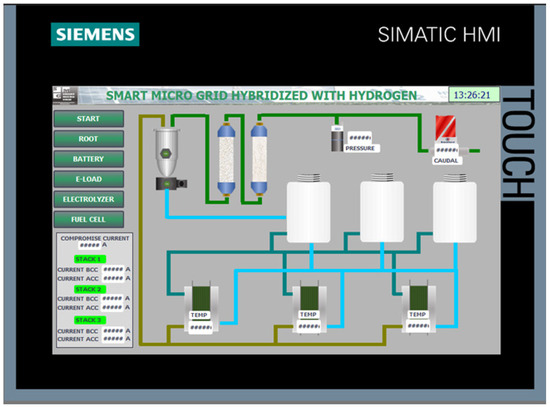
Figure 11.
“Electrolyzer” including the electrolyzer synoptic diagram.
3.8. Screen “Fuel Cell”
This screen is responsible for monitoring the operation of the hydrogen fuel cell. It consists of a synoptic to display sensor values, as well as animated visualizations of the fans when operating, hydrogen pipes when the fuel cell is running, and the activation of the solenoid valve. Figure 12 shows the screen corresponding to the hydrogen fuel cell. The indicators on this screen display the following real-time information: input pressure and output pressure shown on angular gauges, lower and upper temperature shown on thermometers, and the fuel cell output voltage shown on an angular gauge.
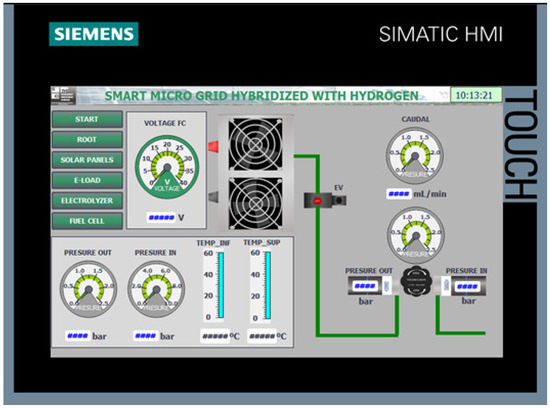
Figure 12.
“Fuel_Cell”.
3.9. Screen “Alarms”
During the normal operation of the SMG, alarm situations may arise due to the malfunctioning of some component. It is advisable to detect and anticipate this malfunction before it can cause a breakdown or the total collapse of the Smart Grid. If any of the programmed alarm situations occur, a red blinking indicator will appear along with an explanatory error message.
Figure 13 shows the alarm screen with explanatory texts of the programmed warnings. The alarms defined on this screen are:
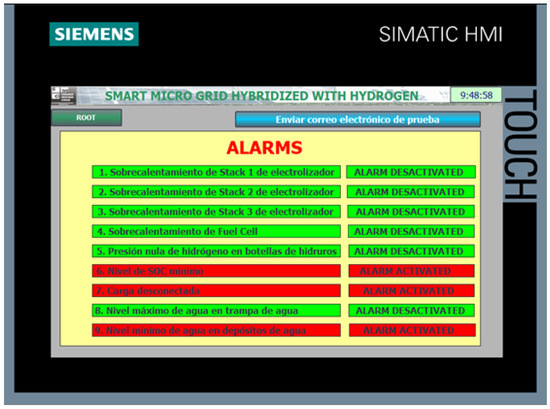
Figure 13.
“Alarms”.
- Overheating of Electrolyzer Stack 1;
- Overheating of Electrolyzer Stack 2;
- Overheating of Electrolyzer Stack 3;
- Overheating of Fuel Cell;
- Zero hydrogen pressure in hydride tanks;
- Minimum SOC (State of Charge) level;
- Load disconnected;
- Maximum water level in water trap;
- Minimum water level in water tanks.
This screen also includes a button to send a test email to ensure that the panel has an Internet connection and that the alarm notification message sending functions correctly.
3.10. Screen “Maintenance”
One of the most important functions of the HMI interface, which justifies the installation of the operator panel at the plant floor, is the ability to directly interact with field devices (actuators) to verify their operation and to perform individualized manual control of each component. This screen, shown in Figure 14, allows visualization of the synoptic diagram as well as forcing the state of various components of the electrolyzer and the fuel cell.
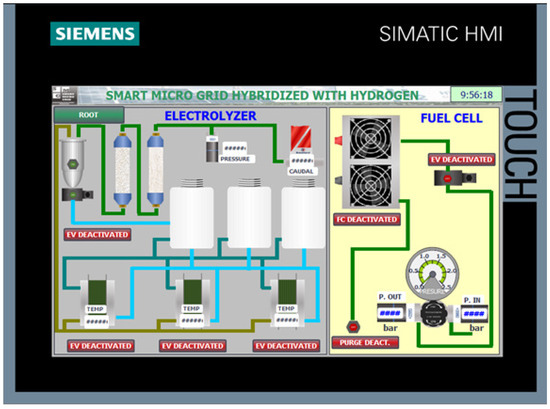
Figure 14.
“Maintenance”.
- Activation of Stack 1.
- Activation of Stack 2.
- Activation of Stack 3.
- Activation of the purge solenoid valve.
Manual control of the fuel cell includes:
- Activation of the feed solenoid valve.
- Activation of the fans.
- Activation of the purge solenoid valve.
4. Conclusions
The implementation of the HMI screens on the Siemens KTP700 panel, programmed using TIA Portal, has enabled an effective human–machine interface tailored for the control and monitoring of the smart micro-grid components. The development included a startup screen, user authentication confirmation, a main overview screen, and specialized screens for the electrolyzer, hydrogen fuel cell, and solar energy variables.
The user authentication mechanism enhances system security by restricting access to authorized personnel. The main and dedicated screens provide real-time visualization and control of critical operational parameters, facilitating efficient supervision and rapid response to system dynamics. The modular design of the screens ensures intuitive navigation and clear segregation of functional areas, improving operator usability and minimizing the risk of errors during operation.
This work demonstrates that the Siemens KTP700 panel, in conjunction with TIA Portal, constitutes a robust and flexible platform for the deployment of customized HMI solutions in smart energy systems, supporting enhanced operational reliability, maintainability, and system integration.
Author Contributions
Conceptualization, D.C., I.G. and A.J.C.; methodology, D.C.; software, D.C.; validation, I.G. and A.J.C.; formal analysis, I.G. and F.J.F.; investigation, D.C.; resources, A.J.C. and I.G.; data curation, D.C.; writing—original draft preparation, D.C. and F.J.F.; writing—review and editing, I.G. and A.J.C.; visualization, D.C., I.G. and A.J.C.; supervision, I.G. and A.J.C.; project administration, A.J.C. and I.G. All authors have read and agreed to the published version of the manuscript.
Funding
This work has been supported by MCIN with funding from European Union Next Generation EU (PRTR-C17.11).
Institutional Review Board Statement
Not applicable.
Informed Consent Statement
Not applicable.
Data Availability Statement
No new data were created or analyzed in this study. Data sharing is not applicable to this article.
Conflicts of Interest
The authors declare no conflict of interest.
References
- Calderón, D.; Folgado, F.J.; González, I.; Calderón, A.J. Implementation and Experimental Application of Industrial IoT Architecture Using Automation and IoT Hardware/Software. Sensors 2024, 24, 8074. [Google Scholar] [CrossRef] [PubMed]
- Folgado, F.J.; Calderón, D.; González, I.; Calderón, A.J. Review of Industry 4.0 from the Perspective of Automation and Supervision Systems: Definitions, Architectures and Recent Trends. Electronics 2024, 13, 782. [Google Scholar] [CrossRef]


Disclaimer/Publisher’s Note: The statements, opinions and data contained in all publications are solely those of the individual author(s) and contributor(s) and not of MDPI and/or the editor(s). MDPI and/or the editor(s) disclaim responsibility for any injury to people or property resulting from any ideas, methods, instructions or products referred to in the content. |
© 2025 by the authors. Licensee MDPI, Basel, Switzerland. This article is an open access article distributed under the terms and conditions of the Creative Commons Attribution (CC BY) license (https://creativecommons.org/licenses/by/4.0/).