Abstract
Structural Health Monitoring (SHM) systems increasingly require efficient and scalable methods for identifying structural damage under dynamic loading. Traditional learning-based SHM models often rely on high-dimensional features or deep architectures, which may be computationally intensive and difficult to deploy in real-time applications, especially in scenarios with limited resources or bandwidth constraints. In this work, we propose a lightweight classification framework based on Hyperdimensional Computing (HDC) to detect structural damage using vibration-induced features, aiming to reduce complexity while maintaining detection performance. The proposed method encodes a rich feature set, including time-domain, frequency-domain, and autoregressive (AR) model features into high-dimensional binary vectors through a sliding window approach, capturing temporal variations and local patterns within the signal. A supervised HDC classifier is trained to distinguish between healthy and damaged structural states using these compact encodings. The framework enables fast learning and low memory usage, making it particularly suitable for edge-level SHM applications where real-time processing is required. To evaluate the feasibility and effectiveness of the proposed method, experiments are conducted on vibration data collected from controlled lateral impact tests on a concrete-filled steel tubular structure. The results validate the method ability to detect the damage-induced variations in modal frequencies and highlight its potential as a compact, robust, and efficient solution for future SHM systems based on modal data.
1. Introduction
Structural Health Monitoring (SHM) plays a critical role in civil engineering, as it not only monitors the condition of a structure but also provides early warnings as soon as damage is nucleated [1]. By leveraging various sensors, SHM systems continuously or periodically record structural responses (e.g., vibrations or strain components), enabling the detection of abnormal patterns that may indicate performance degradation due to damage inception. This capability ensures structural safety and contributes to extending the service life.
Existing structural damage detection approaches can be broadly categorized into two classes. Physics-based approaches identify damage by analyzing changes in the dynamic characteristics of a structure, such as modal frequencies and mode shapes [2,3]. This approach is highly dependent on precise physical parameters and boundary conditions, making it difficult and computationally expensive to establish high-fidelity models for complex real-world structures. In contrast, data-driven approaches mainly utilize raw signal data or feature engineering to train machine learning or deep learning algorithms [4]. Although these data-driven methods show good detection performance, they face several challenges: deep learning models depend on large-scale architectures with millions of parameters to tune, whereas traditional machine learning algorithms require extensive computational resources for data preprocessing, training and tuning. These limitations lead to three major bottlenecks—high computational cost, large model size, and long training cycles. As on-site SHM systems are often limited by computing power, memory, and bandwidth, deploying and updating such computationally intensive models results difficult [5], potentially delaying timely damage identification and warning.
As SHM systems evolve towards edge computing and real-time deployment, developing lightweight online damage classification methods has become crucial. In this context, Hyperdimensional Computing (HDC), a brain-inspired emerging computing paradigm, offers a promising alternative [6]. HDC encodes information into high-dimensional, sparse, and randomly distributed vectors, enabling efficient operations in the hyperdimensional space. Its key properties—including hardware-friendliness, low computational overhead, and minimal memory requirements—make it particularly suitable for overcoming the aforementioned bottlenecks.
Motivated by this promising scenario, this paper proposes a lightweight structural damage detection framework based on HDC. The framework operates as follows: acceleration signals are first segmented using a fixed-length sliding window, followed by a segmental feature extraction strategy that generates a 10-dimensional feature vector comprising time-domain, frequency-domain, and autoregressive (AR) model features. These features are then encoded into high-dimensional binary vectors, and a health/damage classifier is rapidly trained through prototype learning. To evaluate the feasibility of the proposed framework, lateral impact test data on concrete-filled steel tubes are here exploited. The experimental results demonstrate that the framework successfully utilizes the low-memory advantage of HDC, maintaining high classification accuracy while also verifying its efficiency and practical value in resource-constrained scenarios.
2. Methods
In this paper, we introduce a lightweight SHM framework based on HDC. The framework consists of three main stages (see Figure 1): (i) windowing of impact-induced vibration signals and feature extraction; (ii) encoding of extracted features into hyperdimensional vectors; and (iii) HDC-based classification for training, inference, and evaluation.
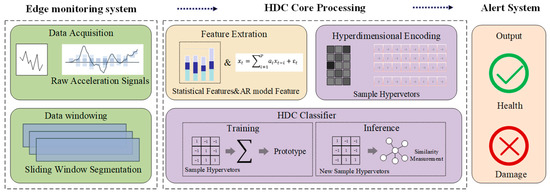
Figure 1.
Overall workflow of the proposed HDC-based lightweight SHM framework.
2.1. Signal Processing and Feature Extraction
Structural damage is often caused by sudden events such as impacts, leading to non-stationary and transient vibration responses characterized by signal statistics that evolve rapidly over time. Traditional global feature extraction methods may obscure critical damage information due to averaging effects. To address this limitation, we employ a sliding window-based segmental feature extraction strategy.
2.1.1. Data-Processing Workflow
The objective of this strategy is to generate information-rich feature vectors from raw time-series data for subsequent HDC encoding (see Figure 2). The workflow consists of three main steps:
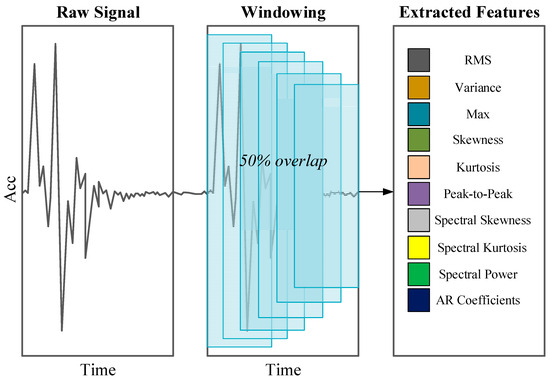
Figure 2.
Feature extraction process for damage classification.
- Windowing: A fixed-length window of 2048 data points slides across the original signal with a 50% overlap. This segmentation converts long time-series signals into overlapping short-term samples suitable for analysis.
- Feature computation: For each windowed sample, two types of features are extracted. First, the sample is divided into T equal-length sub-segments, from which 9 local time–frequency statistical metrics are calculated to characterize short-term variations. In addition, a p-order AR model is fitted to each sample, and its coefficients are extracted.
- Feature vector construction: Features from all sub-segments are concatenated, and vectors across sensors are combined into a final high-dimensional feature representation for HDC encoding. The hyperparameters T and p are optimized through grid search with cross-validation.
2.1.2. Feature Computation and Its Physical Significance
The following selected features are designed to characterize the structural condition across multiple dimensions, including signal energy, distributional shape, and dynamic behavior, with their specific formulas summarized in Table 1:

Table 1.
Summary of the 10 features extracted from vibration signals for damage classification.
- Root Mean Square (RMS) and Variance: Indicators of vibration energy; damage (e.g., cracks) that modifies stiffness and damping, altering the energy dissipation patterns.
- Maximum and Peak-to-Peak: Sensitive to transient impacts and suitable for capturing sharp responses caused by external or internal damage.
- Skewness: Measure of the asymmetry in signal distribution. Healthy linear structures typically produce symmetric responses, while damage can introduce nonlinearities, leading to skewed distributions.
- Kurtosis: Sensitive to impulsive components, with high values indicating sharp transient impacts associated with damage initiation.
- Spectral Skewness and Spectral Kurtosis: Describe symmetry and peakedness of the power spectrum. Damage-induced nonlinearities can redistribute energy across frequency bands or generate harmonics.
- Spectral Power: A weighted spectral power measure emphasizes high-frequency components, which are often excited by micro-cracks and friction, making them effective indicators of damage.
- AR Coefficients: Capture temporal correlations within signals and serve as a compact “mathematical fingerprint” of structural dynamics [7]. Changes in system properties (mass, stiffness, damping) due to damage alter these coefficients. The Levinson–Durbin algorithm is employed for efficient estimation.
2.2. Hyperdimensional Encoding
Hyperdimensional encoding is the core of the proposed framework. It transforms the constructed N-dimensional feature vectors into a high-dimensional binary space, forming a D-dimensional bipolar hypervector. This process follows the classical position–value encoding scheme, which involves the following steps:
- Base Hypervector Generation: Two sets of base hypervectors are initialized randomly:
Position Hypervectors: For each of the N feature positions, a unique random bipolar hypervector is generated, denoted as , to represent the identity of the corresponding feature position.
Value Hypervectors: Continuous feature values are linearly quantized into L discrete levels. Each level j is represented by a unique D-dimensional bipolar value hyperdimensional vector .
- Binding: Given a sample feature vector , each feature is mapped to a quantized level . The corresponding position and value hypervectors are bound through element-wise multiplication (i.e., the XOR operation for bipolar vectors):
- Bundling: The resulting feature hypervectors are aggregated into a single sample hypervector . This aggregation is achieved via element-wise summation followed by a sign function:
After this transformation, each vibration signal sample is represented by a D-dimensional bipolar hyperdimensional vector suitable for HDC-based classification.
2.3. HDC Classifier Training and Inference
The classification task is performed using a centroid-based HDC classifier, with distinct procedures for training and inference.
The training process is single-pass and computationally efficient. For each class c (e.g., healthy or damaged), a prototype hyperdimensional vector is constructed as:
where is the index set of training samples belonging to class c, and each is the D-dimensional hypervector for an individual sample. The resulting vector acts as the unique centroid for its class.
During inference, a query hypervector is compared with all class prototypes. The class label is assigned based on maximum similarity, where similarity is measured via the dot product according to:
This simple maximum-similarity decision rule ensures highly efficient classification, requiring only vector dot products and comparisons.
2.4. Model Evaluation and Hyperparameter Tuning
To assess model robustness and generalization, we employed 5-fold stratified cross-validation. Classification performance was evaluated using F1-score, AUC, precision, and recall, with F1-score serving as the primary metric for hyperparameter optimization. Hyperparameters tuned included the number of sub-segments T, the AR model order p, the hyperdimensional vector dimensionality D, and the quantization levels L.
3. Experiments and Results
3.1. Experiment Setup and Data Acquisition
The proposed framework was validated on data from controlled lateral impact tests on a concrete-filled steel tube (CFST) structure. The experimental workflow consisted of three stages, see Figure 3: intact-state testing, damage application, and post-damage testing:
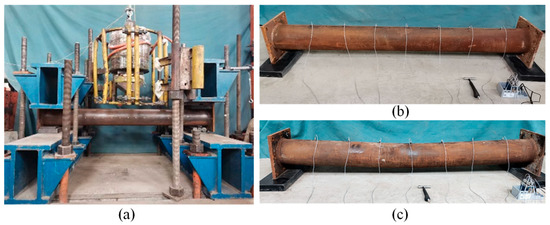
Figure 3.
Experimental setup of lateral impact testing on CFST specimen. (a) Lateral impact testing apparatus; (b) intact CFST specimen before impact, and (c) damaged CFST specimen after impact.
- Intact-State Data Acquisition: The undamaged specimen was placed on rubber pads to simulate free-free boundary conditions. An instrumented hammer struck 15 predefined points on the steel tube, and acceleration and force signals were recorded using the deployed HBK 4508-B-003 piezoelectric accelerometers [8] and a hammer force sensor. Each point was struck five times to reduce random error.
- Impact Damage Application: The specimen was then subjected to a single lateral impact using an impact testing apparatus to induce internal damage.
- Damaged-State Data Acquisition: Post-impact vibration responses were collected following the same procedure as the intact-state testing. All signals were sampled at 25,000 Hz to ensure accurate capture of high-frequency vibration components.
- Dataset Construction. Signal data collected before the impact were labeled as “Healthy” (label 0), and post-impact data as “Damaged” (label 1). Using the sliding-window procedure described in Section 2.1, a series of labeled samples was generated to form the dataset for training and evaluation.
3.2. Implementation and Evaluation
To assess the model performance, it is compared with two well-established machine learning classifiers: Support Vector Machine (SVM) and Random Forest. All models were evaluated using a 5-fold stratified cross-validation approach to ensure robustness. Classification performance was measured using F1-score, AUC, precision, and recall, with F1-score serving as the primary metric for optimization.
A grid search was performed to optimize the hyperparameters for the HDC framework. The optimal configuration was found to be T = 5 (number of sub-segments), p = 5 (AR model order), D = 60,000 (hyper-vector dimensionality), and L = 100 (quantization levels). All subsequent evaluations were conducted using these settings.
3.3. Results and Analysis
3.3.1. Classification Performance
Under the optimal configuration, the HDC framework achieved excellent classification performance (see Figure 4), demonstrating its effectiveness in distinguishing between healthy and damaged structural states. Table 2 summarizes the performance of the HDC model alongside the benchmark SVM and Random Forest classifiers.
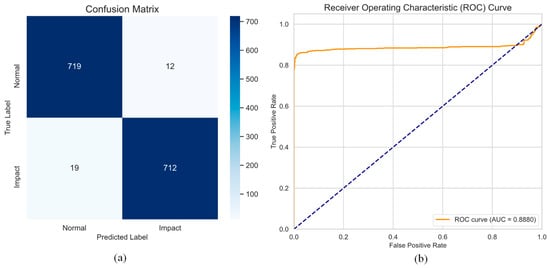
Figure 4.
Performance of HDC. (a) Confusion matrix, and (b) ROC curve.
Table 2.
Comparison of Classification Performance.
3.3.2. Comparative Analysis
The results indicate that the proposed HDC framework achieves highly accurate damage detection, with an F1-score exceeding 98%. This validates the effectiveness of the sliding-window feature extraction strategy and the HDC encoding-classification pipeline.
While the SVM and Random Forest models show slightly higher scores in this offline analysis, the HDC model performance is highly competitive and well within the acceptable range for reliable SHM systems. More importantly, this high accuracy was achieved within a “lightweight” paradigm. Unlike SVM or Random Forest, which can be computationally intensive and require significant memory, the HDC framework is designed for efficiency, making it uniquely suited for on-site, real-time deployment on edge devices with limited resources. The minor trade-off in accuracy is offset by substantial gains in computational efficiency and a smaller memory footprint, which are critical bottlenecks in modern SHM applications.
4. Discussion and Conclusions
This study demonstrates that a lightweight HDC framework can accurately identify structural impact damage while maintaining low computational overhead. The high F1-score attained in a benchmark test confirms that the sliding window-based segmental feature extraction, including AR model features, effectively captures dynamic and statistical characteristics indicative of the structural health. Importantly, these results were achieved using a computationally efficient and memory-light paradigm, highlighting that high-precision damage detection does not necessarily require complex deep learning architectures or computationally intensive models. In summary, the proposed HDC framework provides a highly promising solution for real-time SHM applications, particularly in edge-computing scenarios where computational resources and memory are constrained.
Nevertheless, a limitation of the proposed framework is its resolution capability. While the approach effectively identifies and classifies macroscopic damage, its ability to detect localized defects remains limited. This limitation stems from the reliance on modal features, which characterize the global structural behavior but may overlook subtle local variations. Future work will focus on enhancing sensitivity to small-scale damage by incorporating local descriptors, such as semi-wave energy or wavelet-based features. Additionally, the framework will be extended to more complex structural systems and investigate the potential for hardware acceleration to further leverage HDC efficiency advantages.
Author Contributions
Investigation, resources and methodology, X.-L.L.; visualization, writing—original draft preparation, X.-L.L.; methodology, writing—review and editing, S.M. and X.-L.L.; project administration, X.-L.L. All authors have read and agreed to the published version of the manuscript.
Funding
This research was funded by the China Scholarship Council, grant number 202409350008.
Institutional Review Board Statement
Not applicable.
Informed Consent Statement
Not applicable.
Data Availability Statement
The data presented in this study are available on request from the corresponding author.
Conflicts of Interest
The authors declare no conflicts of interest.
References
- Zhang, B.; Ren, Y.; He, S.; Gao, Z.; Li, B.; Song, J. A review of methods and applications in structural health monitoring (SHM) for bridges. Measurement 2025, 245, 116575. [Google Scholar] [CrossRef]
- Krishnan, M.; Bhowmik, B.; Hazra, B.; Pakrashi, V. Real time damage detection using recursive principal components and time varying auto-regressive modeling. Mech. Syst. Signal Process. 2018, 101, 549–574. [Google Scholar] [CrossRef]
- Magalhães, F.; Cunha, Á.; Caetano, E. Vibration based structural health monitoring of an arch bridge: From automated OMA to damage detection. Mech. Syst. Signal Process. 2012, 28, 212–228. [Google Scholar] [CrossRef]
- Tavares, A.; Di Lorenzo, E.; Peeters, B.; Coppotelli, G.; Silvestre, N. Damage Detection in Lightweight Structures Using Artificial Intelligence Techniques. Exp. Tech. 2021, 45, 389–410. [Google Scholar] [CrossRef]
- Peng, Z.; Li, J.; Hao, H.; Zhong, Y. Smart structural health monitoring using computer vision and edge computing. Eng. Struct. 2024, 319, 118809. [Google Scholar] [CrossRef]
- Kanerva, P. Hyperdimensional Computing: An Introduction to Computing in Distributed Representation with High-Dimensional Random Vectors. Cogn. Comput. 2009, 1, 139–159. [Google Scholar] [CrossRef]
- Entezami, A.; Mariani, S.; Shariatmadar, H. Damage Detection in Largely Unobserved Structures under Varying Environmental Conditions: An AutoRegressive Spectrum and Multi-Level Machine Learning Methodology. Sensors 2022, 22, 1400. [Google Scholar] [CrossRef]
- HBK. Piezoelectric Accelerometer Types 4507 and 4508 Datasheet. 2025. Available online: https://www.bksv.com/doc/bp1841.pdf (accessed on 26 September 2025).
Disclaimer/Publisher’s Note: The statements, opinions and data contained in all publications are solely those of the individual author(s) and contributor(s) and not of MDPI and/or the editor(s). MDPI and/or the editor(s) disclaim responsibility for any injury to people or property resulting from any ideas, methods, instructions or products referred to in the content. |
© 2025 by the authors. Licensee MDPI, Basel, Switzerland. This article is an open access article distributed under the terms and conditions of the Creative Commons Attribution (CC BY) license (https://creativecommons.org/licenses/by/4.0/).