Abstract
Voice acoustics have been extensively investigated as potential non-invasive markers for Autism Spectrum Disorder (ASD). Although many studies report high accuracies, they typically rely on highly controlled clinical protocols that reduce linguistic variability. Their data is also recorded using specialized microphone arrays that ensure high-quality recordings. Such dependencies limit their applicability in real-world or in-home screening contexts. In this work, we explore an alternative approach designed to reflect the requirements of mobile-based applications that could assist parents in monitoring their children. We use an open-access dataset of naturalistic storytelling, extracting only the speech segments in which the child is speaking. We applied previously published ASD voice-analysis pipelines to this dataset, which yielded suboptimal performance under these less controlled conditions. We then introduce a deep learning-based method that learns discriminative representations directly from raw audio, eliminating the need for manual feature extraction while being more robust to environmental noise. This approach achieves an accuracy of up to 77% in classifying children with ASD, children with Attention Deficit Hyperactivity Disorder (ADHD), and neurotypical children. Frequency-band occlusion sensitivity analysis on the deep model revealed that ASD speech relied more heavily on the 2000–4000 Hz range, TD speech on both low (100–300 Hz) and high (4000–8000 Hz) bands, and ADHD speech on mid-frequency regions. These spectral patterns may help bring us closer to developing practical, accessible pre-screening tools for parents.
1. Introduction
Autism Spectrum Disorder (ASD) is a neurodevelopmental condition that affects social communication and behavior, and early detection plays a critical role in improving intervention outcomes. Advances in speech and language technologies have encouraged research into the use of voice recorders as a non-invasive biometric sensor for screening ASD [1]. While these findings are encouraging, most of these existing approaches have been developed and tested in controlled clinical or laboratory settings with specialized microphone arrays, where participants follow standardized speech tasks and recordings are made under optimal acoustic conditions.
The increasing availability of mobile devices offers the possibility of extending such analyses beyond clinical settings and into more natural, everyday contexts. In-home voice-based screening could improve accessibility, reduce costs, and enable earlier identification, particularly in regions where specialized diagnostic services are scarce. However, the variability of real-world data, which often includes background noise, spontaneous speech, and diverse recording conditions, presents significant challenges for methods originally designed for highly structured environments.
The present study investigates whether voice analysis can be adapted to a more naturalistic setting that reflects the conditions of in-home data collection, making the solution less sensitive to sensor technology as well as clinical setups. We focus on a storytelling-based interaction scenario involving children from three diagnostic groups: ASD, Attention Deficit Hyperactivity Disorder (ADHD), and neurotypical controls. After evaluating the performance of established voice-analysis pipelines on this dataset, we introduce a deep learning approach capable of learning discriminative patterns directly from the audio signal. The remainder of the paper is organized as follows: Section 2 reviews the literature on voice biomarkers; Section 3 describes the dataset and the methods used, including both voice-biomarker-based approaches and deep learning; Section 4 presents and analyzes the results; and Section 5 concludes the study.
2. Literature Review
Voice acoustics have recently attracted interest as non-invasive markers for ASD detection, with consistent reports of atypical prosody, pitch modulation, and timing irregularities as acoustic characteristics. Most studies follow a common pipeline including cleaning short speech segments, extracting hand-crafted acoustic descriptors, and training a conventional classifier, typically on binary ASD-versus-typically developing (TD) comparisons [2,3,4,5,6,7,8]. Within this paradigm, feature sets converge on perturbation and spectral measures such as jitter, shimmer, harmonic-to-noise ratio (HNR), formants and MFCCs. The choice of these features is mainly motivated by their interpretability in phonation stability and vocal tract [2,4,6]. Reported accuracies are frequently high in-sample (≈78–98%), but are sensitive to cohort size, elicitation task, language, and validation strategy [8,9].
Two representative studies [9,10] illustrate the methodological spectrum in this field, ranging from approaches that combine a broad set of engineered features with standard machine learning algorithms to those that rely on task-controlled elicitation protocols coupled with a compact set of features designed for stability and robustness. Vacca et al. [10] employ a broad, engineered-feature approach in which child speech undergoes manual clipping, denoising, and pre-emphasis, followed by the extraction of more than 30 acoustic measures. These include F0, F1–F5, MFCCs, LPCCs, jitter, shimmer, harmonics-to-noise ratio (HNR), energy, and zero-crossing rate, computed on 20–30 ms frames. The resulting features are used to train several supervised classifiers such as SVM, Random Forest, Logistic Regression, and Naïve Bayes. This approach yields very high internal accuracy and precision/recall rates exceeding 98.8% for ASD detection, although the authors note typical threats to generalizability due to the small sample size and the high feature-to-sample ratio. In contrast, Briend et al. [11] used a task-controlled elicitation protocol consisting of a nonword-repetition task in order to minimize linguistic and pragmatic variability. They focus on a compact, physiologically grounded feature set comprising F0, F1–F4, formant dispersion, HNR, jitter, and shimmer. This set is augmented with distributional statistics such as skewness and kurtosis to capture intra-speaker variability. Using an unsupervised k-means procedure guided by ROC analysis and Monte-Carlo cross-validation, they achieve strong discrimination between ASD, typically developing (TD) children, and a heterogeneous clinical control group.
3. Framework
This section presents the experimental framework, including a description of the dataset, the preprocessing procedures for voice biomarker extraction, and the deep learning approach.
3.1. Dataset
The dataset used in this study is drawn from the SK sub-corpus of the Asymmetries Project collection, compiled by Hendriks et al. [12,13] and available through the TalkBank [14] repository. It contains Dutch language productions collected in Groningen and nearby towns in the northern Netherlands. The SK sub-corpus includes 46 children with ASD, 37 with ADHD, and 38 typically developing (TD) children, with mean ages of 9 years 3 months, 8 years 9 months, and 9 years, respectively. Boys constitute the majority in all groups (ASD: 87%, ADHD: 84%, TD: 66%). Data was recorded during structured storytelling sessions conducted individually at the University of Groningen. Clinical diagnoses for ASD and ADHD were confirmed using standardized and validated assessment procedures. All sessions were recorded using an Olympus voice recorder in WMA format, and the files were transcribed and verified for coding consistency. The audio recordings and transcripts are publicly available upon registration through the researchers’ website.
3.2. Preprocessing
For each participant, the dataset provides a long audio recording of the experimental session, accompanied by a corresponding cha annotation file. These annotations include precise timestamps indicating the periods when the child is speaking. To isolate the relevant speech segments, we extracted and cropped the portions corresponding to the child’s speech, resulting in a set of short speech samples for each participant.
3.3. Methods
3.3.1. Conventional Classifiers
As previously discussed, voice biomarkers have been shown to be effective in the identification of autism. In order to investigate their utility in the context of developing a general screening tool, we extracted these features based on the methods reported in the aforementioned studies and used them to train classifiers to assess their effectiveness. In this section, we provide further details on the feature extraction process as well as the methods used for classifier training and testing. The conventional classifiers operate using the extracted features as input.
- Voice biomarker extraction
Acoustic features were computed in Python 3.11 using Parselmouth (Praat) [15], NumPy, Pandas, and SciPy libraries. Each child-speech segment was analyzed after excluding files shorter than 1 s. Fundamental frequency was obtained with Praat’s autocorrelation pitch tracker with a 90–600 Hz search range; unvoiced frames were removed prior to analysis. Vowel resonances were estimated with Burg formant tracking [16] (time step 0.085 s, up to five formants, 5.5 kHz maximum), from which we derived mean F1–F4 and formant dispersion, defined as the average adjacent spacing among F1–F4. Harmonics-to-noise ratio was computed from Praat’s harmonicity function with invalid values discarded. Jitter and shimmer were obtained from a pitch-synchronous point process using Praat’s local measures with standard parameterization. For each feature family we reported the mean to capture central tendency and the skewness and kurtosis to capture intra-speaker distributional shape. Features were exported as a CSV table with one row per segment and used to train and test classical classifiers for the three classes: ASD, ADHD, and TD.
- Classification
We first evaluated the extracted voice biomarkers using multiple conventional classifiers, including support vector machines (SVMs) [17], k-nearest neighbors (KNN) [18], Gradient Boosting [19], AdaBoost [20], and a fully connected multilayer perception (MLP) [21], in a three-class setting (ASD, ADHD, TD). Among these models, the SVM with a radial basis function (RBF) kernel achieved the highest and most consistent performance. Based on this result, we focused subsequent experiments on the SVM while incorporating different feature selection strategies to further optimize performance. Four approaches were compared within a nested cross-validation framework: no feature selection, univariate ANOVA F-statistics [22], univariate mutual information [23], and an embedded L1-regularized logistic regression selector [24]. The outer loop consisted of 10 folds for unbiased performance estimation, and the inner loop used 5 folds for hyperparameter tuning via randomized search. Each pipeline applied standardization, feature selection, and SVM training within the inner loop to prevent train/test leakage. Model performance was evaluated using accuracy, precision, recall and Macro F1-scores as will be detailed in Section 4.
3.3.2. Deep Learning Approach
Given the limitations of hand-crafted voice-biomarker pipelines in more naturalistic conditions, such as in-home recording environments, we explored a deep learning approach that could learn discriminative acoustic representations directly from raw audio. Deep learning models have the capacity to capture complex and subtle prosodic and spectral cues that may not be well-represented by predefined features, making them particularly suitable for settings with high variability in lexical content and background noise.
For this purpose, we selected WavLM-Base-Plus [25], a transformer-based self-supervised speech representation model developed by Microsoft (Redmond, WA, USA). WavLM is pre-trained on large-scale, noisy speech data using a masked speech prediction objective, where portions of the input waveform are hidden and reconstructed from surrounding context. This approach enables the model to acquire robust acoustic and prosodic representations that generalize across speakers, recording conditions, and linguistic variability. In addition, its pretraining incorporates sub-stream separation tasks that train the model to focus on a target speaker in the presence of background noise or overlapping speech. These capabilities make WavLM particularly well-suited for our three-class classification of ASD, ADHD, and TD speech samples.
We organized the audio segments into class-specific directories and split them into training, validation, and test sets using stratified sampling to maintain class proportions across subsets. Each segment was resampled to 16 kHz to match the input requirements of WavLM and to standardize spectral resolution. Segments were padded to a minimum duration of 1 s and then cropped or zero-padded to a fixed length of 10 s to facilitate batch processing while retaining relevant acoustic information. To enhance robustness, we applied content-invariant augmentations such as speed perturbation, time dropout, and gain jitter during training. These augmentations aimed to reduce sensitivity to specific lexical content, recording artifacts, and environmental noise, thereby improving generalization to diverse real-world conditions.
The WavLM encoder was configured to output hidden states from all transformer layers. We applied masked mean pooling to the hidden states of a mid-layer, averaging only over non-padded time steps to ensure that silence and zero-padding did not distort the representation. Using a mid-layer allowed us to emphasize acoustic and prosodic information while reducing reliance on high-level lexical features. The resulting pooled vector was then passed through a dropout layer and a linear classification head to produce the final class logits. Figure 1 summarizes the framework of the deep learning model.
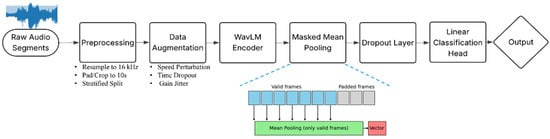
Figure 1.
Deep learning framework for voice-based ASD detection using WavLM-Base-Plus.
To address class imbalance, we employed weighted cross-entropy loss with label smoothing set to 0.05. Class weights were calculated from the distribution of the training set to give higher importance to underrepresented classes and prevent bias toward majority classes. Training was conducted for 25 epochs with a learning rate of 1 × 10⁻⁵ and a batch size of 8, providing stable fine-tuning while preserving the generalization ability learned during pretraining.
This approach was designed to leverage WavLM’s strength in extracting rich and detailed patterns in voice directly from audio files, while incorporating preprocessing and augmentation strategies tailored to the challenges of naturalistic, in-home data.
4. Results and Discussions
To evaluate the effectiveness of our approach, we compared two distinct pipelines for classifying ASD, ADHD, and TD speech samples. The first relies on hand-crafted acoustic features coupled with conventional machine learning classifiers, while the second leverages a deep learning framework based on WavLM-Base-Plus to learn task-specific representations directly from audio. This section details the results.
4.1. Conventional Classifiers on Voice Biomarkers
For conventional classifiers on voice biomarkers, the reported results are obtained using 10-fold cross-validation to ensure the reliability of the findings. Table 1 presents the precision, recall, accuracy, and macro F1-score for different classification methods, with optimized hyperparameters determined through grid search. Among all methods SVM classifier with the RBF kernel gives the highest performance. While the results are modest for a three-class classification task, where random guessing would yield a performance of 0.33, they are significantly above chance, suggesting that the outcomes are not due to randomness.

Table 1.
Performance on conventional classifiers applied to voice biomarkers without feature selection.
In order to improve the performance of the best-trained classifier by eliminating voice characteristics that are uninformative or may negatively influence the results, we investigated several feature selection methods, as described in (B) in Section 3.3.1. Table 2 reports the performance of the SVM classifier with an RBF kernel with different feature selection approaches.
Table 2.
Performance with different feature selection methods using SVM with RBF kernel.
Among the evaluated feature selection methods, ANOVA F achieved the best performance, with an accuracy of 0.4720, precision of 0.4747, recall of 0.4690, and macro-F1 score of 0.4697. The baseline without feature selection yielded slightly lower results (accuracy 0.4592, macro-F1 0.4575). Mutual Information performed marginally worse than the baseline, with an accuracy of 0.4546 and macro-F1 of 0.4527. L1-Logistic Regression showed the lowest performance, with an accuracy of 0.4387 and macro-F1 of 0.4375.
Investigating the results of the feature selection process shows that most methods consistently converged on the same set of 15 features across all folds, indicating strong stability. The most recurrently selected features comprised mean pitch (mean_f0), the first four formant means (mean_F1–F4), mean frequency deviation (mean_fd), mean harmonic-to-noise ratio (mean_hnr), jitter, shimmer, and higher-order statistics such as skewness and kurtosis for these measures. With only minor variations in kurtosis-based features, this core set was retained in every outer fold for all three methods k-best (F-score), k-best (mutual information), and L1-regularized logistic regression, indicating their consistent relevance to the classification task.
4.2. Deep Learning Model
The deep learning model achieved an overall accuracy of 0.769, with notably strong performance for the SK-ASD class, where precision was 0.78, recall was 0.93, and F1-score was 0.85. The high recall for SK-ASD indicates that the model is particularly effective at correctly identifying ASD cases. Detailed class-wise results are provided in Table 3.
Table 3.
Performance of the deep learning approach for each class.
The stronger performance of the deep learning model can be mainly attributed to the general robustness of deep learning approaches to noise as well as variability in the acoustic signal, making it a reliable candidate for data acquired by less professional sensors, such as simple phone recordings.
To better understand the acoustic cues driving classification, we conducted an occlusion sensitivity analysis [26], where specific spectral bands were removed, and the change in classification probability (Δ prob) relative to the unaltered signal was measured for each class. Results revealed clear class-specific dependencies on different frequency regions. For ASD detection, the model relied heavily on the 2000–4000 Hz range (Δ ≈ 0.63) and, to a lesser extent, on low-frequency energy between 100–300 Hz, suggesting that both fine spectral details in the mid-high frequency range (e.g., formant structure, fricative content) and fundamental/low harmonic information are important discriminative features. TD detection was most sensitive to the 100–300 Hz range (Δ ≈ 0.46) and the high-frequency band 4000–8000 Hz (Δ ≈ 0.52), indicating that both voice pitch cues and high-frequency consonant information contribute to its identification. In contrast, ADHD detection depended strongly on the 1000–2000 Hz range (Δ ≈ 0.36) and mid-low frequencies between 300–600 Hz (Δ ≈ 0.39), while removal of the lowest band (100–300 Hz) slightly improved its performance (negative Δ), suggesting that energy in this band may carry non-discriminative or confounding information for ADHD classification. These findings indicate that different neurodevelopmental conditions exhibit distinct spectral importance patterns, underscoring the potential of frequency-targeted features for improving diagnostic models. Figure 2a illustrates the result of the frequency-band occlusion analysis.
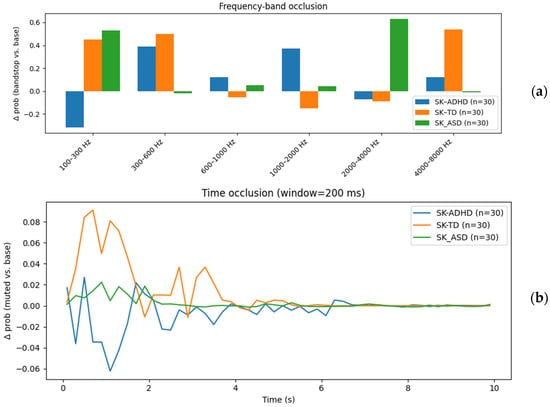
Figure 2.
(a) Frequency-band occlusion analysis showing Δ prob when specific frequency ranges are removed, revealing class-specific spectral dependencies, with ASD relying on 2000–4000 Hz, TD on 100–300 Hz and 4000–8000 Hz, and ADHD on mid-frequency bands. (b) Time-occlusion analysis showing the change in classification probability (Δ prob) over time for SK-ADHD, SK-TD, and SK-ASD. Positive values indicate reliance on the segments that are occluded.
Similarly, Figure 2b presents the results of a time-occlusion analysis, in which short 200 ms segments of the audio signal were systematically muted to assess their contribution to the classification probability for each diagnostic group. The y-axis (Δ prob) indicates the change in predicted probability for the target class when a given segment is removed, compared to the baseline (full audio). Positive peaks correspond to time intervals that increase confidence in the correct classification, while negative values indicate segments whose removal improves performance (i.e., potentially misleading information).
The SK-TD (orange) curve shows pronounced peaks within the first 2 s, suggesting that early portions of speech may contain distinctive acoustic cues for neurotypical children. In contrast, the SK-ADHD (blue) curve exhibits a more fluctuating pattern, with both positive and negative contributions, pointing to more variable or inconsistent temporal markers. The SK-ASD (green) curve remains relatively flat, implying that classification for ASD in this setting is less dependent on specific short time intervals and may rely more on overall spectral or global temporal patterns.
Such analyses could be valuable for explainability in clinical contexts. By identifying the temporal segments that most influence the model’s decisions, clinicians can focus on specific moments in recordings for further examination.
5. Conclusions
This study evaluated the effectiveness of voice biomarkers and deep learning approaches for the classification of ASD, ADHD, and TD speech samples. Our experiments demonstrated that conventional classifiers, particularly SVMs, performed competitively when trained on carefully selected acoustic features, while the deep learning model achieved strong overall accuracy and class-specific performance. Frequency-band occlusion revealed unique spectral dependencies, with ASD samples showing greater reliance on the 2000–4000 Hz range, TD samples relying more on both low frequencies (100–300 Hz) and high frequencies (4000–8000 Hz), and ADHD samples depending primarily on mid-frequency bands. These findings indicate that spectral characteristics contain diagnostic cues that can be explored using more robust deep learning-based approaches. Future work will focus on validating these results with larger and more diverse datasets, and on exploring multimodal integration to develop robust, clinically applicable screening tools that could assist parents in the early diagnosis of their children.
Author Contributions
Conceptualization, G.R. and H.R.; methodology, G.R.; software, H.R.; validation, G.R. and H.R.; formal analysis, G.R.; investigation, H.R.; resources, G.R.; data curation, H.R.; original draft preparation, review and editing, G.R. and H.R.; visualization, H.R.; supervision, G.R.; project administration, G.R.; funding acquisition, G.R. All authors have read and agreed to the published version of the manuscript.
Funding
This work was supported by the ResearchNB Talent Recruitment Fund program, under Application No. TRF-0000000170, awarded to G.R.
Institutional Review Board Statement
Not applicable.
Informed Consent Statement
Not applicable.
Data Availability Statement
The data presented in this study are available at the following public domain resource: TalkBank CHILDES (Asymmetries Corpus), accessible at https://talkbank.org/childes/access/DutchAfrikaans/Asymmetries.html.
Conflicts of Interest
The authors declare no conflicts of interest.
References
- Rakotomanana, H.; Rouhafzay, G. A Scoping Review of AI-Based Approaches for Detecting Autism Traits Using Voice and Behavioral Data. Bioengineering 2025, 12, 1136. [Google Scholar] [CrossRef]
- Mohanta, A.; Mittal, V.K. Analysis and classification of speech sounds of children with autism spectrum disorder using acoustic features. Comput. Speech Lang. 2022, 72, 101287. [Google Scholar] [CrossRef]
- Jayasree, T.; Shia, S.E. Combined signal processing-based techniques and feed forward neural networks for pathological voice detection and classification. Sound Vib. 2021, 55, 141–161. [Google Scholar] [CrossRef]
- Asgari, M.; Chen, L.; Fombonne, E. Quantifying voice characteristics for detecting autism. Front. Psychol. 2021, 12, 665096. [Google Scholar] [CrossRef]
- Guo, C.; Chen, F.; Yan, J.; Gao, X.; Zhu, M. Atypical prosodic realization by Mandarin speaking autistic children: Evidence from tone sandhi and neutral tone. J. Commun. Disord. 2022, 100, 106280. [Google Scholar] [CrossRef]
- Guo, C.; Chen, F.; Chang, Y.; Yan, J. Applying Random Forest classification to diagnose autism using acoustical voice-quality parameters during lexical tone production. Biomed. Signal Process. Control 2022, 77, 103811. [Google Scholar] [CrossRef]
- Godel, M.; Robain, F.; Journal, F.; Kojovic, N.; Latreche, K.; Dehaene Lambertz, G.; Schaer, M. Prosodic signatures of ASD severity and developmental delay in preschoolers. NPJ Digit. Med. 2023, 6, 99. [Google Scholar] [CrossRef] [PubMed]
- Lau, J.C.Y.; Patel, S.; Kang, X.; Nayar, K.; Martin, G.E.; Choy, J.; Wong, P.C.M.; Losh, M. Cross linguistic patterns of speech prosodic differences in autism: A machine learning study. PLoS ONE 2022, 17, e0269637. [Google Scholar] [CrossRef] [PubMed]
- Ma, W.; Dai, X.; Zhang, H. Can natural speech prosody distinguish autism spectrum disorders? A meta-analysis. Behav. Sci. 2024, 14, 90. [Google Scholar] [CrossRef]
- Vacca, J.; Brondino, N.; Dell’Acqua, F.; Vizziello, A.; Savazzi, P. Automatic voice classification of autistic subjects. arXiv 2024, arXiv:2406.13470. [Google Scholar] [CrossRef]
- Briend, F.; David, C.; Silleresi, S.; Malvy, J.; Ferré, S.; Latinus, M. Voice acoustics allow classifying autism spectrum disorder with high accuracy. Transl. Psychiatry 2023, 13, 250. [Google Scholar] [CrossRef]
- Hendriks, P.; Koster, C.; Hoeks, J.C.J. Referential choice across the lifespan: Why children and elderly adults produce ambiguous pronouns. Lang. Cogn. Neurosci. 2014, 29, 391–407. [Google Scholar] [CrossRef]
- Kuijper, S.J.M.; Hartman, C.A.; Hendriks, P. Who is he? Children with ASD and ADHD take the listener into account in their production of ambiguous pronouns. PLoS ONE 2015, 10, e0132408. [Google Scholar] [CrossRef] [PubMed]
- MacWhinney, B. The CHILDES Project: Tools for Analyzing Talk, 3rd ed.; Lawrence Erlbaum Associates: Mahwah, NJ, USA, 2000; Available online: https://talkbank.org (accessed on 22 July 2025).
- Boersma, P.; Weenink, D. Praat: Doing Phonetics by Computer [Computer Program], Version 6.4; Carnegie Mellon University: Pittsburgh, PA, USA, 2024. Available online: https://www.praat.org/ (accessed on 18 July 2025).
- Burg, J.P. Maximum Entropy Spectral Analysis; Stanford Exploration Project: Stanford, CA, USA, 1975; Available online: https://sep.sites.stanford.edu/publications/theses/maximum-entropy-spectral-analysis-sep-6-1975 (accessed on 10 June 2025).
- Cortes, C.; Vapnik, V. Support-vector networks. Mach. Learn. 1995, 20, 273–297. [Google Scholar] [CrossRef]
- Cover, T.; Hart, P. Nearest neighbor pattern classification. IEEE Trans. Inf. Theory 1967, 13, 21–27. [Google Scholar] [CrossRef]
- Friedman, J.H. Greedy function approximation: A gradient boosting machine. Ann. Stat. 2001, 29, 1189–1232. [Google Scholar] [CrossRef]
- Freund, Y.; Schapire, R.E. A decision-theoretic generalization of on-line learning and an application to boosting. J. Comput. Syst. Sci. 1997, 55, 119–139. [Google Scholar] [CrossRef]
- Rumelhart, D.E.; Hinton, G.E.; Williams, R.J. Learning representations by back-propagating errors. Nature 1986, 323, 533–536. [Google Scholar] [CrossRef]
- Fisher, R.A. Statistical Methods for Research Workers; Oliver and Boyd: Edinburgh, UK, 1925. [Google Scholar]
- Cover, T.M.; Thomas, J.A. Elements of Information Theory, 2nd ed.; Wiley-Interscience: Hoboken, NJ, USA, 2006. [Google Scholar]
- Tibshirani, R. Regression shrinkage and selection via the Lasso. J. R. Stat. Soc. Ser. B Methodol. 1996, 58, 267–288. [Google Scholar] [CrossRef]
- Chen, S.; Wang, C.; Chen, Z.; Wu, Y.; Liu, S.; Chen, Z.; Li, J.; Kanda, N.; Yoshioka, T.; Xiao, X.; et al. WavLM: Large-scale self-supervised pre-training for full stack speech processing. IEEE J. Sel. Top. Signal Process. 2022, 16, 1505–1518. [Google Scholar] [CrossRef]
- Tilkorn, H.; Mittag, G.; Sebastian, M. Visualising and Explaining Deep Learning Models for Speech Quality Prediction. arXiv 2021, arXiv:2112.06219. [Google Scholar] [CrossRef]
Disclaimer/Publisher’s Note: The statements, opinions and data contained in all publications are solely those of the individual author(s) and contributor(s) and not of MDPI and/or the editor(s). MDPI and/or the editor(s) disclaim responsibility for any injury to people or property resulting from any ideas, methods, instructions or products referred to in the content. |
© 2025 by the authors. Licensee MDPI, Basel, Switzerland. This article is an open access article distributed under the terms and conditions of the Creative Commons Attribution (CC BY) license (https://creativecommons.org/licenses/by/4.0/).