Abstract
This study proposes a novel approach to monitoring the grinding wheel during the dressing operation by using acoustic emission (AE) signals and the statistical Counts method. AE signals were acquired during the dressing passes and processed in MATLAB®. The Counts matrices were segmented according to the grinding wheel rotation, and the metric termed z-ratio, which combines mean and standard deviation statistics, was calculated for each subwindow. The vectors were then filtered, normalized, and represented in polar coordinates. The results demonstrate the method’s ability to track the evolution of dressing and detect grinding wheel eccentricity, offering a promising tool for the indirect monitoring of the surface conditions of the grinding tool during the dressing operation of conventional grinding wheels.
1. Introduction
Grinding is one of the final stages in the machining chain and is essential for achieving an excellent surface finish on parts [1]. The tool used in this process is called a grinding wheel, and its function is to remove material in a controlled manner, ensuring the final quality of the workpiece. Over time, the grinding wheel loses its cutting ability due to the wear of its abrasive grains and the accumulation of chip and other substances in its pores, which compromises the efficiency of the process [2].
One of the main faults encountered is grinding wheel eccentricity, a condition in which the wheel’s axis of rotation does not coincide with its geometric center. This defect may result from manufacturing flaws or from irregular wear of the abrasive surface during grinding [3]. When the cutting surface is not in proper condition, it becomes necessary to perform an operation known as dressing. This operation employs a tool called a dresser to remove layers from the wheel’s topography, restoring the cutting ability of the grinding tool. Among the existing types of dressers, the single-point diamond dresser is considered the simplest technique and is often cited as one of the most effective for producing a sharp and suitable cutting surface for the grinding process [4].
The monitoring of the dressing operation is generally carried out in a subjective manner. Thus, the success of the operation depends on the operator’s skills, as they determine when to interrupt the process based on visual and auditory perceptions [5,6]. In this context, tool condition monitoring (TCM) is of great importance to ensure the reduction in material waste and the efficiency of the grinding process. TCM systems can be classified into two groups: (i) direct monitoring, in which the measured variable is observed directly with high precision, generally by means of laser sensors [7,8], and (ii) indirect monitoring, which relies on the empirical correlation between a variable measured during the process and the condition of the grinding wheel [8,9,10,11].
In 1984 and 1985, D. Dornfeld and G. Ca [12,13] were pioneers in employing the acoustic emission (AE) sensor as an indirect method for monitoring the grinding wheel during grinding and dressing processes. The main advantage of using these sensors is that the operating frequency of a conventional AE sensor is higher than the frequencies of the machine and the surrounding environment, resulting in lower noise levels in the collected signals [4,7]. Other advantages, such as the relatively low cost and ease of assembly, as noted by Aguiar et al. [14] and Marinescu et al. [4], are also relevant to the application of this device in the monitoring of machining processes. In recent decades, the AE sensor has been one of the most extensively investigated techniques for monitoring the grinding wheel, as evidenced by studies such as [2,6].
The Counts statistic, in particular, assists in characterizing the grinding wheel by counting peaks in acoustic signals, providing an indication of the dressing evolution. The Counts statistic has been applied to the analysis of AE signals, both in their raw form and after filtering within specific frequency bands, with the aim of assessing the condition of conventional grinding wheels [2] and CBN grinding wheels [15]. However, these studies did not evaluate the application of this statistic in time windows that correspond exactly to one full rotation of the grinding wheel.
Therefore, the aim of this study is to extract features from AE signals by applying the Counts statistic within time windows equivalent to one complete rotation, thereby enabling the correlation of the distribution of acoustic events throughout the rotation with the condition of the grinding wheel. This approach seeks to provide the operator with a more objective analysis of the process, visually indicating whether the grinding wheel exhibits faults such as eccentricity or if the tool has already been properly dressed.
2. Materials and Methods
This section presents the materials and methods employed in this study for conducting the dressing tests and performing digital signal processing.
2.1. Dressing Tests
The dressing tests were carried out on a RAPH 1055 surface grinding machine from Sulmecânica (Rio Grande do Sul, Brazil), equipped with a conventional aluminum oxide grinding wheel from NORTON (São Paulo, Brazil), model 38A.150.LVH, with dimensions of 324 × 25.4 × 127 mm, and a single-point diamond dresser manufactured using the Chemical Vapour Deposition (CVD) technique.
An acoustic emission (AE) sensor from Sensis (São Paulo, Brazil) was mounted on the dresser holder, and acoustic waves were collected during each dressing pass pass using a Yokogawa DL850 oscilloscope (São Paulo, Brazil) at a sampling frequency of 2 MHz. The DM42 amplifier module, also from Sensis, was used for signal conditioning and analog filtering through a low-pass filter set with a cutoff frequency of 400 kHz. Figure 1 illustrates the test bench used to perform the tests.
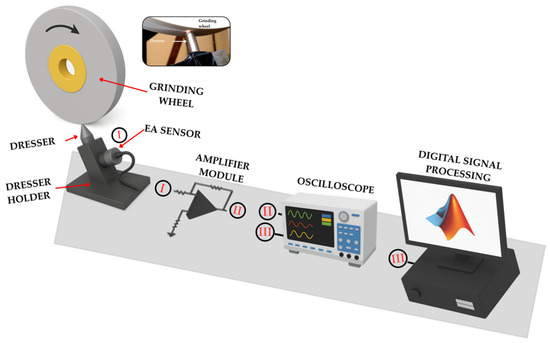
Figure 1.
Test bench setup.
Preliminary grinding and dressing tests were carried out with the aim of determining the optimal parameters to be applied in the final experiments. The dressing parameters include dressing depth , overlap ratio , and number of dressing passes . The parameters obtained are shown in Table 1.

Table 1.
Dressing parameters.
The process for introducing faults into the grinding wheel consisted of the unconventional grinding of the workpiece without the use of cutting fluid. Twenty passes of the grinding wheel were performed on the surface of the workpiece, an ABNT 1020 steel specimen measuring 150 × 48 × 12 mm. After this process, and now with the use of cutting fluid, the final dressing test was carried out, employing a dressing depth of 0.01 mm.
From the parameter, the dresser’s working width was measured using images captured by a brand digital microscope, model USB: DNT DigiMicro 2.0 Scale from DNT (Leer, Germany), equipped with a 2-megapixel (MP) camera. As a standardized procedure, the images were always taken from the same position, at approximately 8 mm from the tip of the dresser, which has a diameter of 10 mm.
The final test consisted of thirty-two (32) dressing passes to regularize the grinding wheel, i.e., upon contact with the dresser, thirty-two layers of abrasive material were removed from the grinding wheel’s cutting surface.
2.2. Digital Signal Processing
2.2.1. Original AE Signal
Digital signal processing was performed using Matlab® version R2024b. Initially, through a script, the data contained in the binary files corresponding to the acoustic signals collected by the oscilloscope during the dressing pass were converted into the double format, standard in MATLAB. Subsequently, for each pass, the portion of the signal corresponding to the dressing operation was extracted, since the original signal also includes noise regions at the beginning and end of the record. The AE signals corresponding to passes 1 and 30, as well as the noise regions and the 0.05 threshold used for the Counts statistic, are shown in Figure 2.
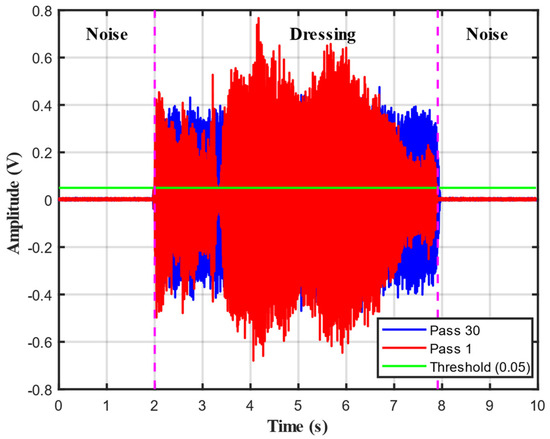
Figure 2.
Original acoustic emission signals and the threshold used.
2.2.2. Counts
The statistical Counts method records the number of times the acoustic emission (AE) signal exceeds a given threshold within a specific time period. Figure 3 illustrates this process, in which the acoustic signal is compared to the continuous threshold signal, and each time the AE signal surpasses this threshold, an event count is generated at the rising edge.
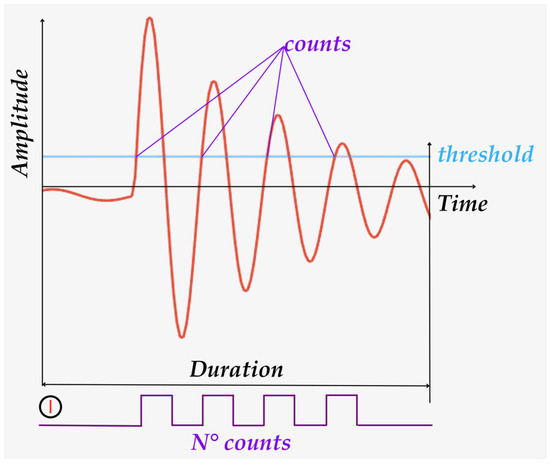
Figure 3.
Counts.
2.2.3. AE Signal Feature Extraction
Figure 4 illustrates the steps performed for extracting features from the AE signal.
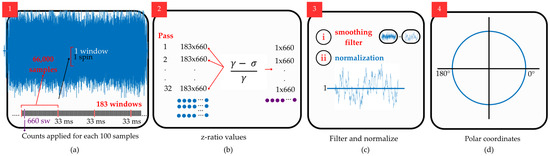
Figure 4.
Steps for extracting features from AE signals: (a) Counts; (b) z-ratio; (c) Filtering and normalization; and (d) Polar coordinates.
Step 1, illustrated in the first frame of Figure 4a, shows the windowing process for applying the Counts method. The objective was to observe the behavior of Counts during each rotation of the grinding wheel. To determine the time corresponding to one rotation, the grinding wheel speed parameter (), which is equal to 1800 RPM was used as a reference. Converting this value to revolutions per second yields 30 revolutions/s. Thus, the time associated with one rotation was 33 ms, which was adopted as the duration of each window.
The number of samples per window was determined by multiplying the sampling rate by the 33 ms time interval, resulting in 66,000 samples. The first window is formed from the first sample of the signal, and each subsequent window begins immediately after the end of the previous one, with no overlap between them. The total number of windows was determined by dividing the number of samples in the trimmed AE signal by the number of samples per window, resulting in 183 windows for each AE signal corresponding to a dressing pass. In each window, the Counts method was applied to blocks of 100 samples, yielding 660 subwindows per window.
For each pass, the Counts matrix resulting from the windowing process has dimensions of 183 × 660 and is composed of columns representing a fixed subwindow along the rotation, while each row represents a window, that is, one complete rotation of the grinding wheel. Step 2, shown in Figure 4b, illustrates the process of feature extraction from each resulting Counts matrix. In this stage, several statistical metrics were tested, such as the maximum value, mean, standard deviation, coefficient of variation, kurtosis, skewness, and median. During the tests, it was observed that none of these metrics, when considered individually, yielded satisfactory results in correlating with the condition of the grinding wheel’s cutting surface. Therefore, it became necessary to combine different statistics, which led to the use of a new metric, referred to by the authors of this study as the z-ratio, defined by Equation (1).
where γ is the mean and σ is the standard deviation calculated for each column across all windows. The result of this calculation for each pass was stored as a vector with dimensions , where represents the number of subwindows (660) per rotation.
After calculating the z-ratio, a moving average filter with a window size of 15 points was applied to smooth high-frequency fluctuations and highlight signal trends. Subsequently, each vector was normalized by its mean to standardize the scale across different passes. These steps are illustrated in Figure 4c. Finally, in the stage shown in Figure 4d, the normalized vectors were converted into polar coordinates, and plots were generated to visualize the evolution of the dressing operation and thereby identify the grinding wheel’s eccentricity fault.
3. Results and Discussion
The plots in Figure 5 present the results of the first three steps described in the previous section. Figure 5a displays the signals obtained after applying the z-ratio, calculated for each subwindow of the Counts matrices corresponding to passes 1, 5, 10, 20, and 30. Figure 5b shows the filtered vectors, and finally, Figure 5c presents the vectors after the normalization process, in which all signals were scaled to have a mean equal to 1.
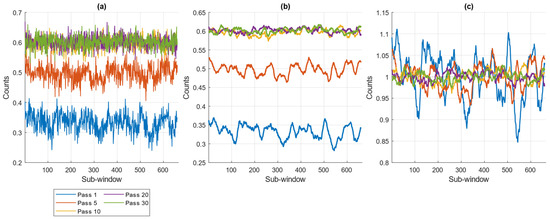
Figure 5.
Z-ratio applied to Counts: (a) Unfiltered signals; (b) Filtered signals; (c) Signal normalization.
By analyzing Figure 5a,b, an increase in signal amplitude can be observed throughout the progression of the dressing operation. In the initial passes, such as passes 1 and 5, the signals exhibit lower amplitude values, reflecting a grinding wheel condition considered faulty. As the dressing operation progresses, the contact between the dresser tip and the abrasive grains becomes more intense, and, as can be seen from pass 10 onward, there is a rise in amplitude values, followed by smaller variations in the subsequent passes, indicating that, at this stage, the grinding wheel was likely already dressed.
By associating the curves generated by the z-ratio during the dressing passes with the grinding wheel’s cutting surface, it was possible to identify the regions and moments in which the wheel exhibited wear in its abrasive layer, i.e., the points at which eccentricity was present. Figure 6 provides an alternative visualization of the results obtained in the fourth step of the method, in which the normalized signals were converted into polar coordinates. Analyzing the plot, it can be observed that the closer the curve is to the unit circle, the lower the grinding wheel’s eccentricity, as seen in passes 10, 20, and 30. Conversely, in passes 1 and 5, there is a significant deviation between the curves and the unit circle reference, indicating that, in these passes, the grinding wheel exhibited uneven wear in its abrasive layer, that is, eccentricity was present. This wear, even on a small scale, is sufficient to cause damage to the workpiece during finishing operations. Therefore, the use of the z-ratio applied to acoustic event counting, combined with polar analysis, proves to be a promising tool for monitoring dressing efficiency and detecting wear conditions on the abrasive surface.
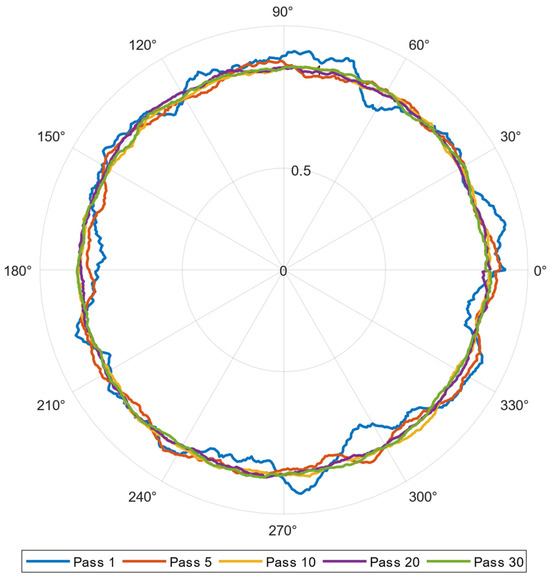
Figure 6.
Visualization in polar coordinates.
4. Conclusions
The present study introduced an innovative approach to using the Counts statistic for feature extraction from acoustic emission signals collected during the dressing operation of conventional grinding wheels. The application of the metric termed z-ratio, combined with filtering, normalization, and representation in polar coordinates, proved highly effective in correlating signal behavior with the condition of the abrasive surface, enabling an objective assessment of the dressing evolution.
The results obtained demonstrate that the proposed methodology is capable of clearly identifying the transition of the grinding wheel from a worn condition to a suitable cutting state, as well as detecting faults such as eccentricity. This diagnostic capability, achieved indirectly, provides technical support for the operator’s decision-making, reducing process subjectivity and increasing the efficiency and reliability of the grinding process.
The integration of the Counts statistic with polar analysis has also proven promising for the early detection of anomalies, which can contribute to reducing defects in workpieces and optimizing the grinding wheel’s service life. Considering the performance achieved, it is recommended for future work to expand the application of the method to different types of sensors, operational conditions, and grinding wheel geometries, as well as to integrate artificial intelligence techniques, such as artificial neural networks, for the automatic classification of tool conditions.
The conclusions presented are valid for the specific test conditions established in this study and may serve as a basis for further research and industrial applications in grinding process monitoring.
Author Contributions
Conceptualization, W.N.L.; methodology, M.H.P. and W.N.L.; software, M.H.P.; validation, W.N.L., B.O.F. and I.H.S.C.d.M.; investigation, M.H.P. and I.H.S.C.d.M.; data curation, W.N.L.; writing—original draft preparation, M.H.P.; writing—review and editing, M.H.P., W.N.L., B.O.F., I.H.S.C.d.M. and R.O.A.T.; supervision, W.N.L.; project and ministration, W.N.L. All authors have read and agreed to the published version of the manuscript.
Funding
This research was funded by Coordination for the Improvement of Higher Education Personnel—CAPES.
Institutional Review Board Statement
Not applicable.
Informed Consent Statement
Not applicable.
Data Availability Statement
The data presented in this study are not publicly available due to their confidential nature and ethical/proprietary restrictions related to the Abrasive Machining Research Group at São Paulo State University (UNESP). The data may, however, be made available upon reasonable request and justification to the corresponding author, M. H. Pereira.
Acknowledgments
The authors of this work express their gratitude to UNESP-Bauru and IFPR Campus Jacarezinho for their support of the research and for providing access to the laboratories used in its development. They also thank CAPES for the financial support granted to this research.
Conflicts of Interest
The authors declare no conflicts of interest.
References
- Jia, J.; Guo, B.; Krajnik, P.; Gu, Y.; Wu, G.; Yao, H.; Zhao, H.; Li, K.; Yang, W.; Zhao, Q. Applications of Acoustic Emission Monitoring in Grinding: A Review. Int. J. Precis. Eng. Manuf.-Green Technol. 2025, 12, 1893–1918. [Google Scholar] [CrossRef]
- Lopes, W.N.; Isaac Ferreira, F.; Aparecido Alexandre, F.; Santos Ribeiro, D.M.; Conceição Junior, P.D.O.; De Aguiar, P.R.; Bianchi, E.C. Digital Signal Processing of Acoustic Emission Signals Using Power Spectral Density and Counts Statistic Applied to Single-point Dressing Operation. IET Sci. Meas. Technol. 2017, 11, 631–636. [Google Scholar] [CrossRef]
- Lopes, W.N. Método de Detecção de Falhas em Rebolos de Óxido de Alumínio por Meio de Diafragma Piezelétrico e Técnicas de Processamento Digital de Sinais. Ph.D. Thesis, UNESP, Bauru, Brazil, 2020. (In Portuguese). [Google Scholar]
- Marinescu, I.D.; Hitchiner, M.P.; Uhlmann, E.; Rowe, W.B.; Inasaki, I. Handbook of Machining with Grinding Wheels; CRC Press: Boca Raton, FL, USA, 2016. [Google Scholar]
- Bhuiyan, M.S.; Choudhury, I. Review of Sensor Applications in Tool Condition Monitoring in Machining. Compr. Mater Process 2014, 13, 539–569. [Google Scholar]
- Moia, D.F.G.; Thomazella, I.H.; Aguiar, P.R.; Bianchi, E.C.; Martins, C.H.R.; Marchi, M. Tool Condition Monitoring of Aluminum Oxide Grinding Wheel in Dressing Operation Using Acoustic Emission and Neural Networks. J. Braz. Soc. Mech. Sci. Eng. 2015, 37, 627–640. [Google Scholar] [CrossRef]
- Nakai, M.E.; Aguiar, P.R.; Guillardi, H.; Bianchi, E.C.; Spatti, D.H.; D’Addona, D.M. Evaluation of Neural Models Applied to the Estimation of Tool Wear in the Grinding of Advanced Ceramics. Expert Syst. Appl. 2015, 42, 7026–7035. [Google Scholar] [CrossRef]
- Pimenov, D.Y.; Ribeiro Da Silva, L.R.; Kuntoğlu, M.; Abrão, B.S.; Dos Santos Paes, L.E.; Linul, E. Review of Advanced Sensor System Applications in Grinding Operations. J. Adv. Res. 2025, 77, 371–405. [Google Scholar] [CrossRef] [PubMed]
- Junior, P.; D’Addona, D.M.; Aguiar, P.R.; Teti, R. Dressing Tool Condition Monitoring through Impedance-Based Sensors: Part 1—PZT Diaphragm Transducer Response and EMI Sensing Technique. Sensors 2018, 18, 4455. [Google Scholar] [CrossRef] [PubMed]
- De Sousa, G.O.; Júnior, P.O.C.; Da Silva, I.N.; Brandão, D.; Dotto, F.R.L. Tool Wear Estimation in the Milling Process Using Backpropagation-Based Machine Learning Algorithm. In Proceedings of the 10th International Electronic Conference on Sensors and Applications ECSA 2023, Online, 15–30 November 2023; p. 39. [Google Scholar]
- Viera, M.A.A.; De Aguiar, P.R.; Junior, P.O.; Da Silva, R.B.; Jackson, M.J.; Alexandre, F.A.; Bianchi, E.C. Low-Cost Piezoelectric Transducer for Ceramic Grinding Monitoring. IEEE Sens. J. 2019, 19, 7605–7612. [Google Scholar] [CrossRef]
- Dornfeld, D.; Cai, H.G. An Investigation of Grinding and Wheel Loading Using Acoustic Emission. J. Eng. Ind. 1984, 106, 28–33. [Google Scholar] [CrossRef]
- Inasaki, I.; Okamura, K. Monitoring of Dressing and Grinding Processes with Acoustic Emission Signals. CIRP Ann. 1985, 34, 277–280. [Google Scholar] [CrossRef]
- Aguiar, P.R.; Souza, A.G.O.; Bianchi, E.C.; Leite, R.R.; Dotto, F.R.L. Monitoring the Dressing Operation in the Grinding Process. IJMMM 2009, 5, 3. [Google Scholar] [CrossRef]
- Alexandre, F.A.; Lopes, J.C.; De Martini Fernandes, L.; Ribeiro, F.S.F.; Fernandez, B.O.; De Angelo Sanchez, L.E.; De Oliveira, R.F.M.; De Mello, H.J.; Aguiar, P.R.; Bianchi, E.C. Depth of Dressing Optimization in CBN Wheels of Different Friabilities Using Acoustic Emission (AE) Technique. Int. J. Adv. Manuf. Technol. 2020, 106, 5225–5240. [Google Scholar] [CrossRef]


Disclaimer/Publisher’s Note: The statements, opinions and data contained in all publications are solely those of the individual author(s) and contributor(s) and not of MDPI and/or the editor(s). MDPI and/or the editor(s) disclaim responsibility for any injury to people or property resulting from any ideas, methods, instructions or products referred to in the content. |
© 2025 by the authors. Licensee MDPI, Basel, Switzerland. This article is an open access article distributed under the terms and conditions of the Creative Commons Attribution (CC BY) license (https://creativecommons.org/licenses/by/4.0/).