Abstract
To optimize operations and raise their performance, many industries have used the Theory of Constraints (TOC) methodology. The effective management of the constraints that prevent businesses from achieving their goals is described in the Theory of Constraints, which Goldratt developed in the 1980s. Increased restricted contribution margin, decreased inventory levels, and lower operating costs are the key points of the Theory of Constraints. Therefore, by effectively allocating enterprise resources, profitability can be increased. This study’s goal is to locate and eliminate the significant constraints standing in the way of a company’s accomplishment of their objectives, raising productivity and, consequently, firm profitability. A furniture company in the Maharashtra Region undertook the Theory of Constraints practice for this reason.
1. Introduction
In globally competitive markets, neither management accounting nor cost accounting, using conventional methods, is sufficient. Such a business climate forces businesses to use their assets more effectively in order to accomplish their primary goals, which include boosting profitability and value. To achieve these objectives, companies should utilize contemporary cost accounting and management techniques, as well as the Theory of Constraints (TOC). Goldratt’s management approach emphasizes identifying the system’s primary limitation (constraint) and enhancing it to achieve maximum overall performance. For 30 years, many public and private businesses that work in project management, manufacturing, logistics, supply, R&D, marketing, and other areas have used the TOC extensively. The TOC is extensively examined in standard sources from various nations.
The TOC aims to help organizations accomplish their goals by identifying and removing obstacles to optimal performance. The TOC emphasizes the importance of viewing the system as a whole and making decisions based on data to achieve continuous improvement. With the aid of the TOC, organizations can prioritize their efforts and achieve measurable performance improvements by concentrating on the most influential constraints. By focusing on the key constraints, organizations can achieve quantifiable improvements in efficiency, output, and effectiveness. Businesses can achieve continuous improvement, preserve a competitive edge, and align their operations with their objectives by using the TOC.
Last but not least, the TOC helps organizations use resources more efficiently, reduce waste, and improve overall performance. This study adds to our understanding of how the TOC is used in the furniture manufacturing industry, particularly for initiatives aimed at cutting costs, overcoming implementation difficulties, and reaping the rewards of the strategy. This study’s conclusions could potentially offer managers and industry professionals in the Indian auto sector useful information for implementing the TOC to increase operational performance and cut costs. Overall, the paper advances the knowledge of the TOC methodology’s potential applications in the manufacturing sector, particularly for cost-cutting initiatives, as well as how organizations can overcome implementation barriers and reap the benefits of the methodology. This study focuses on cost-cutting initiatives in particular, and how businesses can benefit from the strategy while overcoming implementation obstacles. This research paper contributes to advancing the understanding of the TOC as a continuous improvement methodology within the Indian furniture manufacturing industry. It investigates the key factors that influenced the selection of the TOC, the motivations driving its implementation, and the benefits it offers—particularly in reducing the costs associated with poor quality. This study includes a real-world case of a furniture manufacturing company that applied the TOC approach to a cost reduction project, resulting in a significant decrease in production costs and an improvement in overall profitability. Additionally, it highlights the challenges faced during the implementation process and provides practical recommendations for organizations considering the adoption of TOC-based strategies.
2. Literature Review
Organizations that have used the TOC have found it helpful in changing their performance. Azaria et al. [] conducted a study applying the Theory of Constraints (TOC) to the judicial system, aiming to develop an effective intervention to reduce court congestion. Their work was honored with the 2012 Goldratt Foundation New Knowledge Award. The study demonstrated that implementing the TOC in judicial processes led to a notable reduction in case lead times. Nagesh et al. [] presented a study on the implementation of the TOC in the Indian automotive industry. An Indian and Japanese company with offices in Pune, Mumbai, and Tokyo has established a CNC machine shop near Mumbai; overall, 87% of the production of this private limited company is devoted to the production of turned-finish automotive components. Consequently, the TOC is a successful methodology that decreases inventory by 50 to 70 percent and processes’ lead times by 30 to 45 percent. McCleskey et al. [] presented a literature review on the TOC. The theory was used to make decisions about product mix, supply chain management, accounting management, and production efficiency. It was noted that the TOC had an effect on the academy in the mentioned areas. Yassine et al. [] also applied the TOC. Streamlining the movement of goods through distribution systems will increase throughput, decrease inventory, and generate revenue. Shashi et al. [] presented a case study on the management of a pharmaceutical company’s sustainable digitalized supply chain. In order to improve sustainability and profitability, this qualitative multiple case study sought to explore the methods pharmaceutical managers employ to digitally integrate supply chain systems. As a result of the research, a system model was created. Rachel et al. [] conducted a study utilizing the Theory of Constraints (TOC) to explore challenges within the renewable energy supply chain. Employing a three-phase research approach, the study investigates the various risks and barriers that discourage businesses from investing in or entering the renewable energy sector. Through survey data and focus group discussions, these barriers are analyzed and classified as “system constraints”. The researchers then construct a Current Reality Tree (CRT) to map out these constraints, offering a comprehensive overview of the sector’s limitations. The CRT effectively reveals the complex network of issues acting as significant deterrents to participation in the renewable energy supply chain. Zhao et al. [] presented a paper on the use of the Theory of Constraints in the management of the tourism supply chain. By incorporating systems thinking and the Theory of Constraints (TOC) into the management of the tourism supply chain, this research adds to the literature. It is suggested that the coordination of business activities is the main challenge in managing the tourism supply chain, and that the TOC and systems thinking can effectively support the coordination of the various links and processes in the supply chain. According to the research’s findings, the TOC principles can be a very effective method for streamlining the management of the tourism supply chain. Wiesław et al. [] presented a detailed literature review on the Theory of Constraints. Four full-text databases from EBSCO, Emerald, Science Direct, and Springer Link were used for the bibliometric analysis, which covered the years 2013–2017. The articles that were analyzed were divided into four research perspectives: the TOC’s practical application, integrating the study area with Lean Manufacturing tools, transforming (improving) TOC tools, and suggestions for new instruments. According to the findings of the literature reviews, a wide range of Theory of Constraints-related research has been conducted, reflecting the expanding potential of the research topic. Ercüment et al. [] applied the Theory of Constraints in the furniture sector to achieve an optimal product mix. By defining the constraints that prevent them from achieving their targets, the study aims to provide effectively managed constraints, which, in turn, will raise firm profitability. To achieve this, a furniture company operating in the Mediterranean Region undertook the Theory of Constraints practice. As a result, it was determined that the company has capacity constraints, and that after the constraint is removed, profitability is expected to increase by 42%. Lusine et al. [] presented a case study for evaluating the conceptual framework in the agri-food supply chain. Their study aims to assess the applicability of a brand new conceptual model for supply chain performance evaluation in an agri-food supply chain. The effectiveness of the tomato supply chain can be measured using the conceptual framework that has been proposed. The case study’s findings led to the conclusion that the tomato supply chain performance measurement system’s key performance components fall into four main categories of performance measures: efficiency, flexibility, responsiveness, and food quality. The analysis of the literature by Goldratt on the Theory of Constraints has made it possible to spot new research trends and determine the direction of future studies [,]. The articles that were analyzed were divided into four research perspectives: the TOC’s practical application, integrating the study area with Lean Manufacturing tools, transforming (improving) TOC tools, and suggestions for new instruments. According to the findings of the literature reviews, a wide range of Theory of Constraints-related research has been conducted, reflecting the expanding potential of the research topic. Future applications of the Theory of Constraints will benefit from the addition of the defined research directions. Knop et al. [] applied the Theory of Constraints (TOC) and its Thinking Process Tools (TPTs) to detect, evaluate, and remove production bottlenecks in a machinery manufacturing firm specializing in bearing cage production. Vanomy et al. [] successfully implemented the TOC and its application to the VAF photo frame production industry for cost saving and eliminating non-value-added activity. Pereira et al. [] implemented TOC principles in a digital twin framework built in AnyLogic to replicate and simulate the manufacturing process. Mabin et al. [] demonstrate the framework’s effectiveness, highlighting how the tools complement each other and revealing that combining Qual SD with TOC yields richer insights than using either method in isolation. Gupta et al. [] successfully integrated the TOC, Lean, and Six Sigma (TLS) framework to increase the TLS orientation of a firm.
3. TOC in the Furniture Manufacturing
3.1. Introducing the Firm
The organization under study is engaged in the production of a wide range of modular furniture, including kitchen and bedroom units. Plywood is the primary raw material used in the manufacturing process. The plywood sheets are initially cut into various sizes and sent for routing, which is performed using four CNC machines at Space Wood. After routing, the panels move to the sanding and cleaning section, where they are treated with sandpaper and cleaned to prepare for further processing. Next, the panels are transferred to the gluing section, where adhesive is applied in preparation for foil application using a specialized foiling machine. Once this step is completed, quality control checks are carried out to ensure that the panels meet the required standards. The final stage involves the assembly of the panels to produce the finished furniture products.
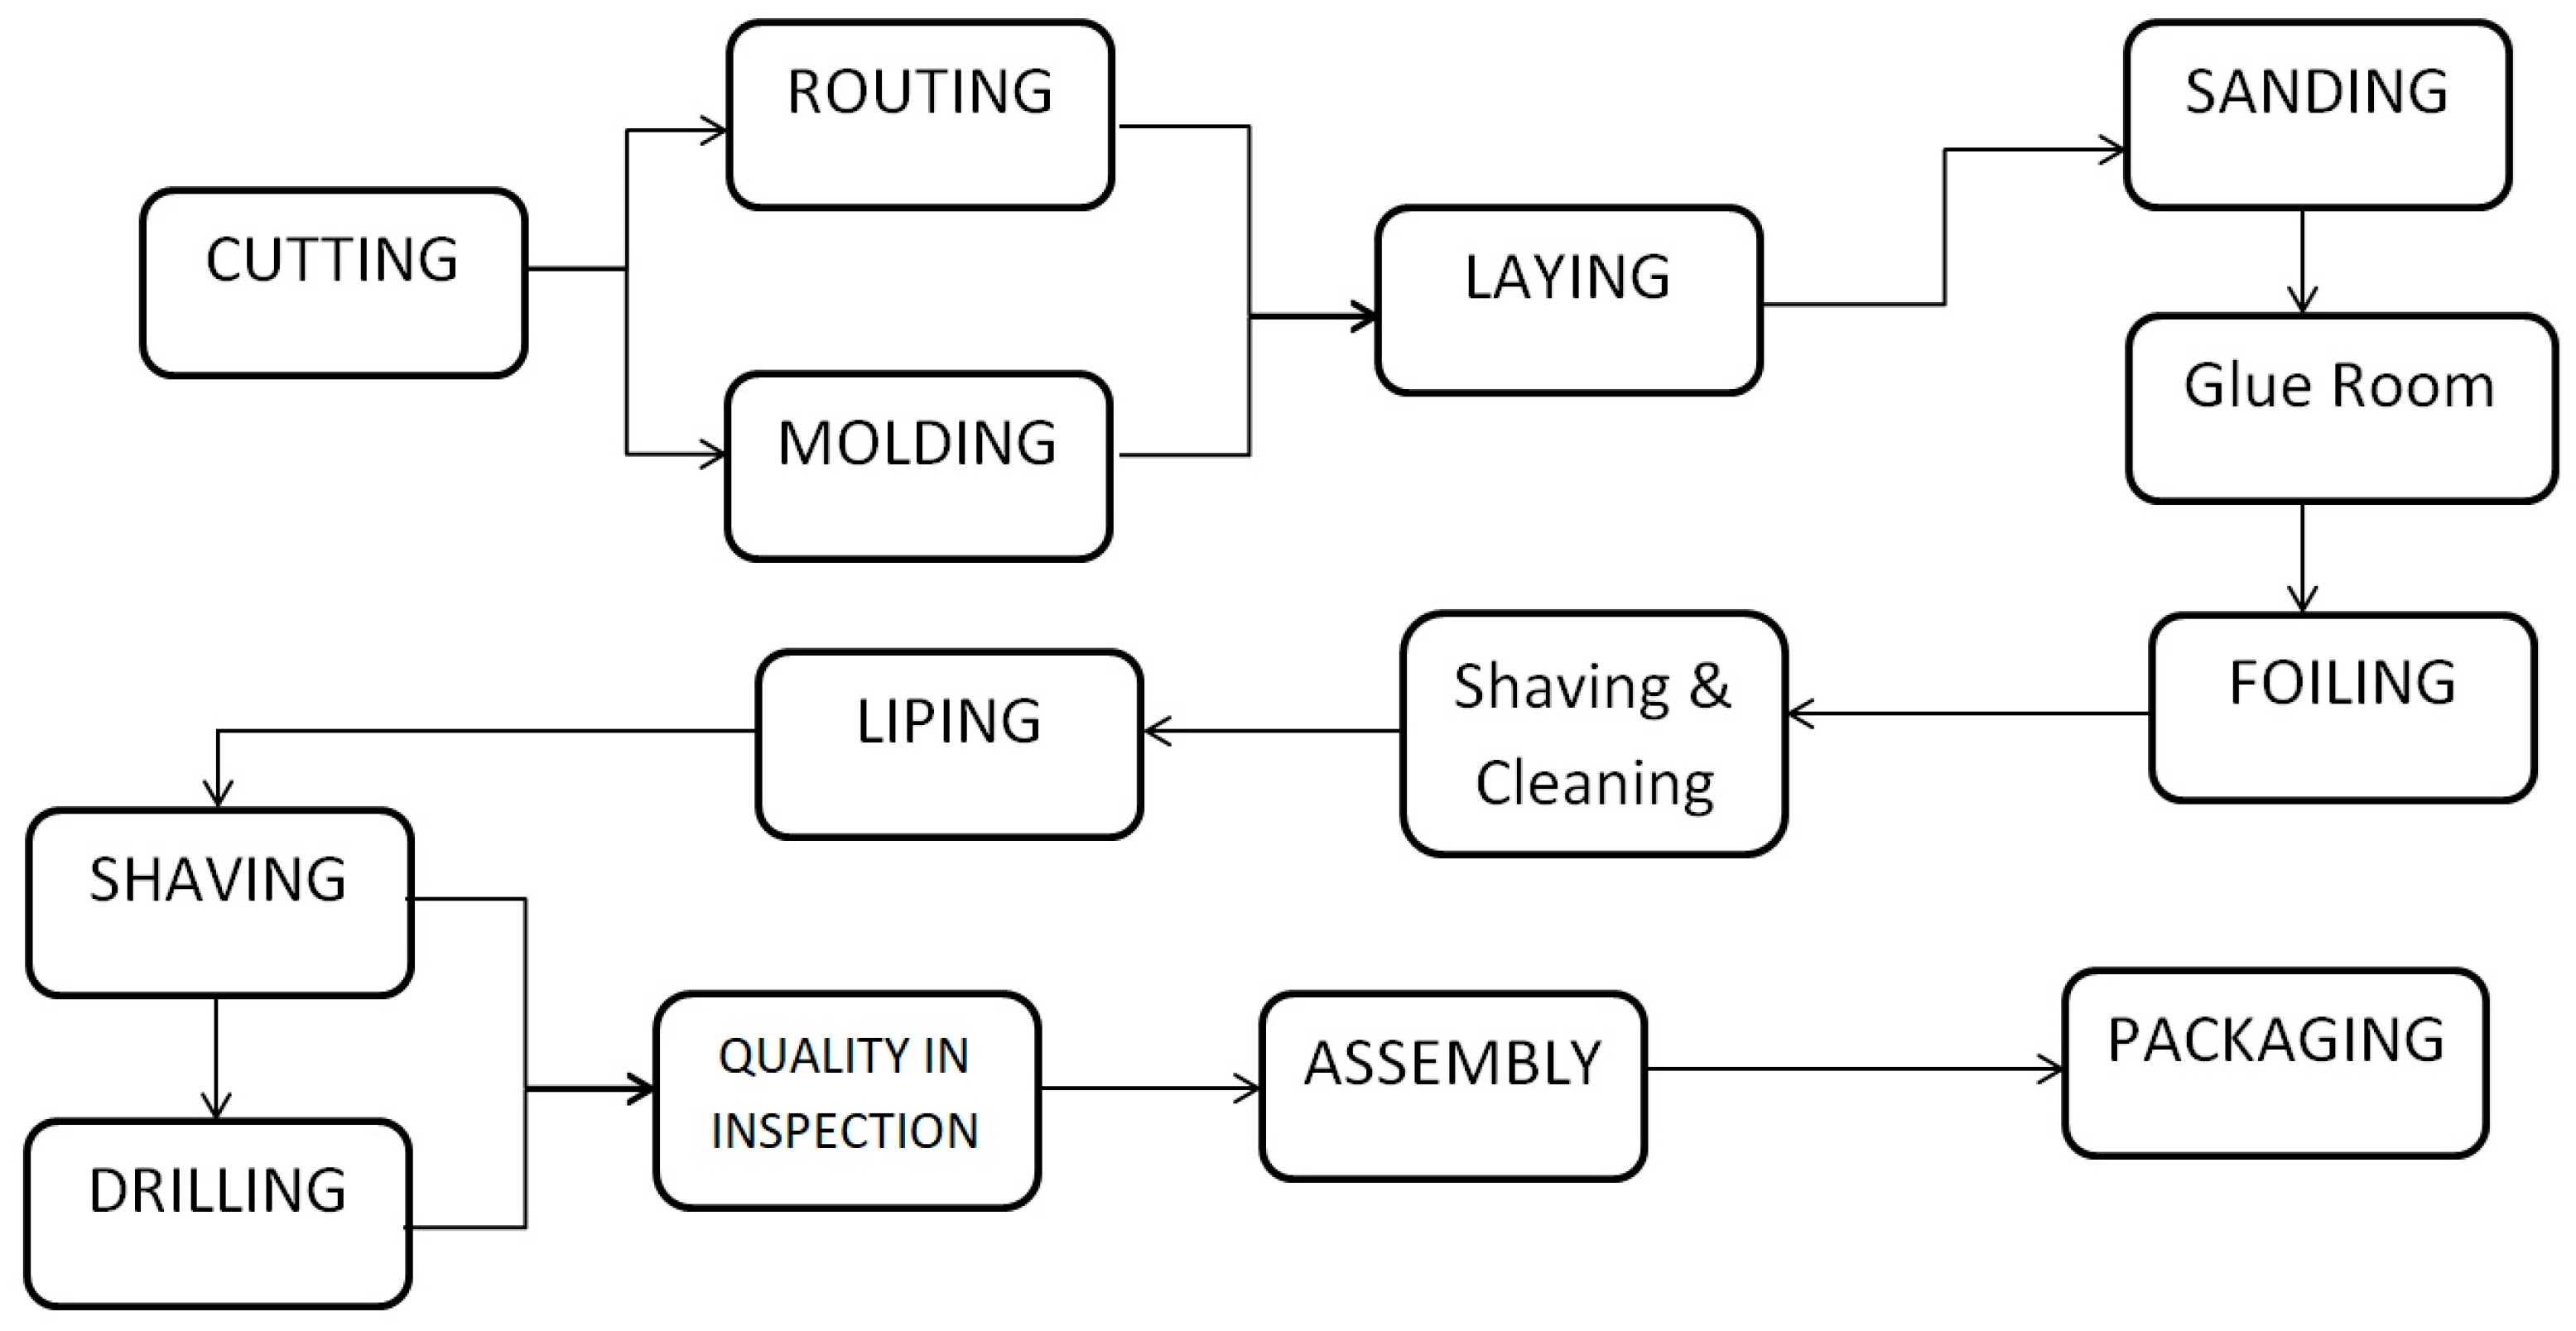
The company follows a systematic workflow in its operations. The process begins when a customer submits an inquiry to the sales department. Upon receiving the inquiry, a quotation is prepared and sent to the customer. If the customer accepts the offer, a purchase order is issued. This order is then sent to the design department for detailed drawings, while a copy is also forwarded to the planning department for project scheduling. Simultaneously, the manufacturing team receives both the production plan and design specifications to begin fabrication. After the furniture is produced, it undergoes inspection before being packed and shipped to the customer. Figure 1 illustrates the production process and its operational workflow.
Figure 1.
Process Diagram–Production.
The process proceeds through the following steps: cutting the material, routing, molding (molder), laying, sending, glue room (with a 15 to 20 min usage time), foiling on a foil machine, shaving, inspection (quality department), packing, and dispatch.
3.2. Identifying the Constraints
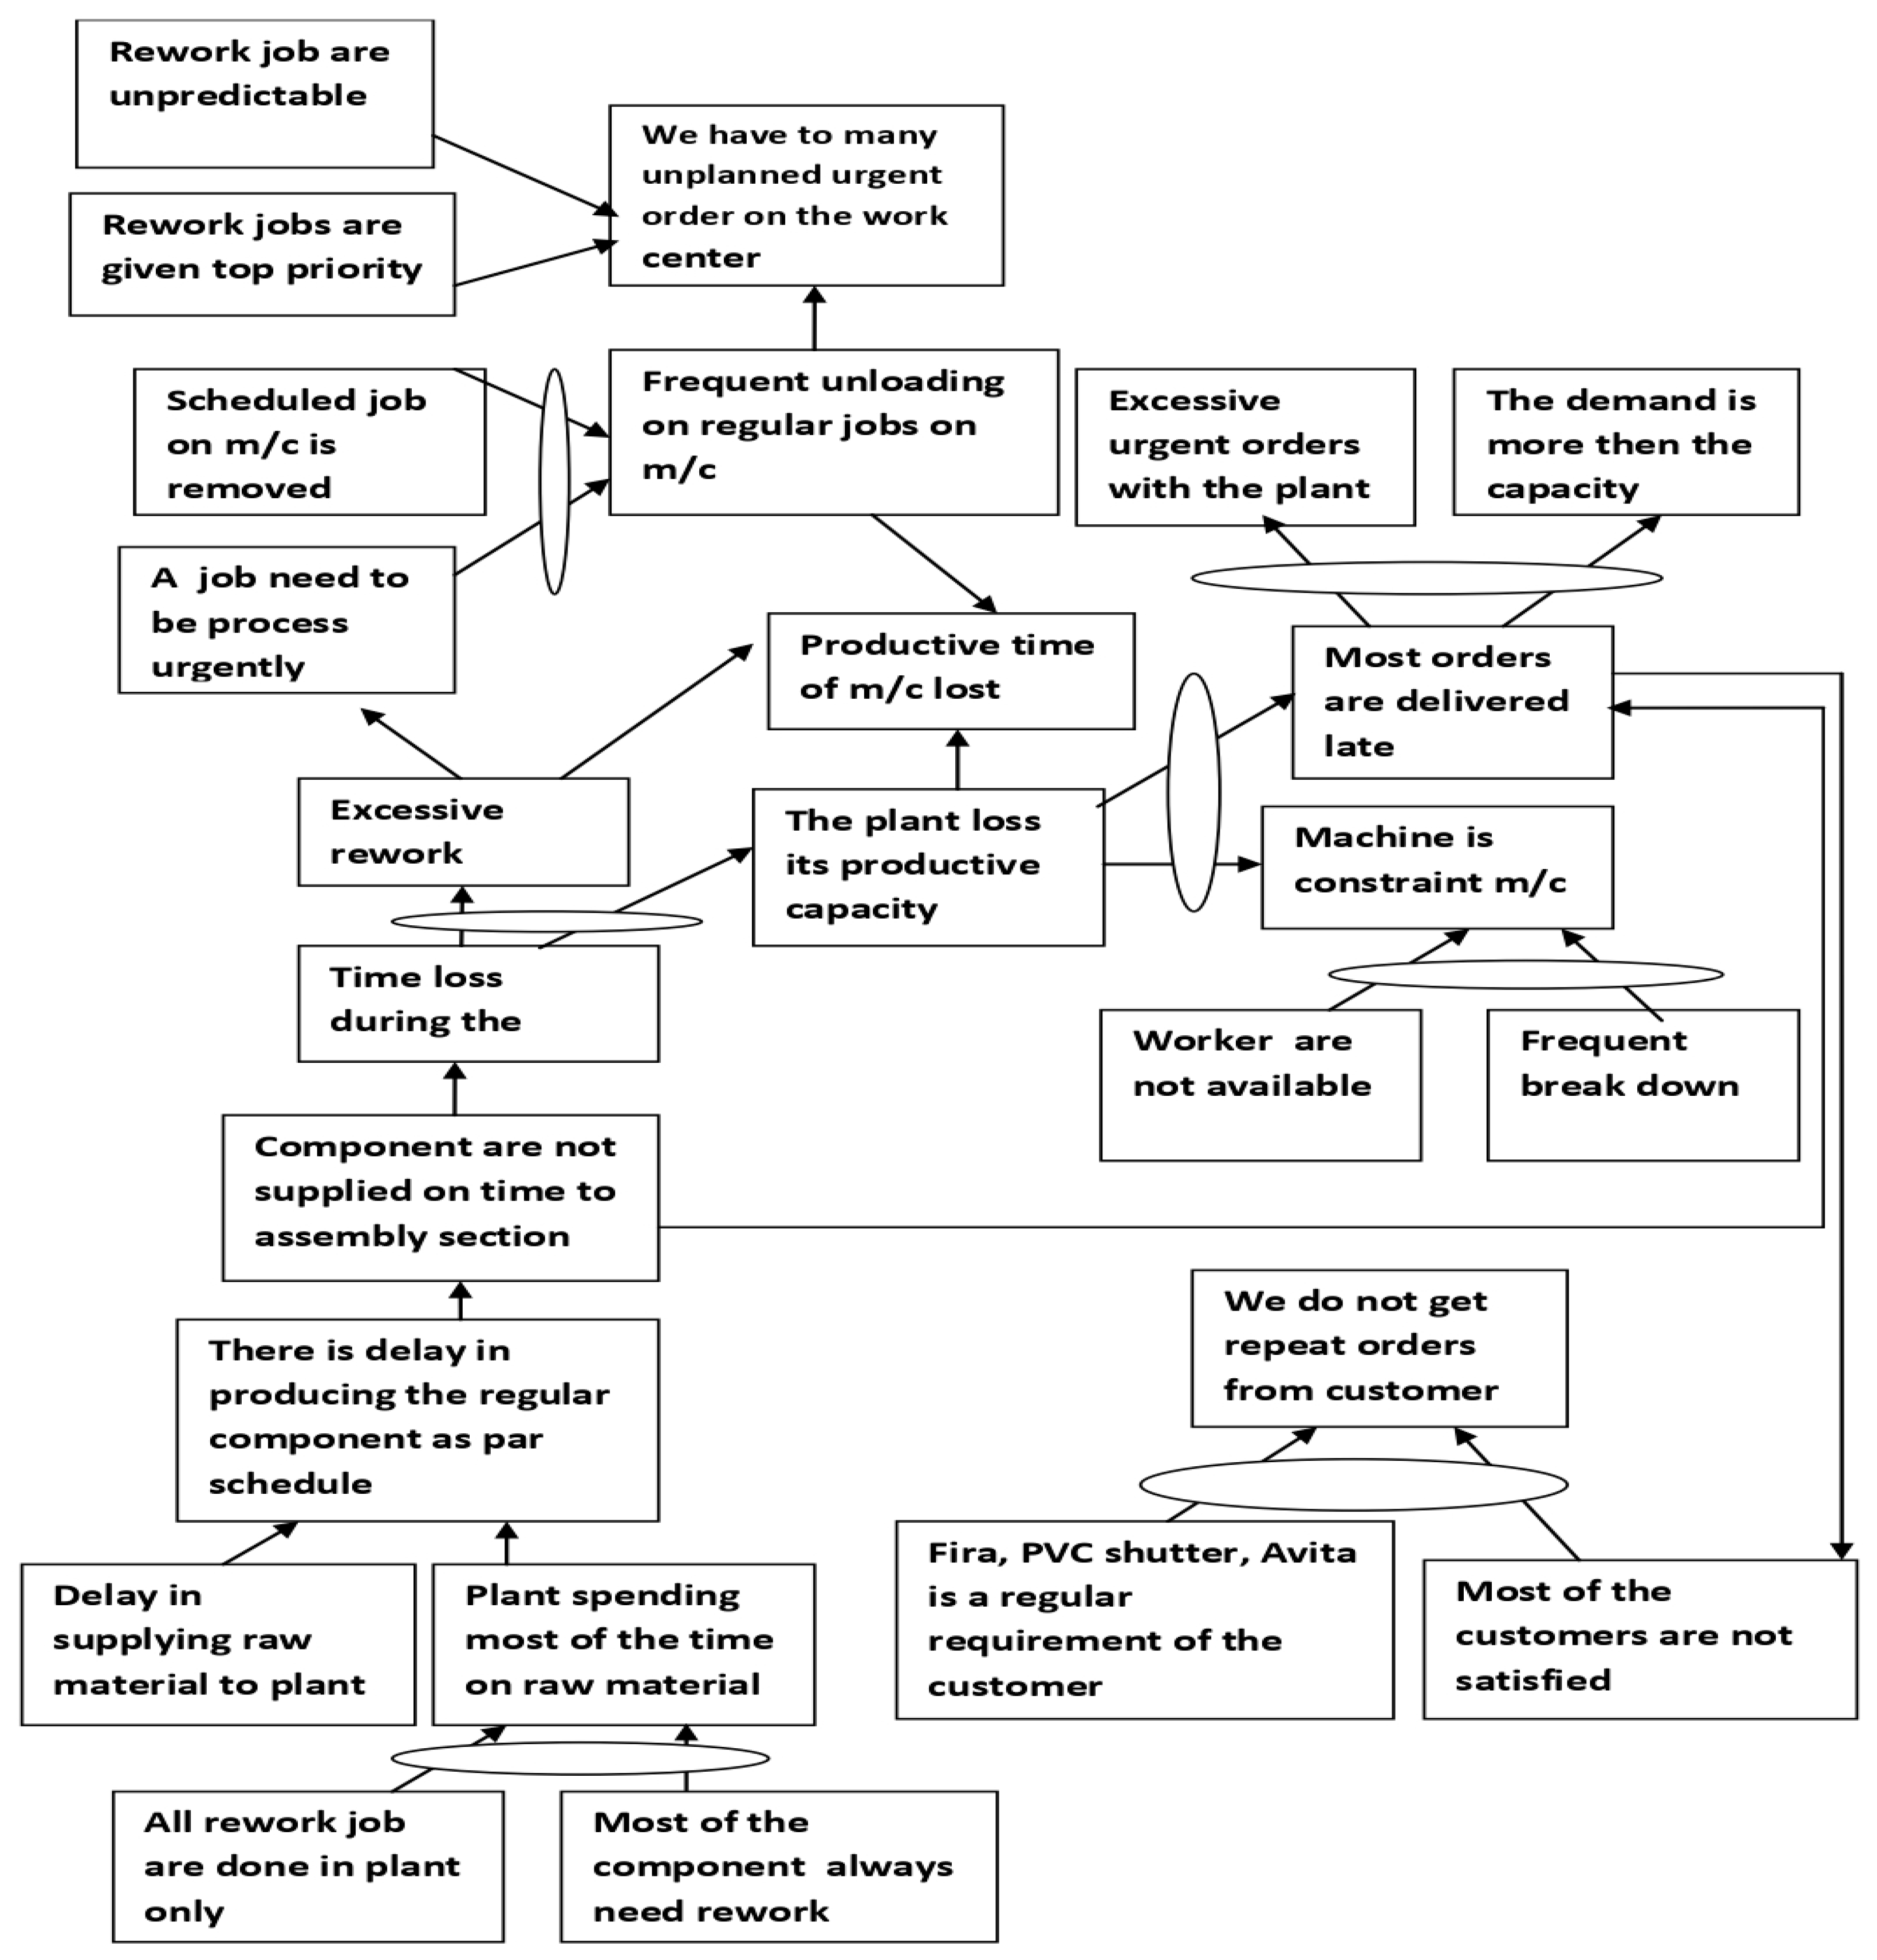
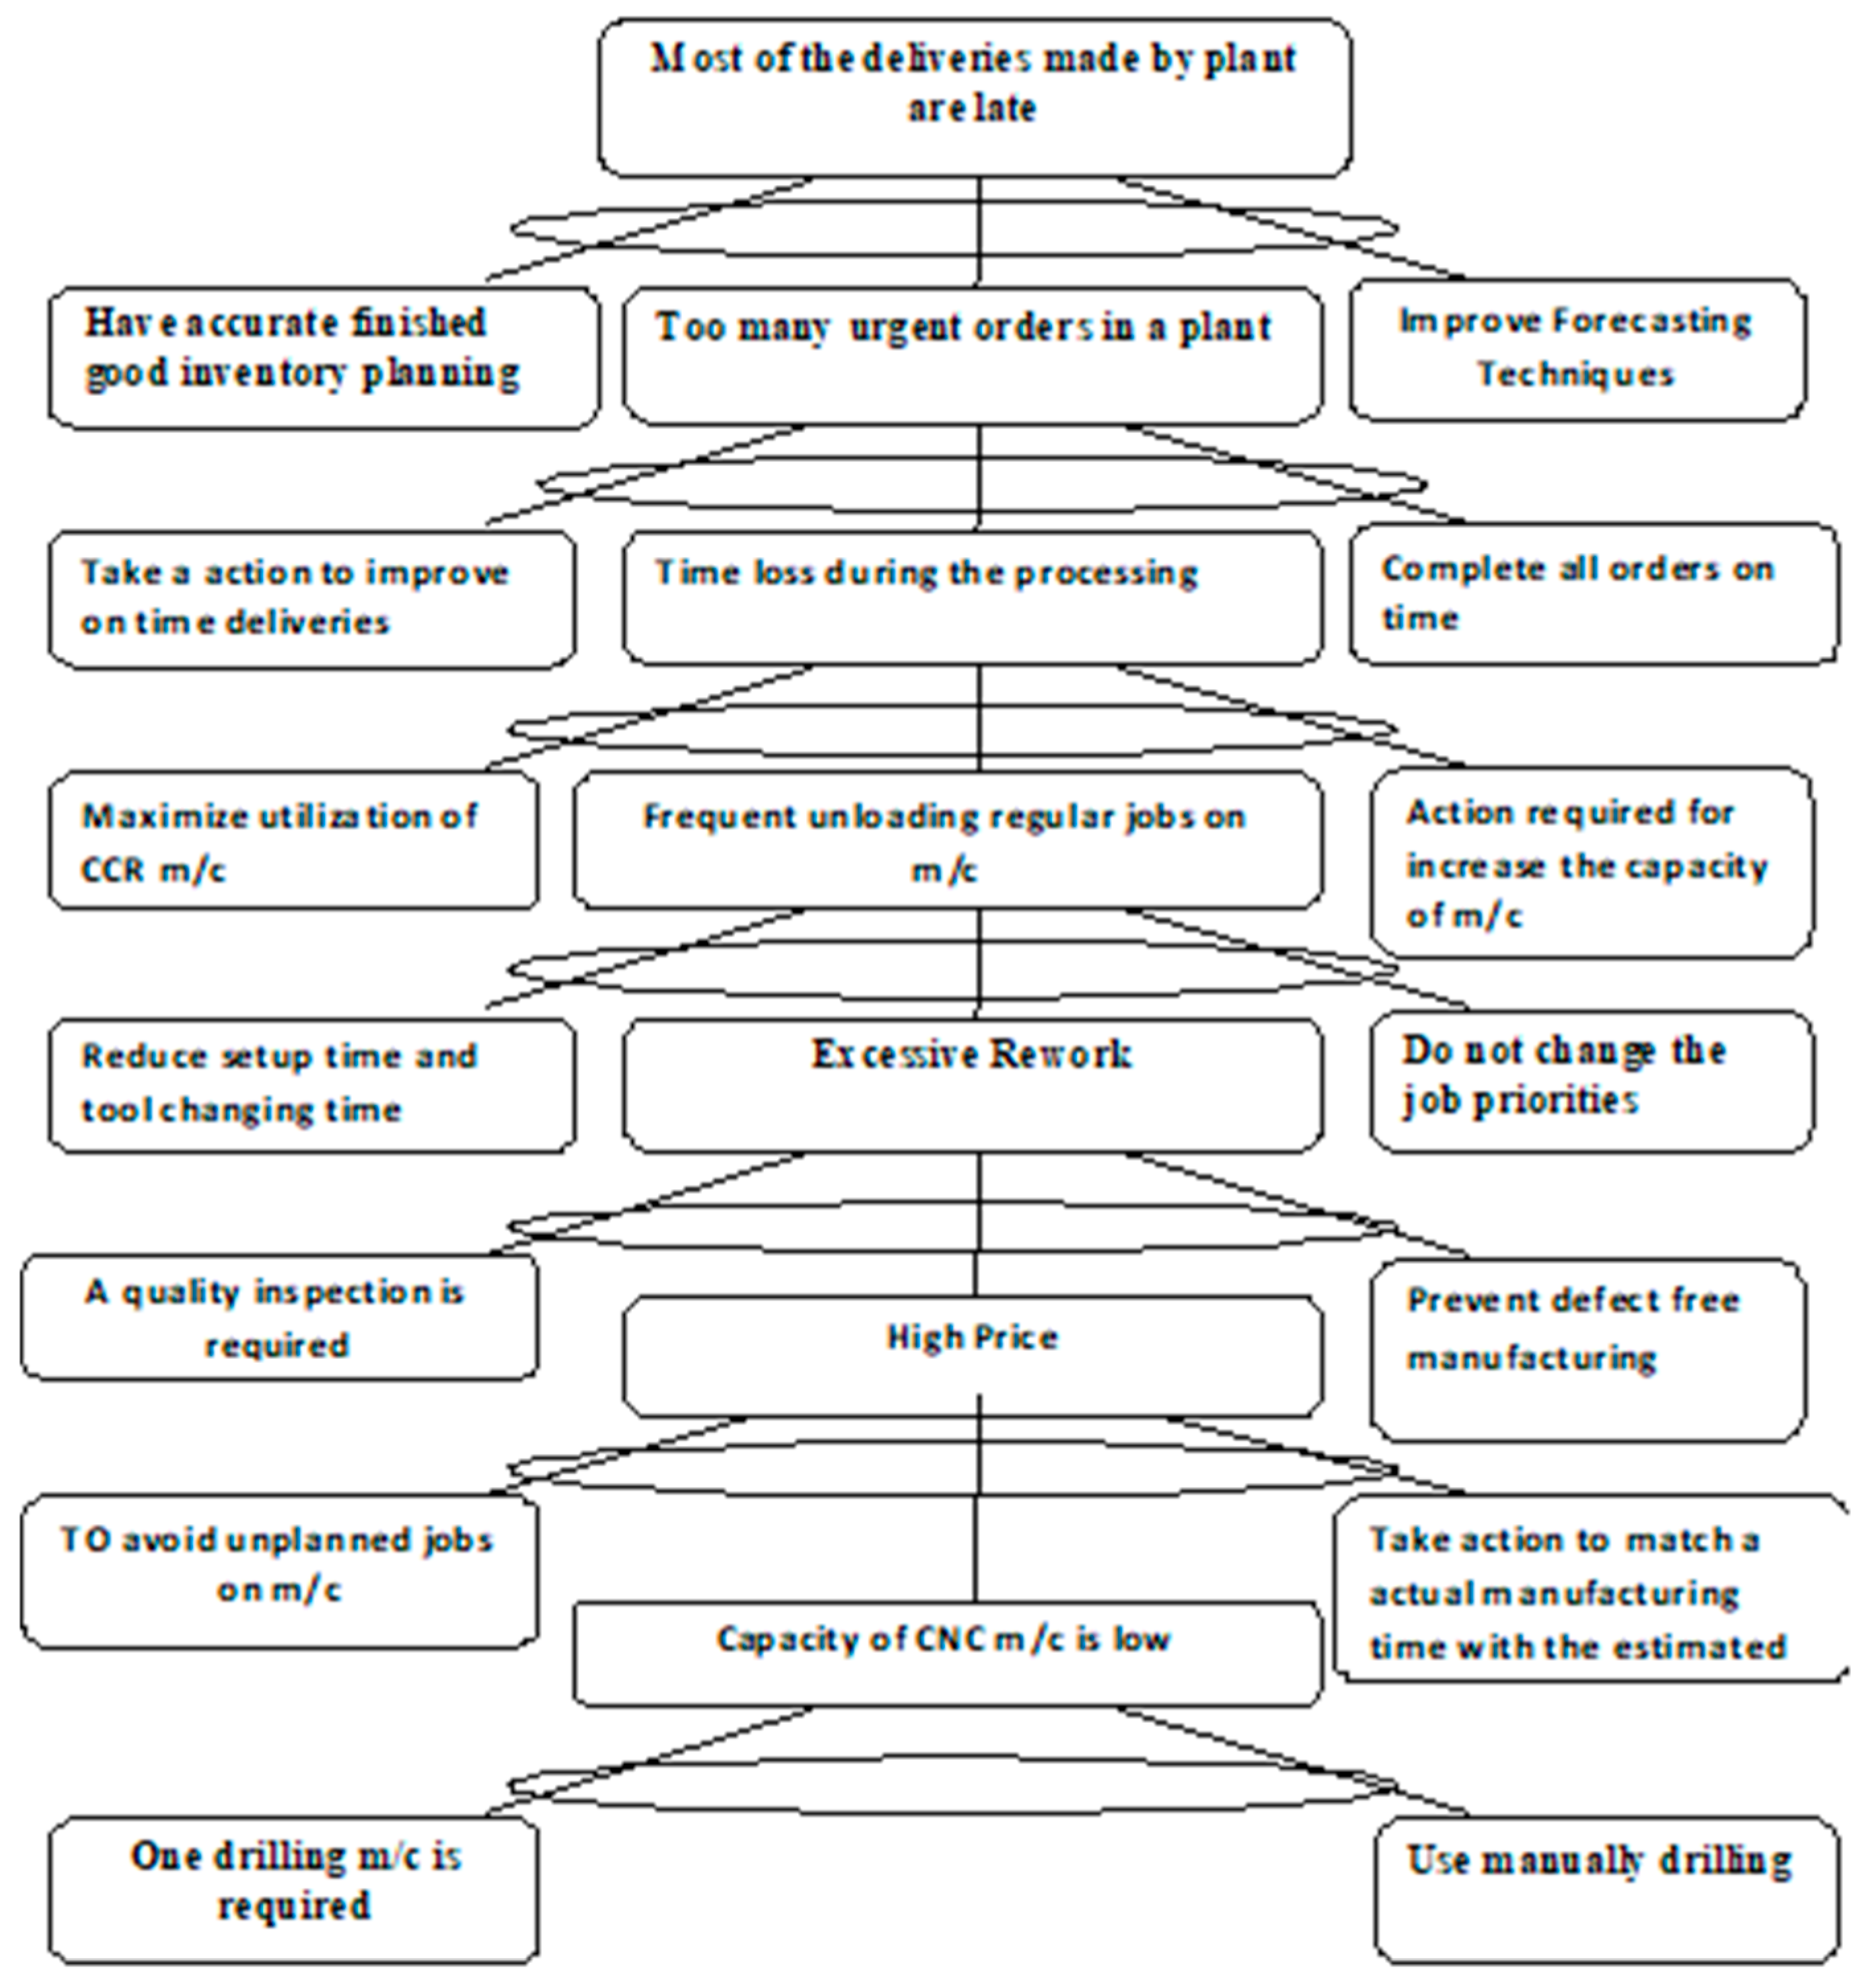
During this stage, one needs to identify the constraint in the manufacturing line. Any machine can become a constraint because of its mechanical problems or organizational policies. At the time of installation, the plant capacity was theoretically balanced. Constraints are identified through the analysis of machine downtime, rework, and scheduling issues. Undesirable Effects (UDEs) are outcomes that negatively impact organizational goals, identified as part of the TOC analysis. Late deliveries, frequent job unloading, excessive rework, and worker unavailability were observed. These UDEs were structured using a Current Reality Tree (CRT) to identify the core problem. A diagnostic tool was used based on the TOC to map cause–effect relationships between UDEs to identify the core problem and to seek causal relationships between these UDEs and possible causes. The CRT based on UDEs is shown in Figure 2. Data were collected through the direct observation of production processes at the case study company, combined with system data analysis of CNC machine logs, production schedules, and output records. Additionally, informal interviews with plant operators and supervisors were conducted to validate observed bottlenecks and contextualize system data. This triangulated approach (observation + system data analysis + informal interviews) ensured the reliability and accuracy of the findings.
Figure 2.
Current Reality Tree of Space Wood.
The Current Reality Tree (CRT) revealed that excessive rework, rescheduling, and workforce shortages collectively caused machine downtime and late deliveries (Figure 2). CNC-3 was identified as the core constraint.
The next stage is to develop the breakthrough solution to the core problem of the organization. Once the constrained resource is identified, the next step is to exploit it, i.e., extract from that constraint as much as you can. This is similar to strengthening the weakest link in a chain. Any gain or loss in CNC-3 capacity directly translates into equal changes in plant throughput, highlighting the need for maximizing CNC-3 productivity.
We can exploit the constraint by drawing a Core Reality Tree with a suggested solution for the various reasons why a CNC-3 machine loses its production. At the time of exploiting the constraint machine, one should study all factors that increase the productive time of the machine, thereby enhancing the productivity of both the constraint machine and the plant without requiring any major investment. We can conclude that a rise in the productive capacity of the constraint machine results in an im-mediate rise in the plant capacity by the same amount. Similarly, the loss of the productive capacity of the constraint machine is the loss of the plant by the same amount. By this principle, the second step of the methodology focuses on optimizing the productivity of the constraint resource. It does not consider any other machine for productivity enhancement.
3.3. Protecting Constraint Capacity
Protecting constraints by drawing a conflict resolution diagram and using the three-cloud method of TOC.
3.3.1. Conflict Resolution Diagram
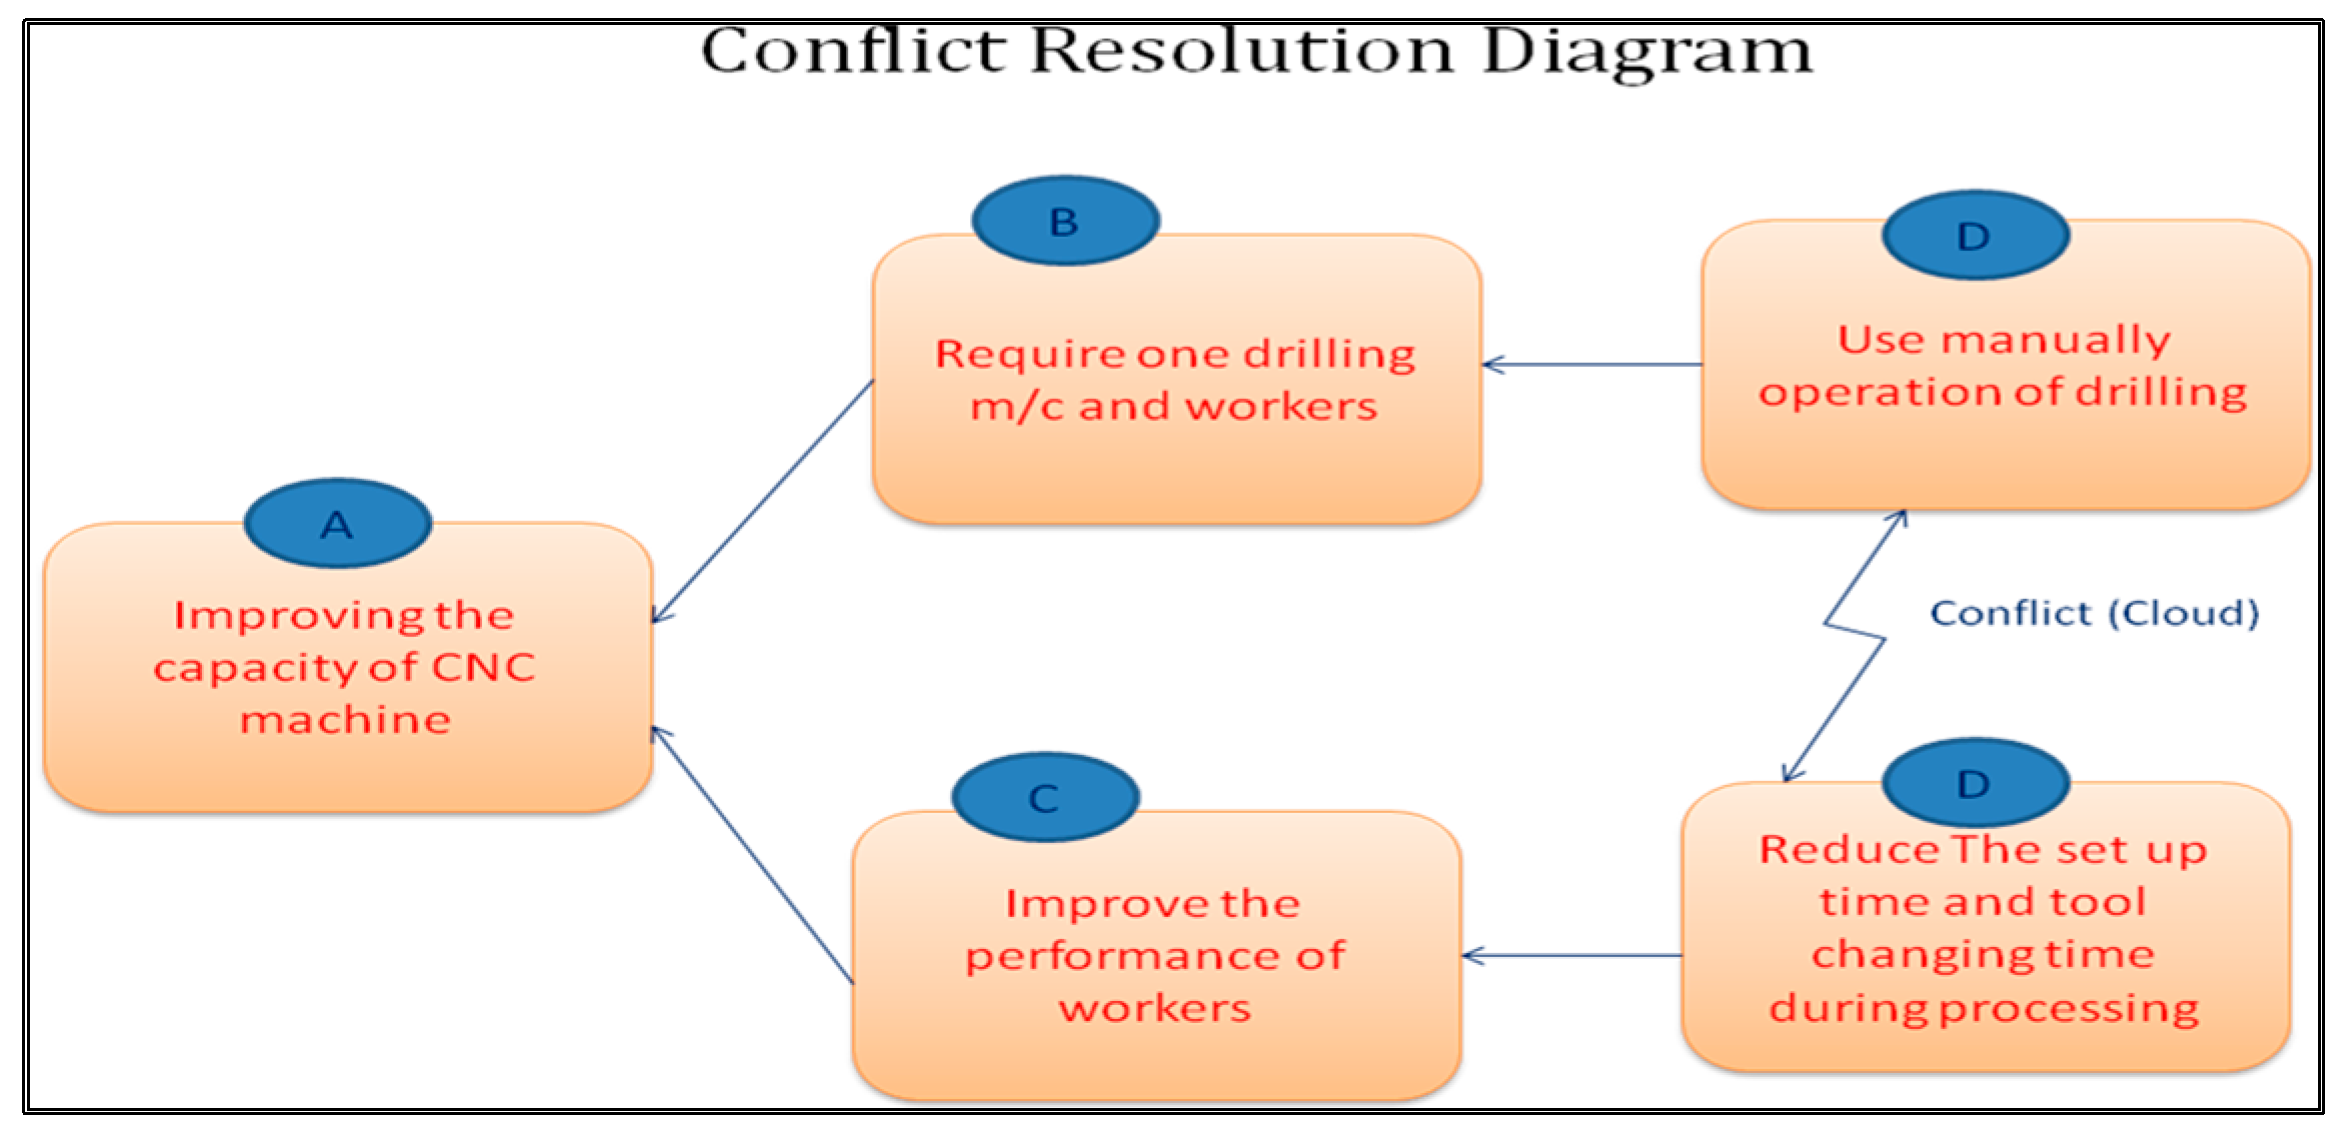
The CNC-3 bottleneck caused differing opinions on solutions (manual drilling vs. reduced setup times). A conflict resolution diagram was prepared to balance these views. Similarly, the “Clouds” for late deliveries and high prices are described repetitively. Instead of repeating full narratives, these can be summarized as follows: → The evaporating cloud analysis indicated that consistent scheduling and aligning actual vs. estimated processing times were critical actions to resolve delivery delays and cost issues. So, the conflict resolution diagram is prepared to resolve the conflict between the two diverse views.
- View 1: Use the manual operation of drilling
- View 2: Reduce setup time and tool changing time during processing.
Figure 3 illustrates the conflict diagram between the two opinions. For improving the performance of the CNC machine, the two opinions are “use manual operation of drilling” and “reduce the setup time and tool changing time during processing.
Figure 3.
Conflict Resolution Diagram.
It reads as follows: If the capacity of the CNC machine is improved (A), then one drilling machine and one worker (B) are required. If a drilling machine and worker are required (B), then use a manual drilling operation (D). If the capacity of the CNC machine is improved (A), then there should be a need to improve the performance of the worker (B). If the worker’s performance improves (C), then reduce the setup time and tool changing time during processing (D).
The graphical representation of the above conflict is shown in Figure 3 Some questions are “why do we tolerate the action stated in block D (reduce setup time and tool changing time during processing)?”. The answer to this question will give us the statement for block B. The answer has a certain underlying assumption behind tolerating the action in block D or D’. Here, the answer to the question “why do need to use manual drilling to solve the core problem of the organization?” can be written as
- “The other problem exists due to this core problem”.
- “Solving this single problem will reduce the overall time”.
The business has to be profitable, and then action must be taken to eliminate all the UDEs of the organization. However, after verifying the validity of this assumption, it is found to be entirely incorrect when applying the analogy of chain strength. Hence, this side of the conflict resolution diagram, i.e., A-C-D, is wrong and cannot be accepted as a solution. The final solution accepted is the chain of A-B-D.
3.3.2. Cloud for the UDEs: Late Deliveries of Most Orders
Most work centers are overloaded, and critical pending jobs need to be processed.
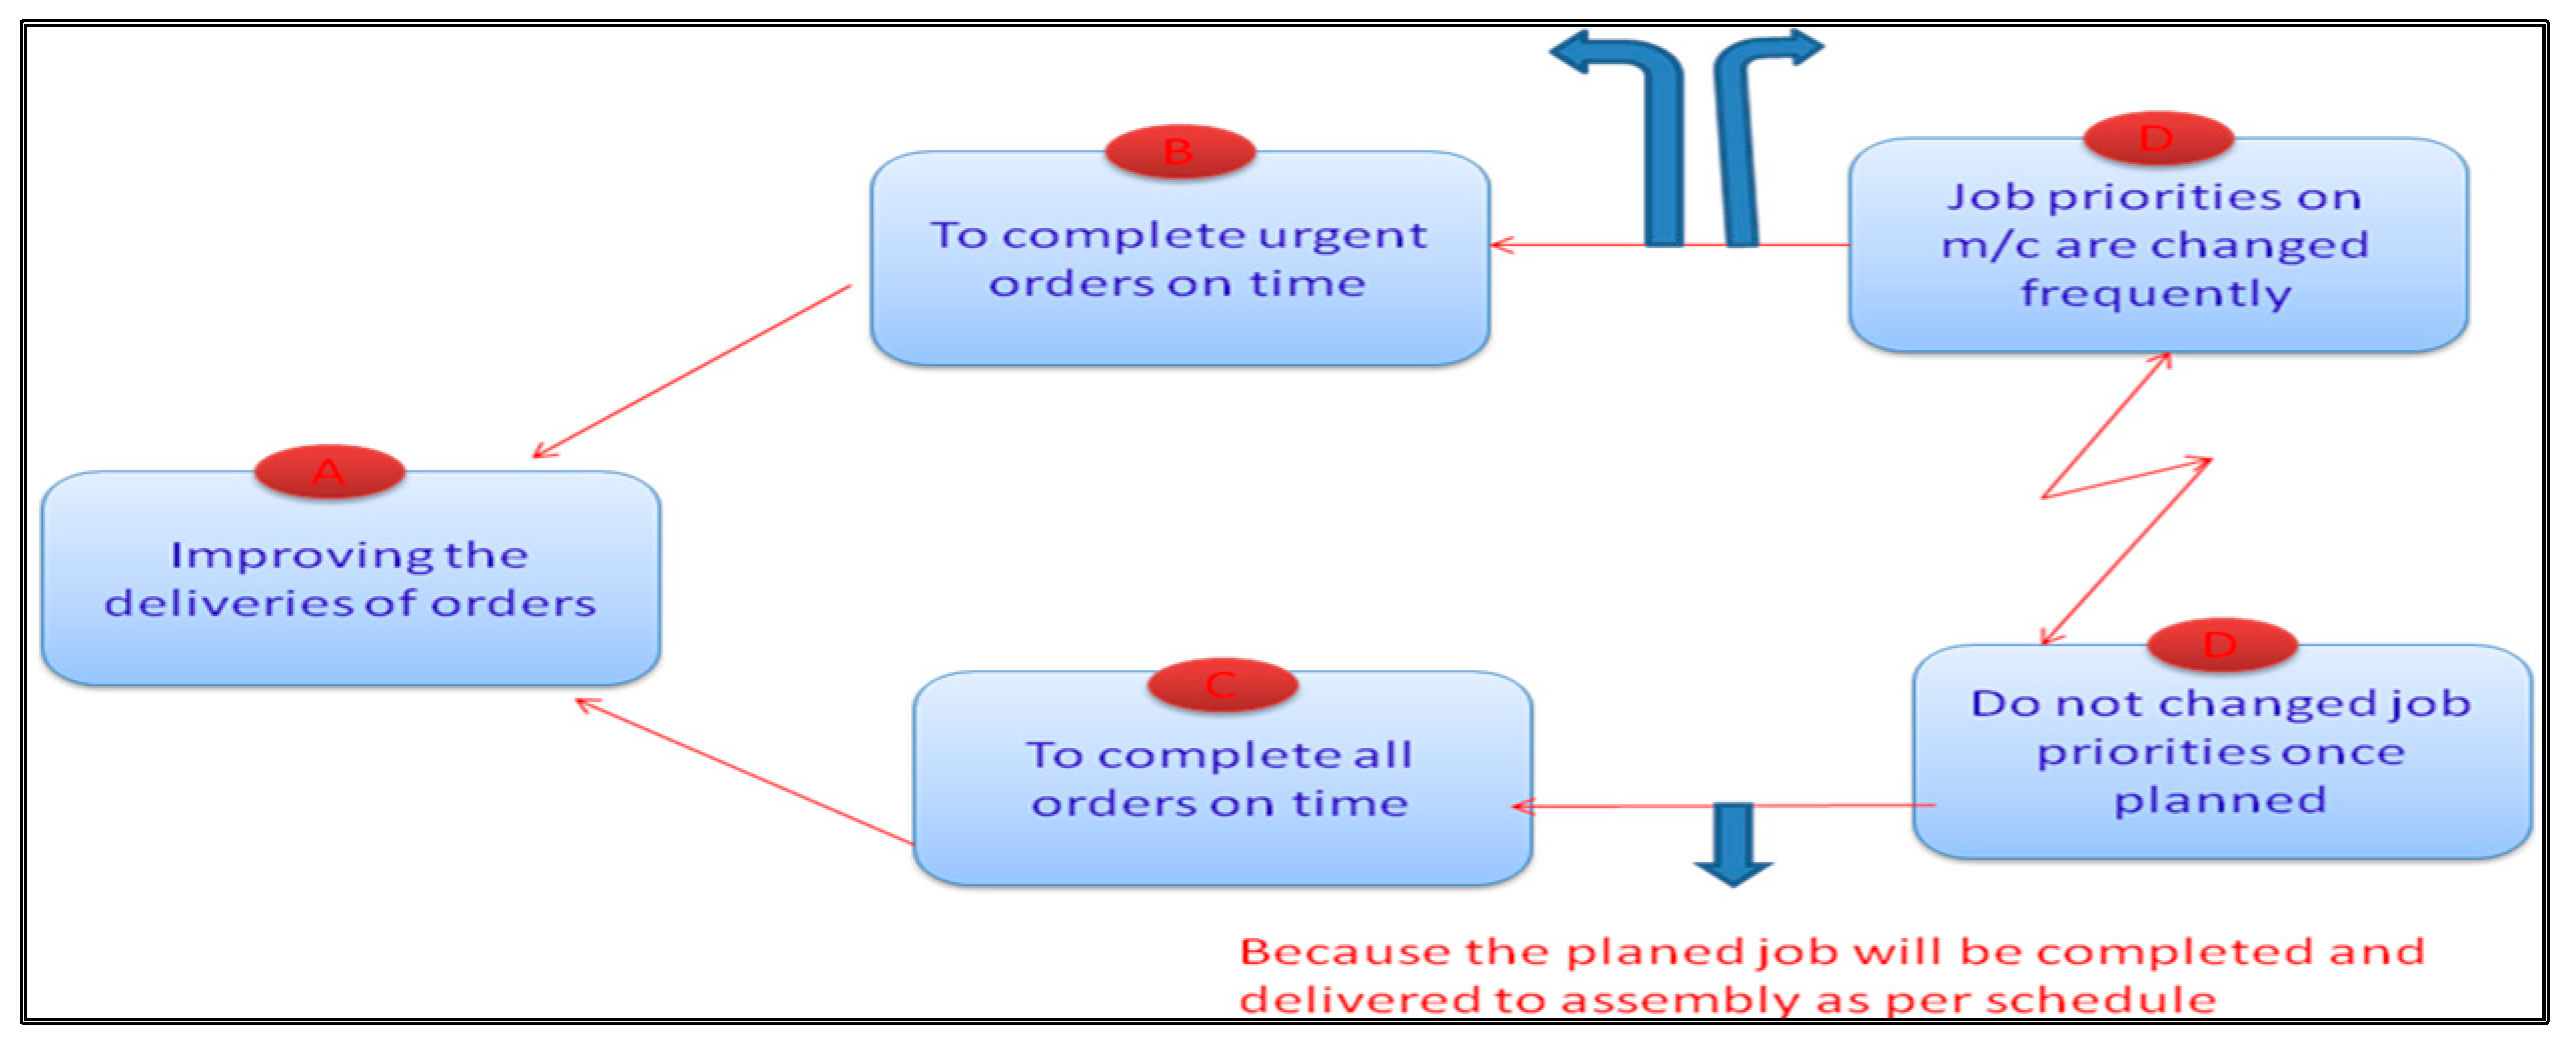
In most cases, shipments were not completed on time. Figure 4 illustrates the evaporating cloud for the UDEs. Late deliveries were the most disturbing action associated with UDEs, which included frequent changes in job priorities on the machine. A critical necessary condition to secure this objective was “To complete the urgent orders on time.” The exact opposite action suggested was “Do not change the job priorities once planned,” with the necessary condition being “Complete all orders on time.”
Figure 4.
Cloud for Late Deliveries.
3.3.3. Cloud for the UDEs: High Price
Figure 5 illustrates the evaporating cloud for this UDE. The most common distribution action is “actual manufacturing time is more than the estimated time” and the suggested opposite action is “take action to match actual manufacturing time with the estimated time.” The required necessary condition is shown in Figure 5, while the common organization objective is “Manage Shop Floor Successfully”.
Figure 5.
Cloud for high price.
3.4. Subordinating Every Related Decision to the Constraints
Following an examination of capacity constrained resources, there is an urgent need to align the capacity of other CNCs within the organization. If the other CNCs do not work with the new speed, they may become a constraint resource, and the plant may not achieve the desired rise in production. The subordinate rules include the following:
- Subordination required aligning all other CNCs with the optimized speed of CNC-3, even if it meant inefficiencies in non-constraints. Staff reallocation and priority access to shared resources were implemented to support this alignment.
- Rearranging the work sequence may increase setup for non-constraint processes but help reduce or simplify setup for the constraint.
- Staff can be away from non-constraint areas to support the constraint when required, such as during setup. Additionally, certain tasks of the constraint—like material handling, quality checks, or parts calculating—can be delegated to employees working in preceding or subsequent processes.
3.5. Future Reality Tree
The constraint should receive priority access to shared resources like cranes or forklifts. While this may frustrate non-constraint operators, proper communication and aligned reward systems are essential. Subordinating non-constraints in this way can significantly improve system throughput at minimal cost. This is a crucial step following the exploitation of constrained resources. Simply put, subordination is about making other resources operate at the new speed of constrained resources. This is essential, as the speed of constraint resources goes up after exploitation. If the other resource does not work with the new speed, it may become a constraint resource, and the plant may not achieve the desired rise in production.
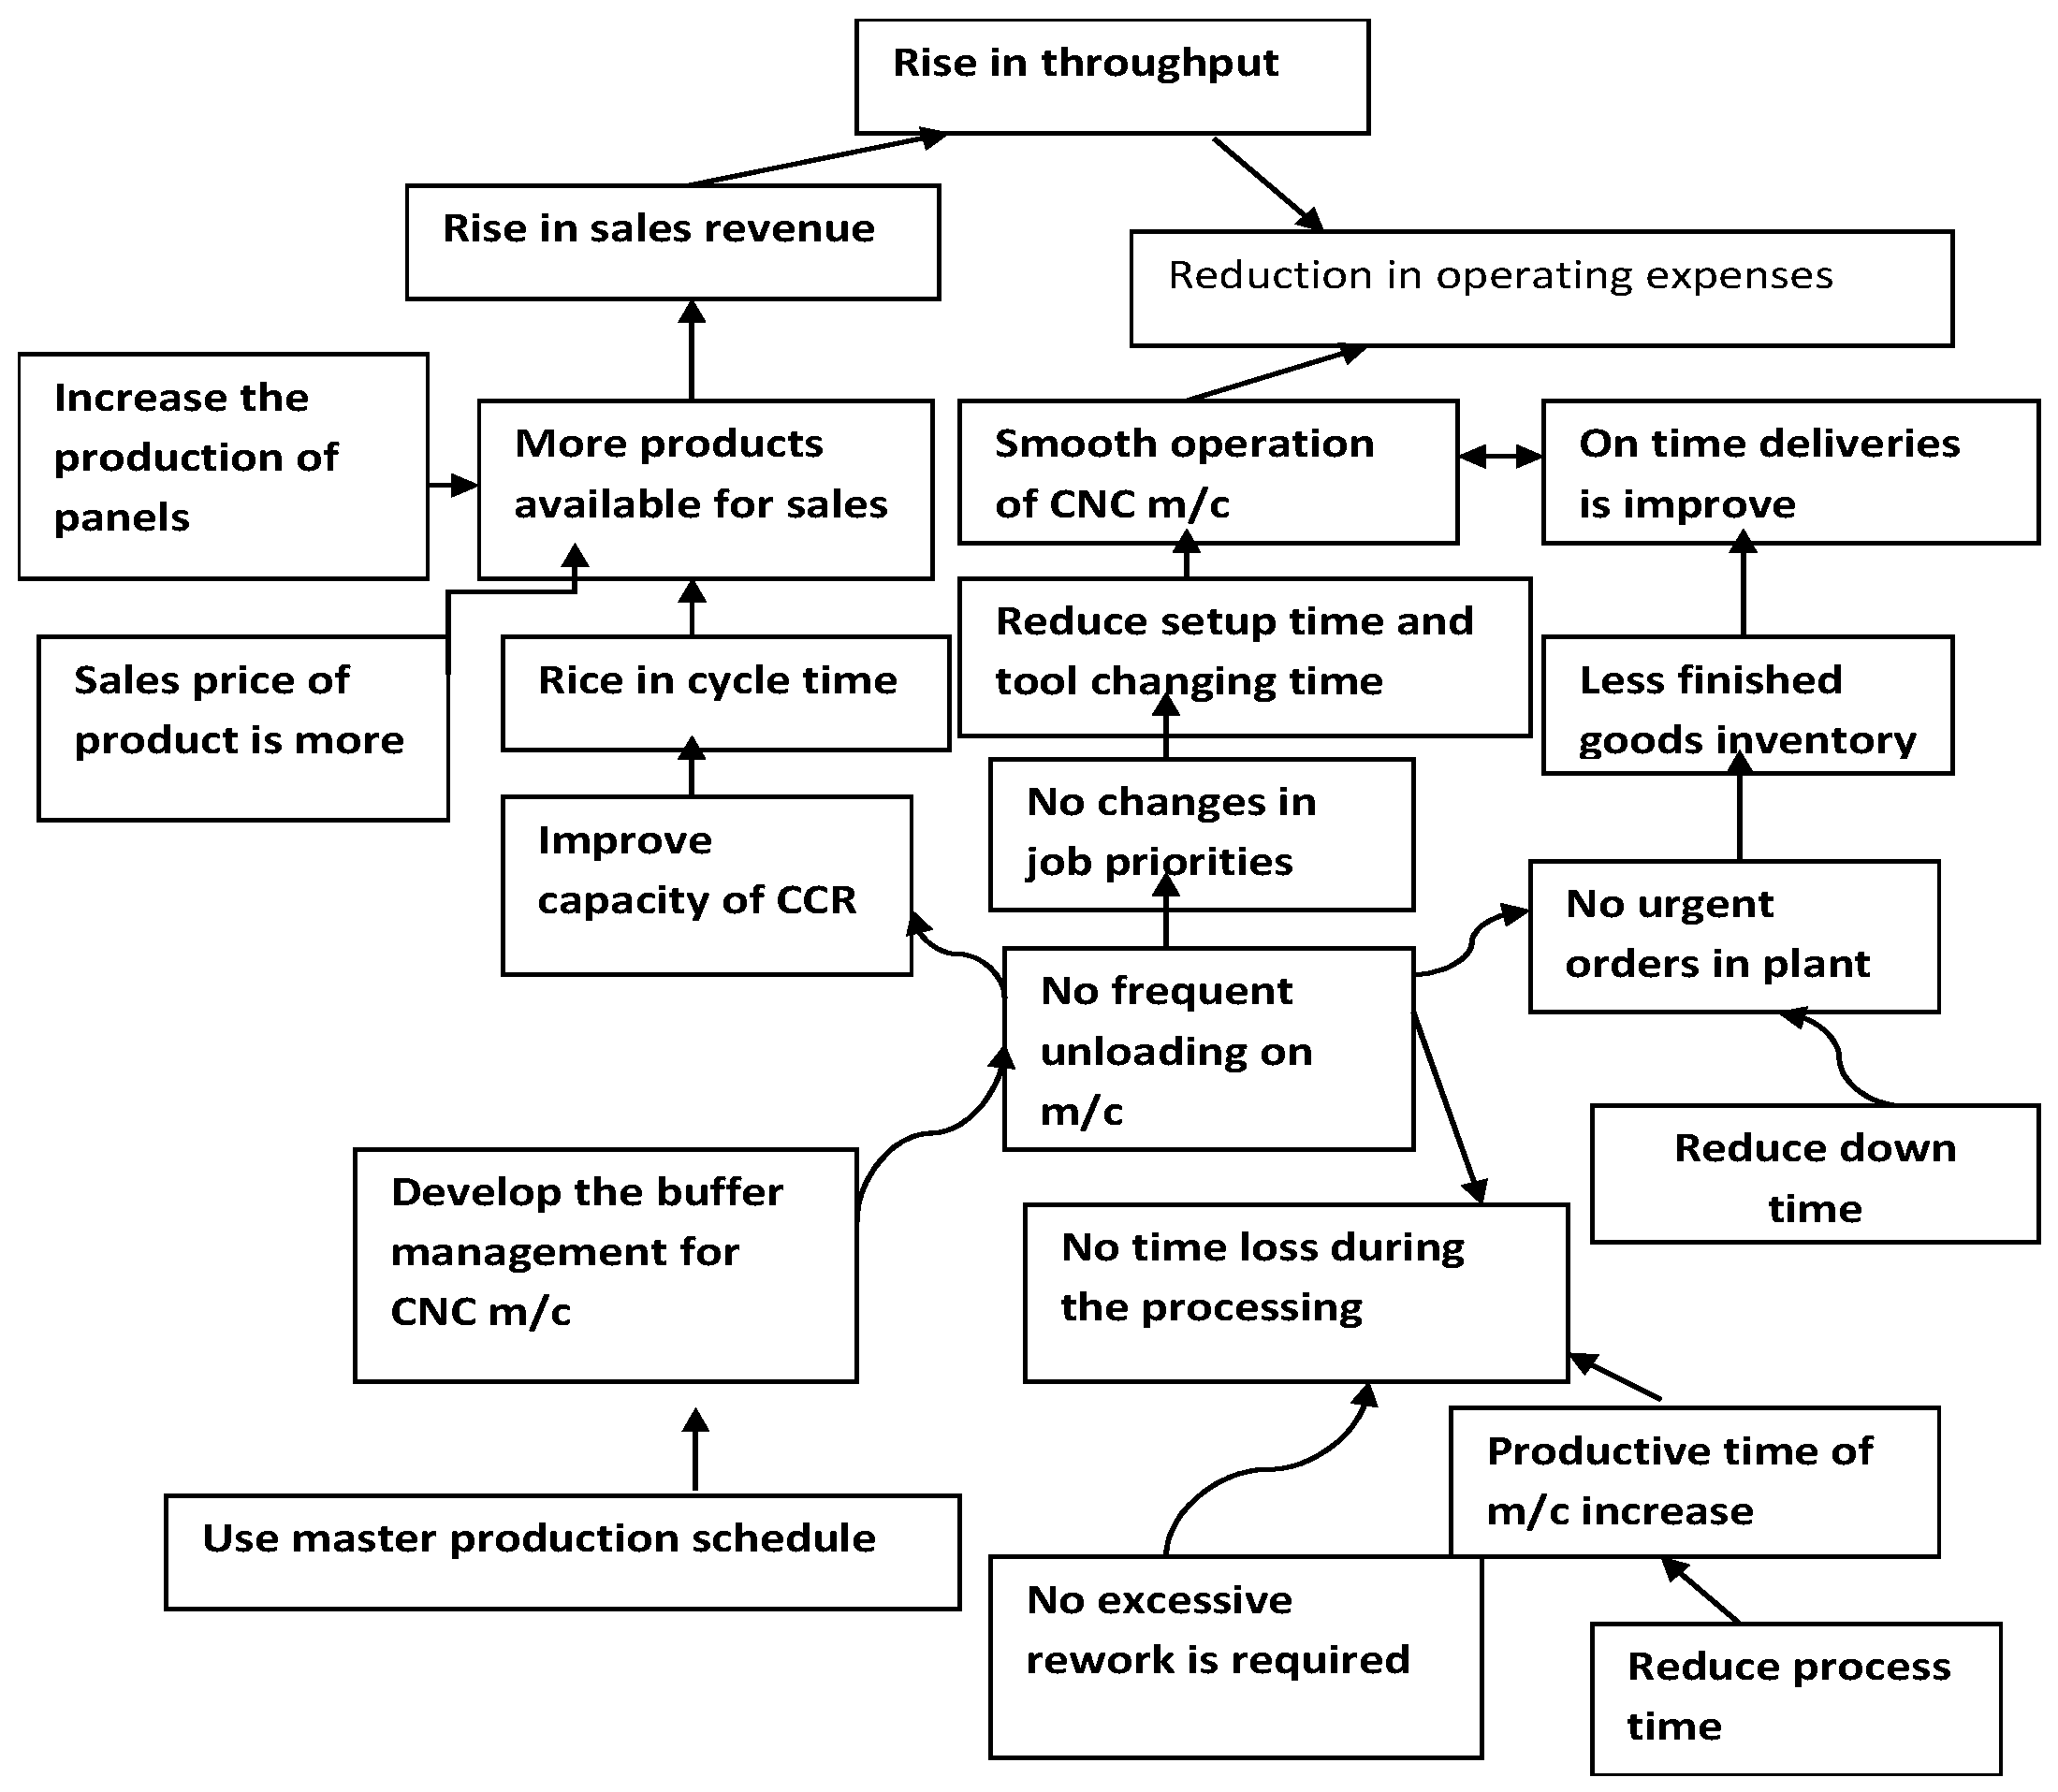
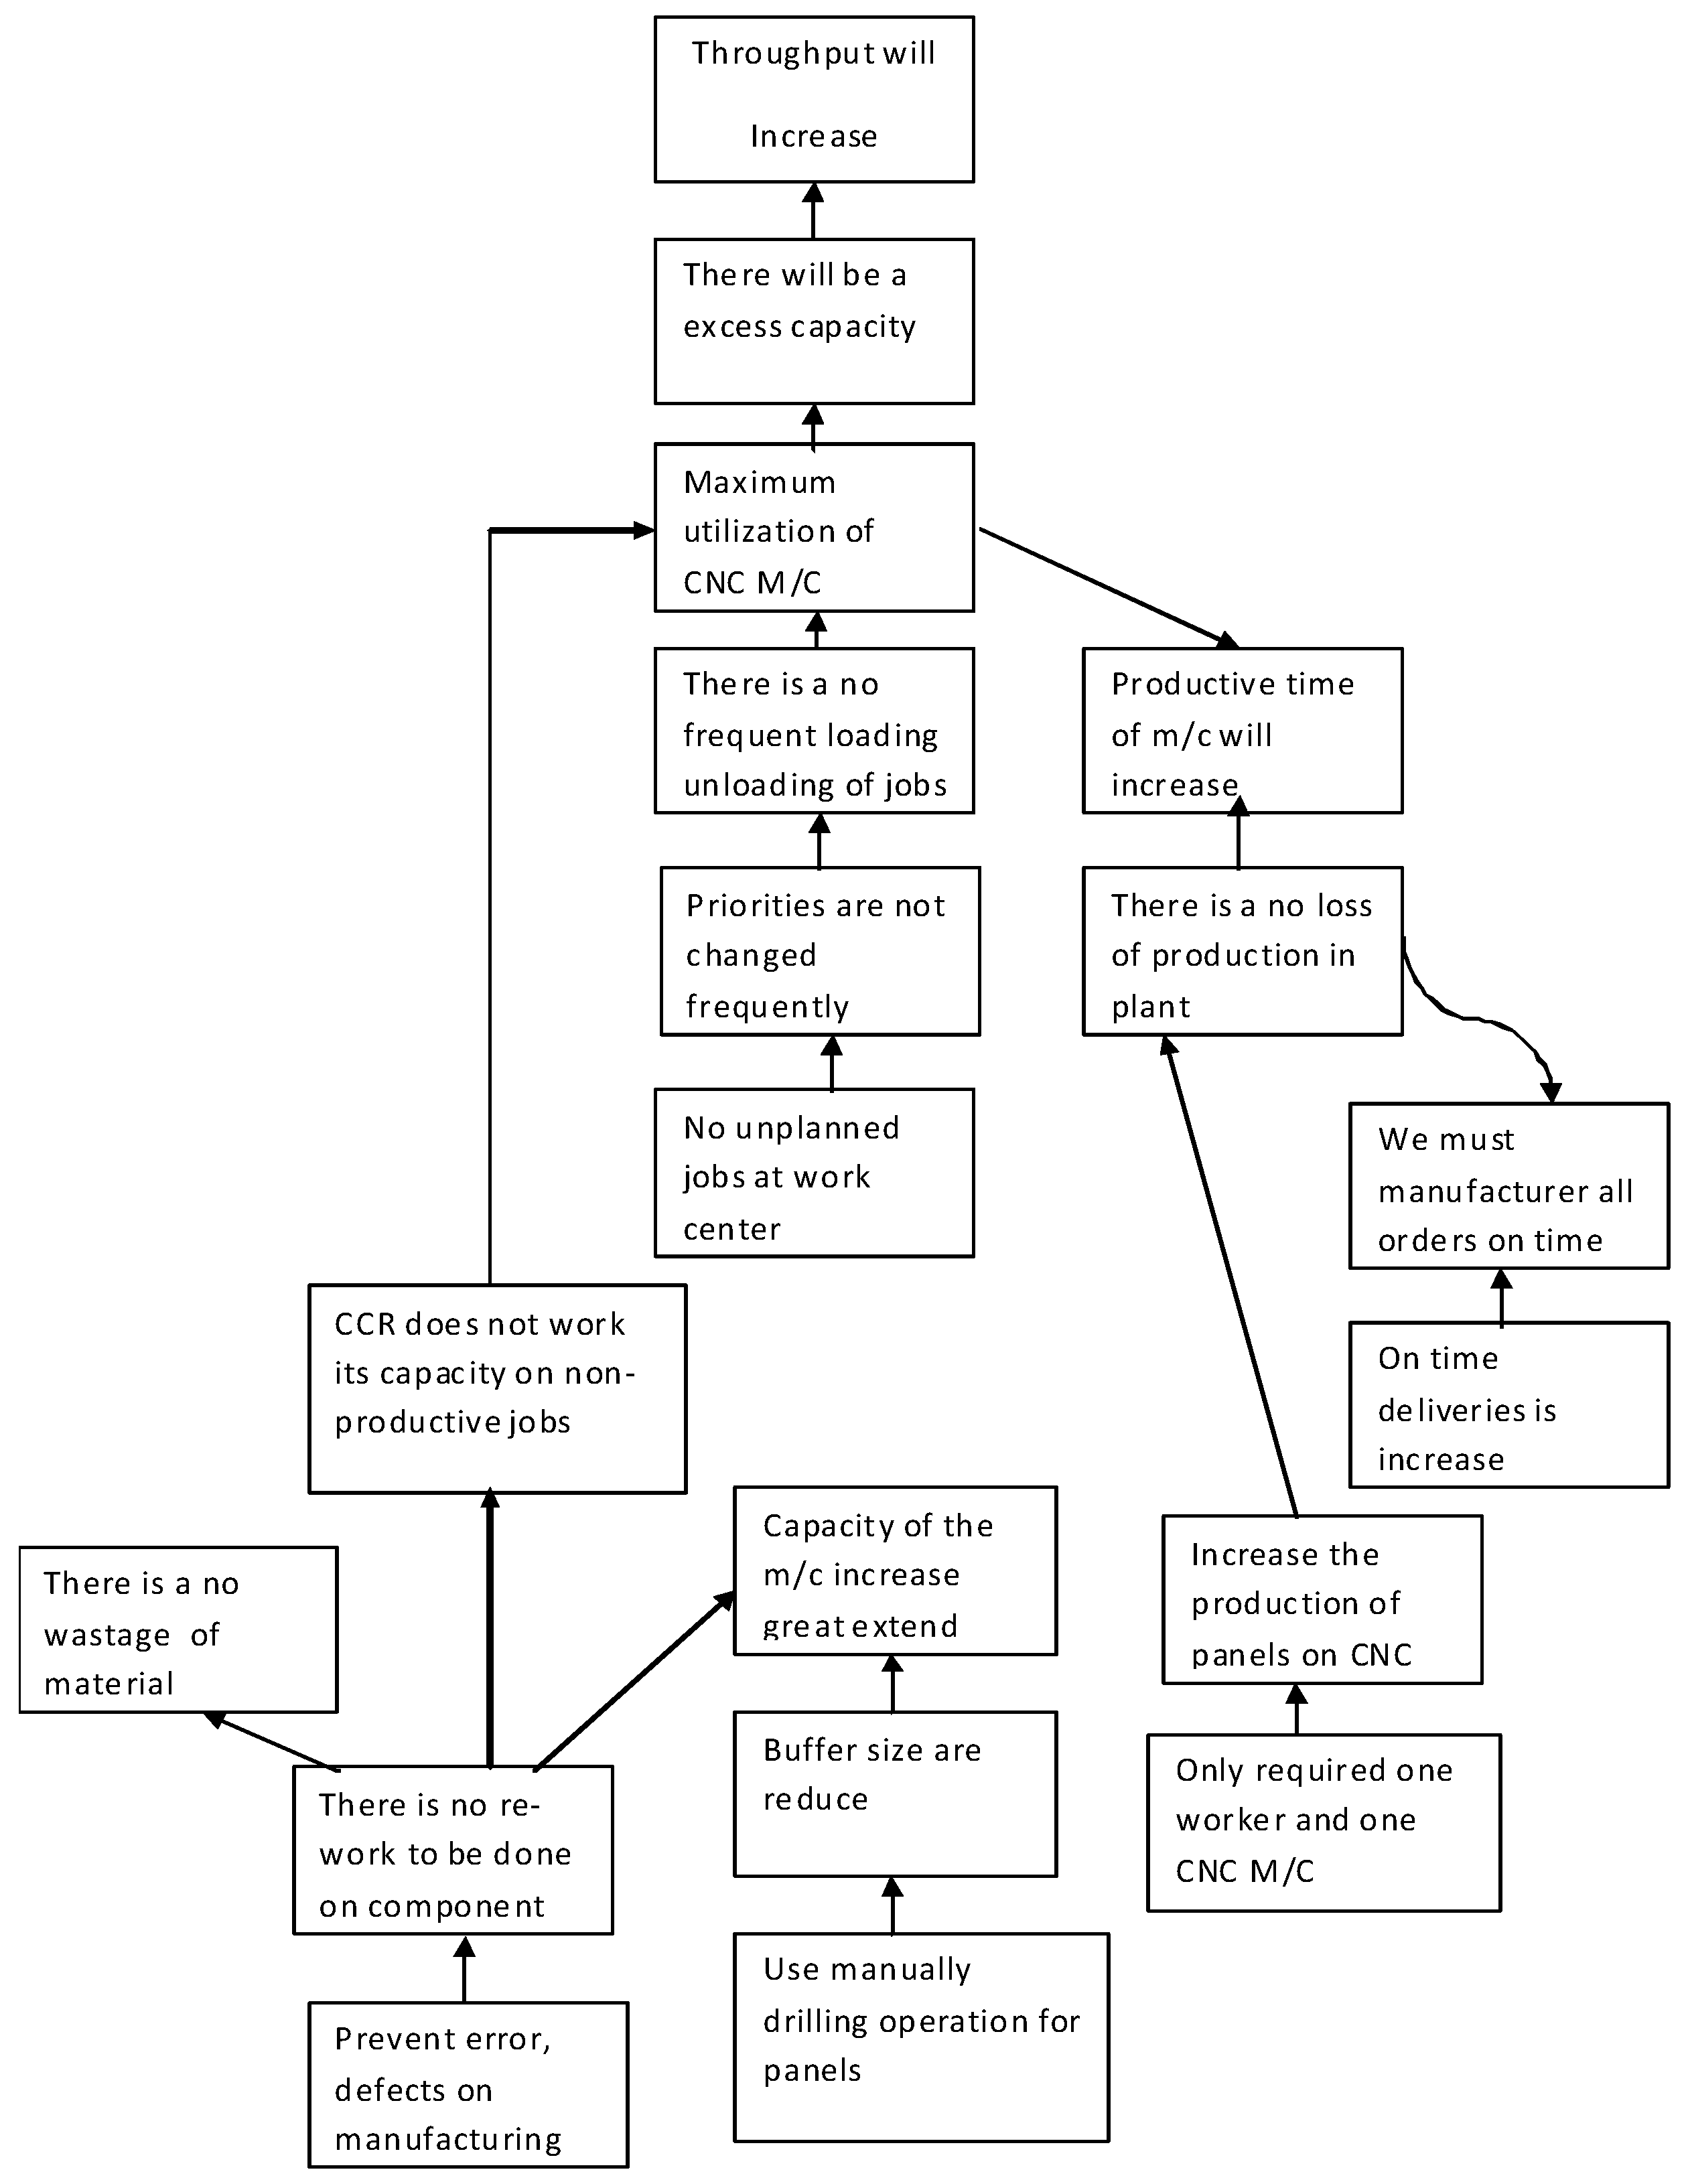
The Future Reality Tree (FRT) is a TOC tool that maps proposed solutions to the expected improvements they will yield. The FRT provides clarity and understanding that allows an individual to see exactly where the solution set comes from, its real impact, and why it is critical that compromises are not made around redefining and implementation. The FRT constructed in the above case is shown in Figure 6. The primary idea of using manual drilling would take care of uncertainties in CNCs and other resources by means of time buffers. It would also avoid the regular loading and unloading of jobs in CNCs. The master production schedule can be used to address capacity constraints for the resource and to develop a time buffer management CCR.
Figure 6.
Future Reality Tree.
3.5.1. Negative Branches
The negative branch shows the possible negative impact on the organization.
The Future Realty Tree for the second option is as follows:
- If By installing manual drilling, operating expenses are increased.
- For developing a master production schedule, buffer management is required for each recourse.
3.5.2. Prerequisite Tree
After developing the Future Reality Tree, the next stage is to structure the prerequisite tree for the new proposed solution. This tree helps in visualizing the prerequisite factors for implementing the proposed solution successfully. For this, there are certain requirements that can be listed as follows:
- To identify the obstacles that may come in the way of implementing the proposed solution.
- To find ways to overcome the obstacles.
- To develop a plan of action for the execution of the new solution.
The appearance of the prerequisite tree is totally different from the Current and Future Reality Tree. The structure of the prerequisite tree is shown in Figure 7, where the various objectives are connected to the main objective. The obstacles are also connected to the objective.
Figure 7.
Prerequisite tree.
The basic objective of the organization is to improve throughput, increase the capacity of resources, and reduce process time. The sub-objectives are to require the proper scheduling of jobs, develop a master production schedule for increasing capacity, and use manual drilling to reduce process time.
3.6. Elevating the Constraints
Initial optimization should focus on policy and method changes, as these offers zero-cost improvements. If such measures fail to relieve the constraint, investing in additional resources—such as upgraded equipment, overtime, or extra staff—becomes necessary to enhance capacity. The basic purpose of elevation is similar to exploitation, i.e., to increase the capacity of the constraint resource. After exploitation, if the resource remains constrained, then it needs to be elevated. This is done by increasing the capacity of the constraint resource by installing an additional machine. However, cost of elevation is more than the cost of exploitation.
Transition Tree
This is the last step in the implementation of the thinking process, which contains steps that must be accomplished. The difference between the Future Reality Tree and the transition tree is that the former is just the validation of the idea or solution to the core problem obtained from the Current Reality Tree. However, the transition tree’s levels of the step-by-step transition are very important.
Figure 8 shows the transition tree. We relate all UDEs by drawing a transition tree. It shows the type of action required to solve UDEs.
Figure 8.
Transition tree.
4. Results & Discussion
4.1. Identification of the Constraint
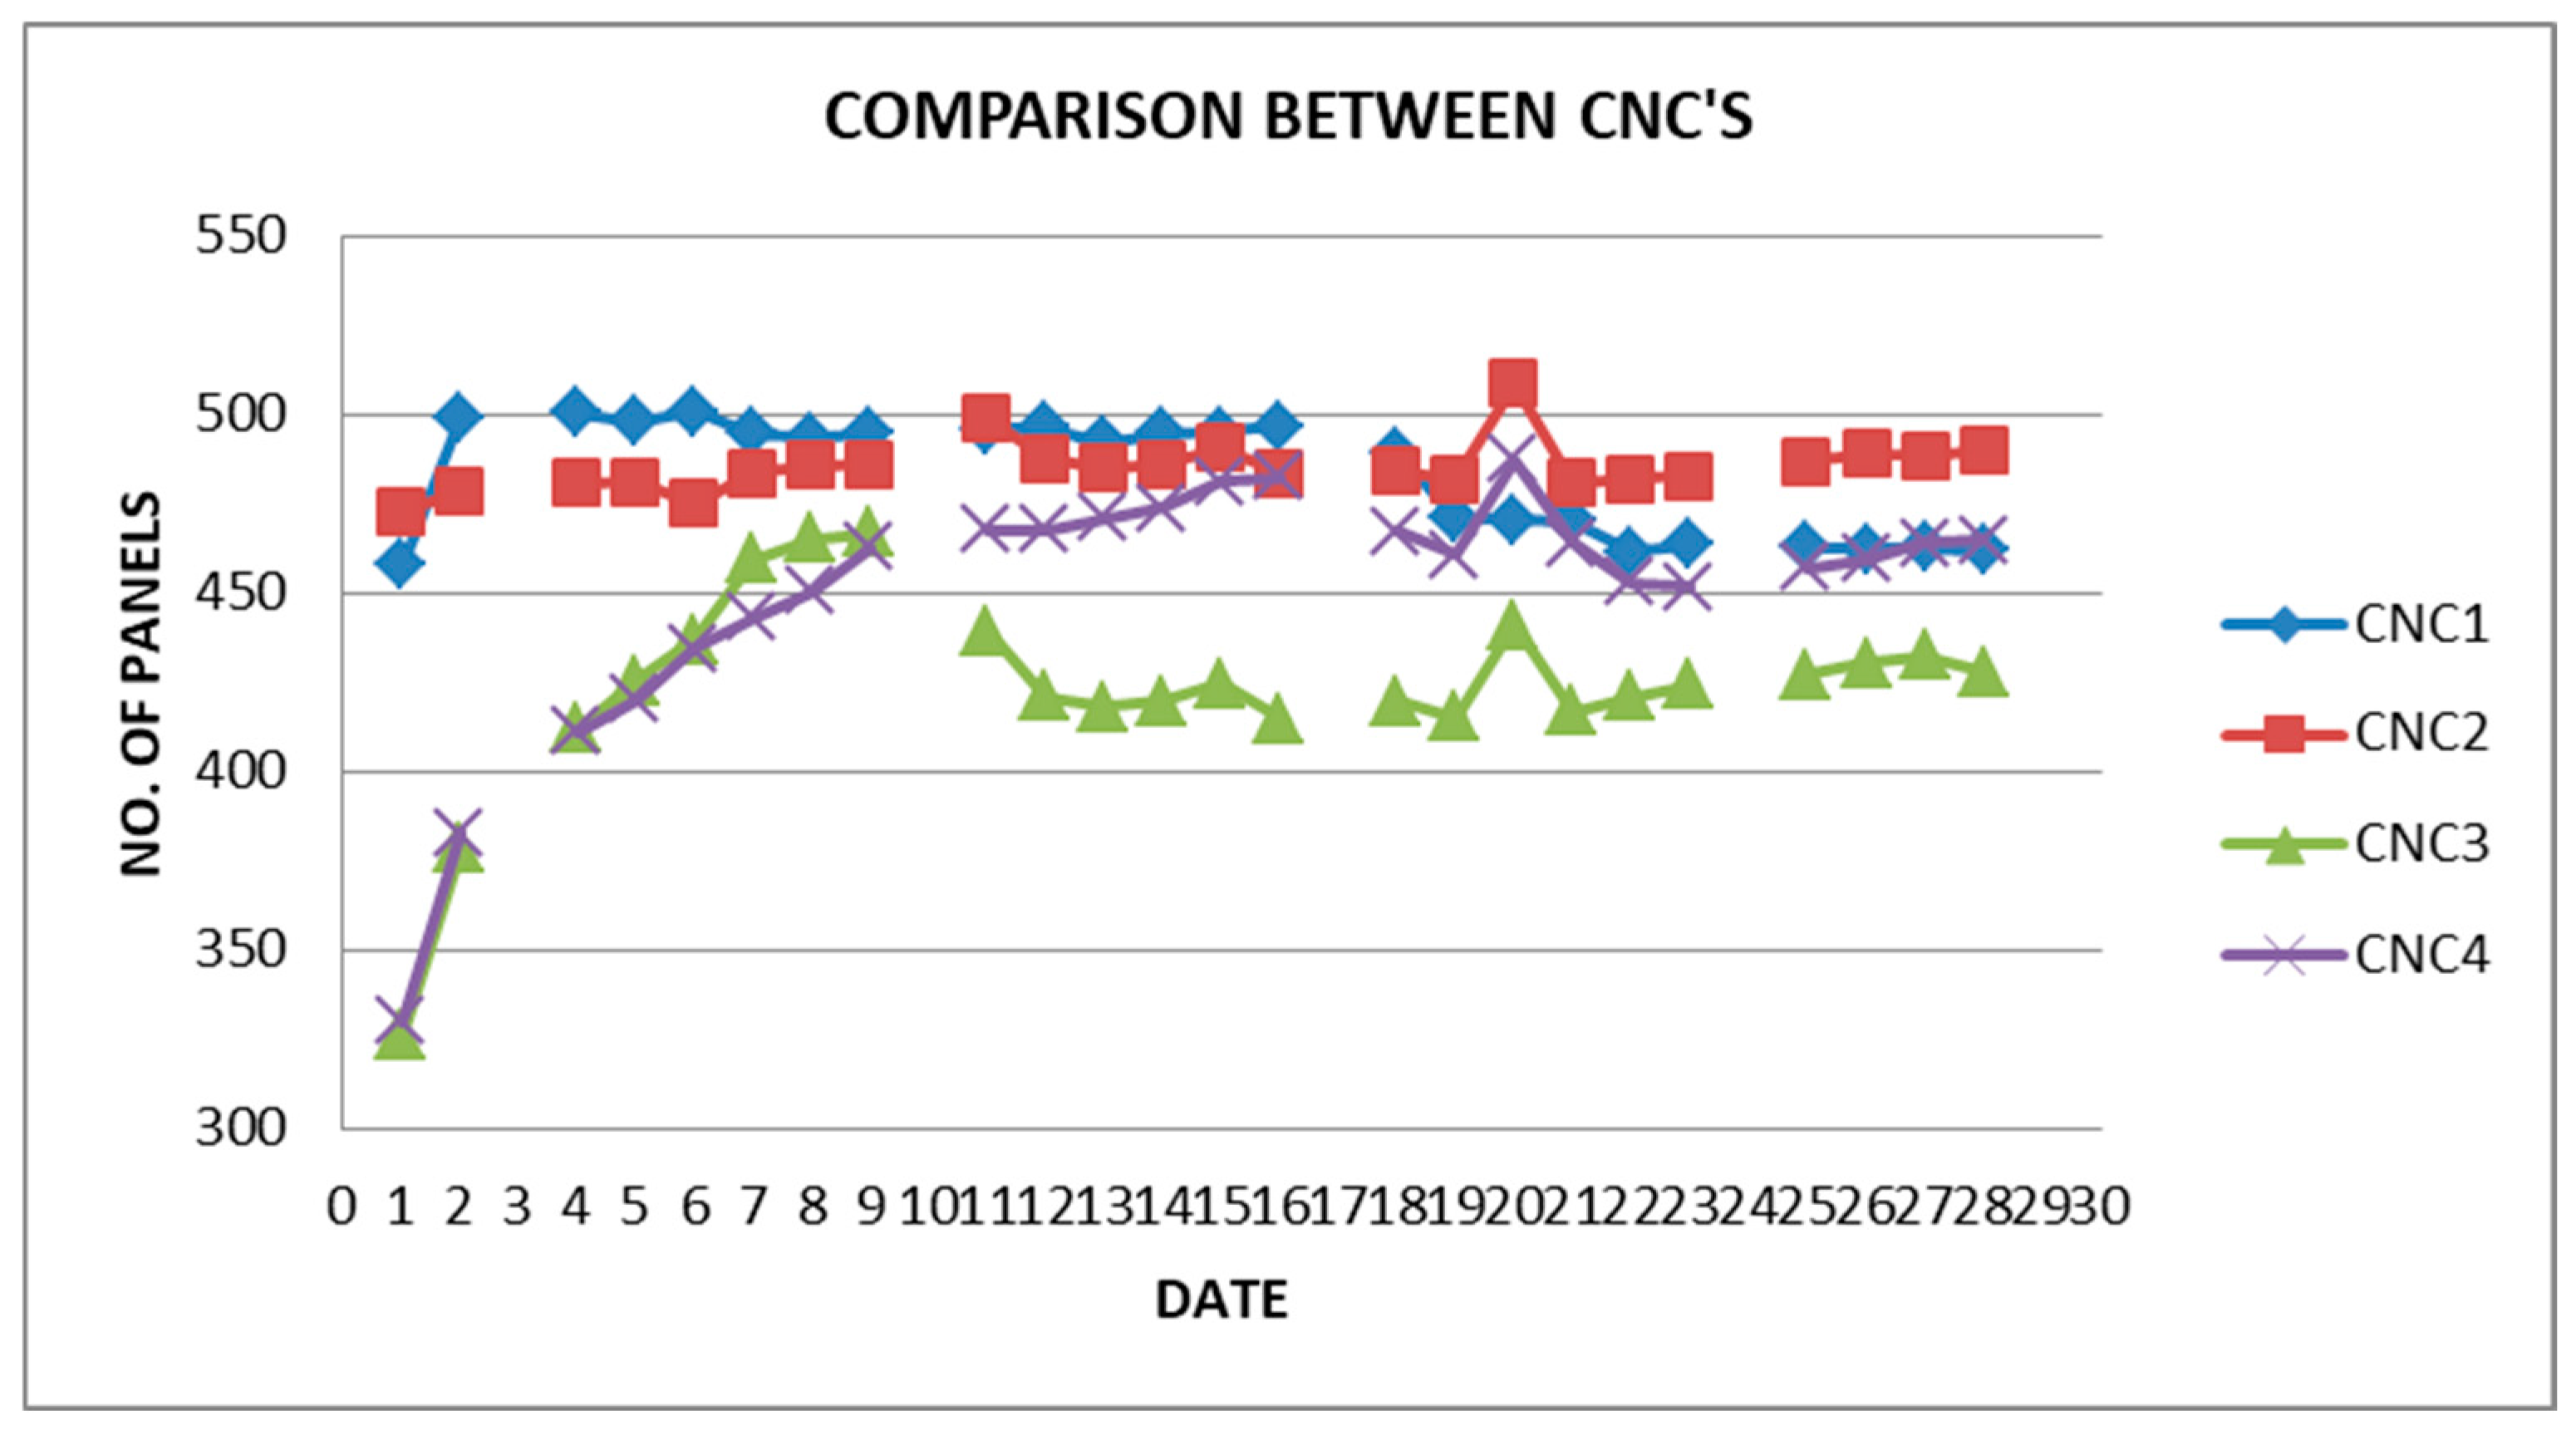
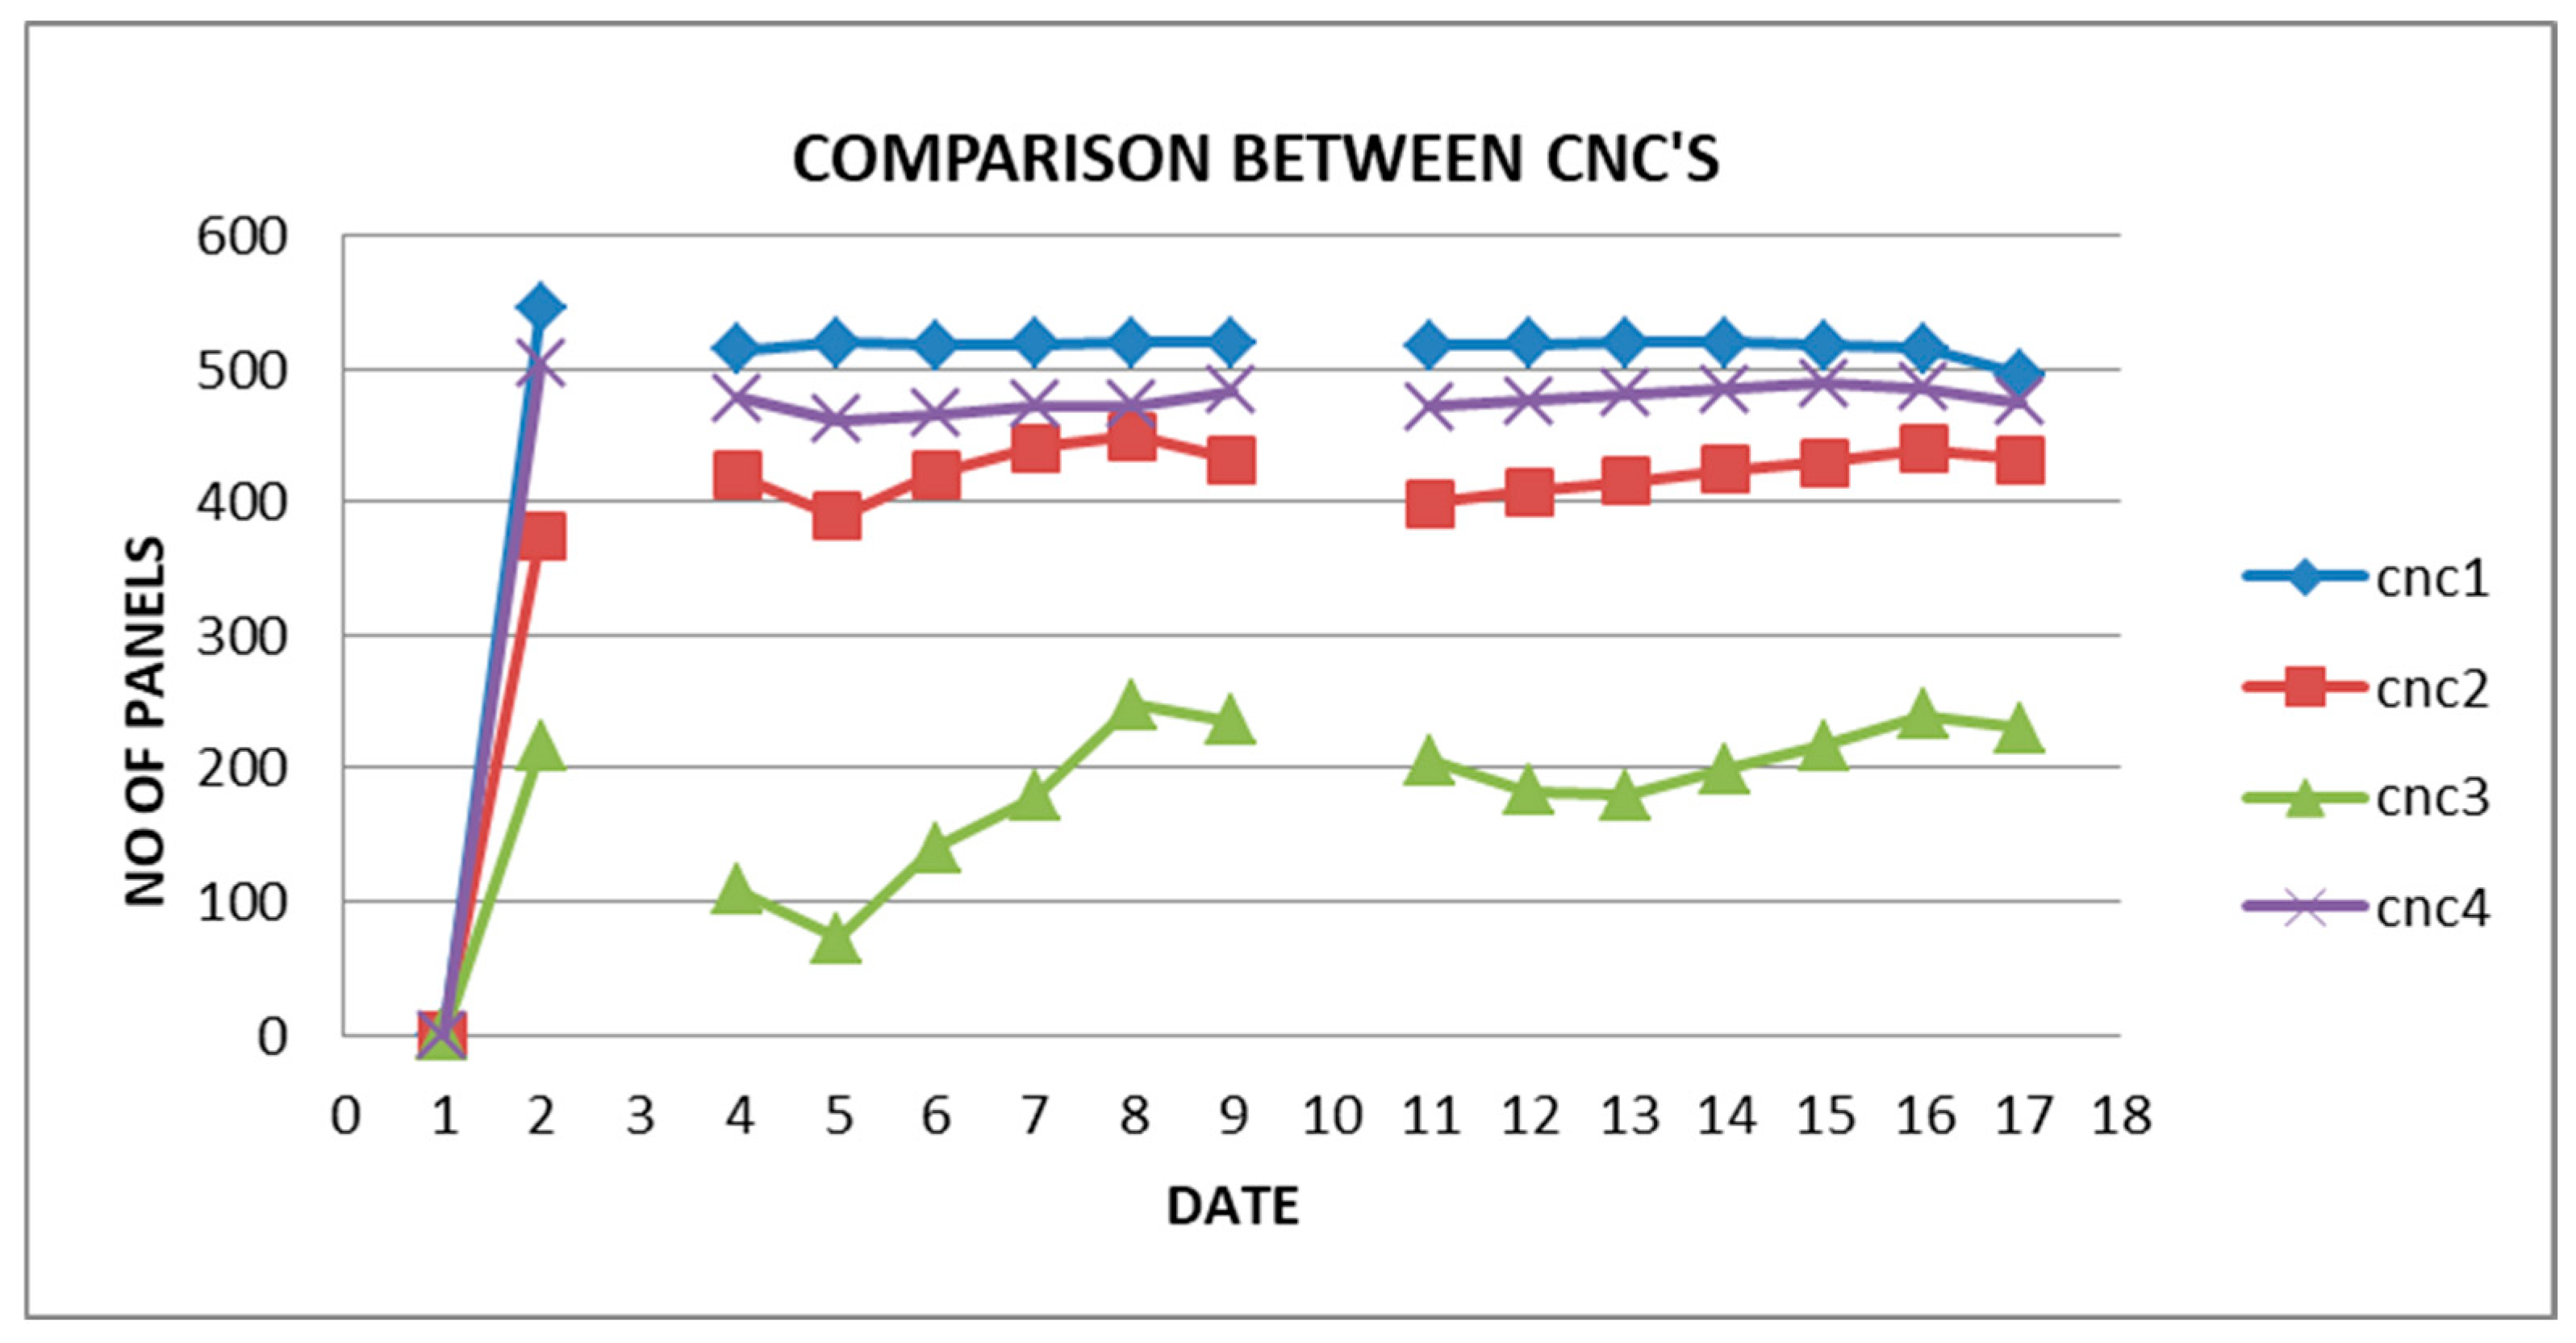
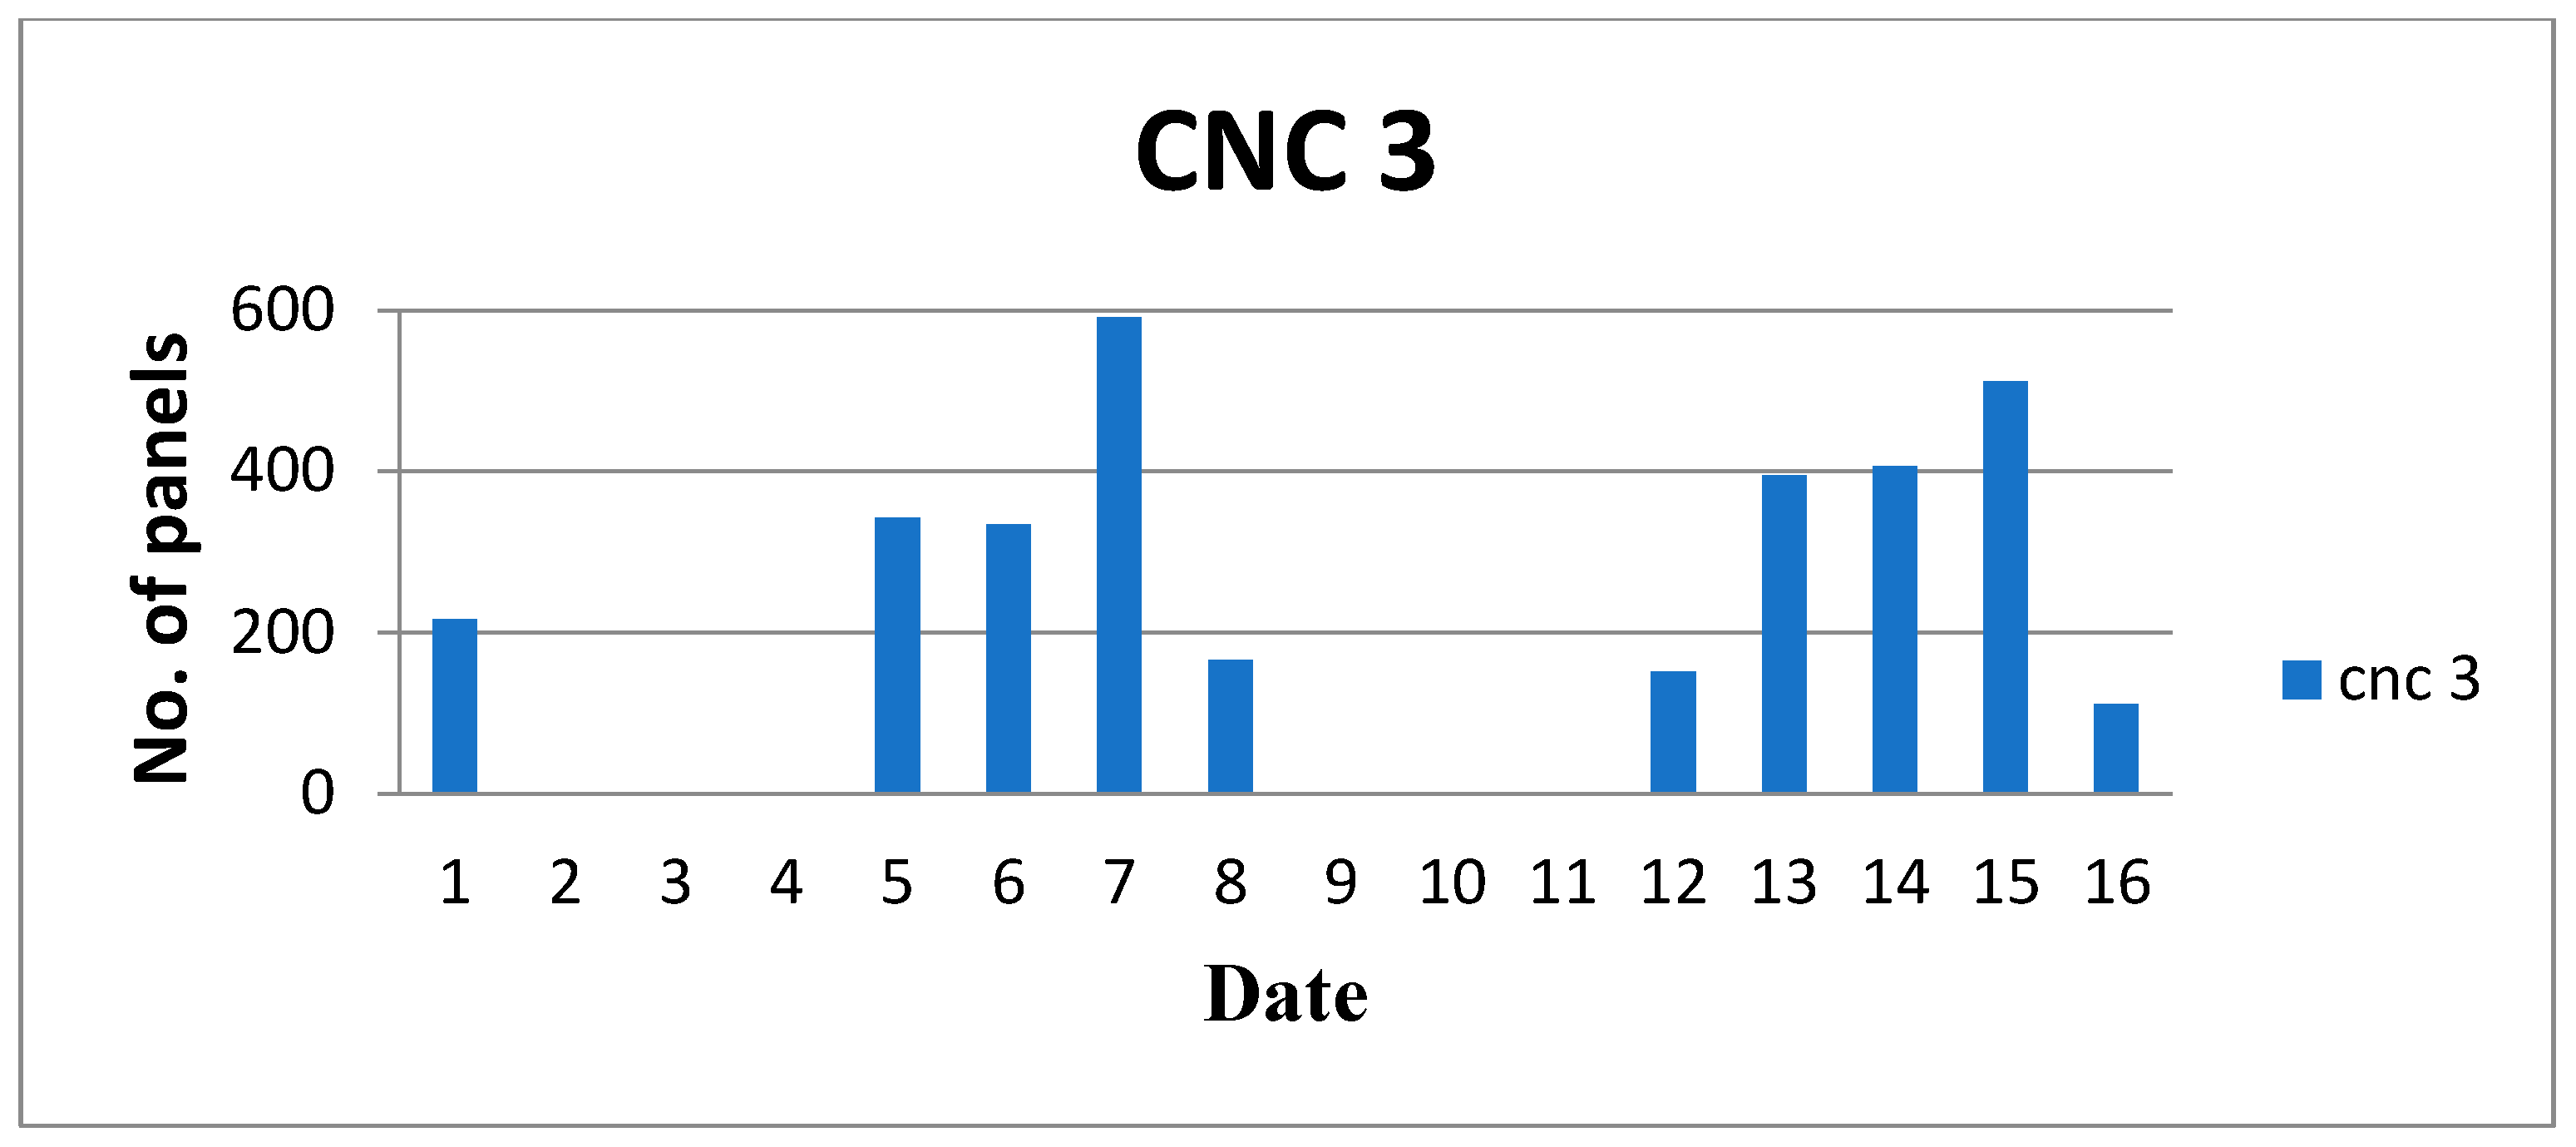
The production data collected from the case study company (Table 1 and Table 2, Figure 9 and Figure 10) were analyzed to identify system bottlenecks. A comparative study of the four CNC machines (CNC-1 to CNC-4) revealed that CNC-3 consistently underperformed relative to the others. While CNC-1, CNC-2, and CNC-4 maintained stable throughput levels, CNC-3 displayed frequent downtime and lower panel output. This imbalance highlighted CNC-3 as the primary capacity constraint within the production system.
Table 1.
Production of panels—Feb. 2010.
Table 2.
Production of panels Mar. 2010.
Figure 9.
No. of panels vs. no. of date for CNCs—Feb. 2010.
Figure 10.
No. of panels vs. no. of date for CNCs—Mar. 2010.
This finding is consistent with the Theory of Constraints (TOC), which emphasizes that system performance is limited by its weakest element. In this case, the restricted capacity of CNC-3 directly determined the throughput of the entire manufacturing line.
4.2. Analysis of CNC Performance
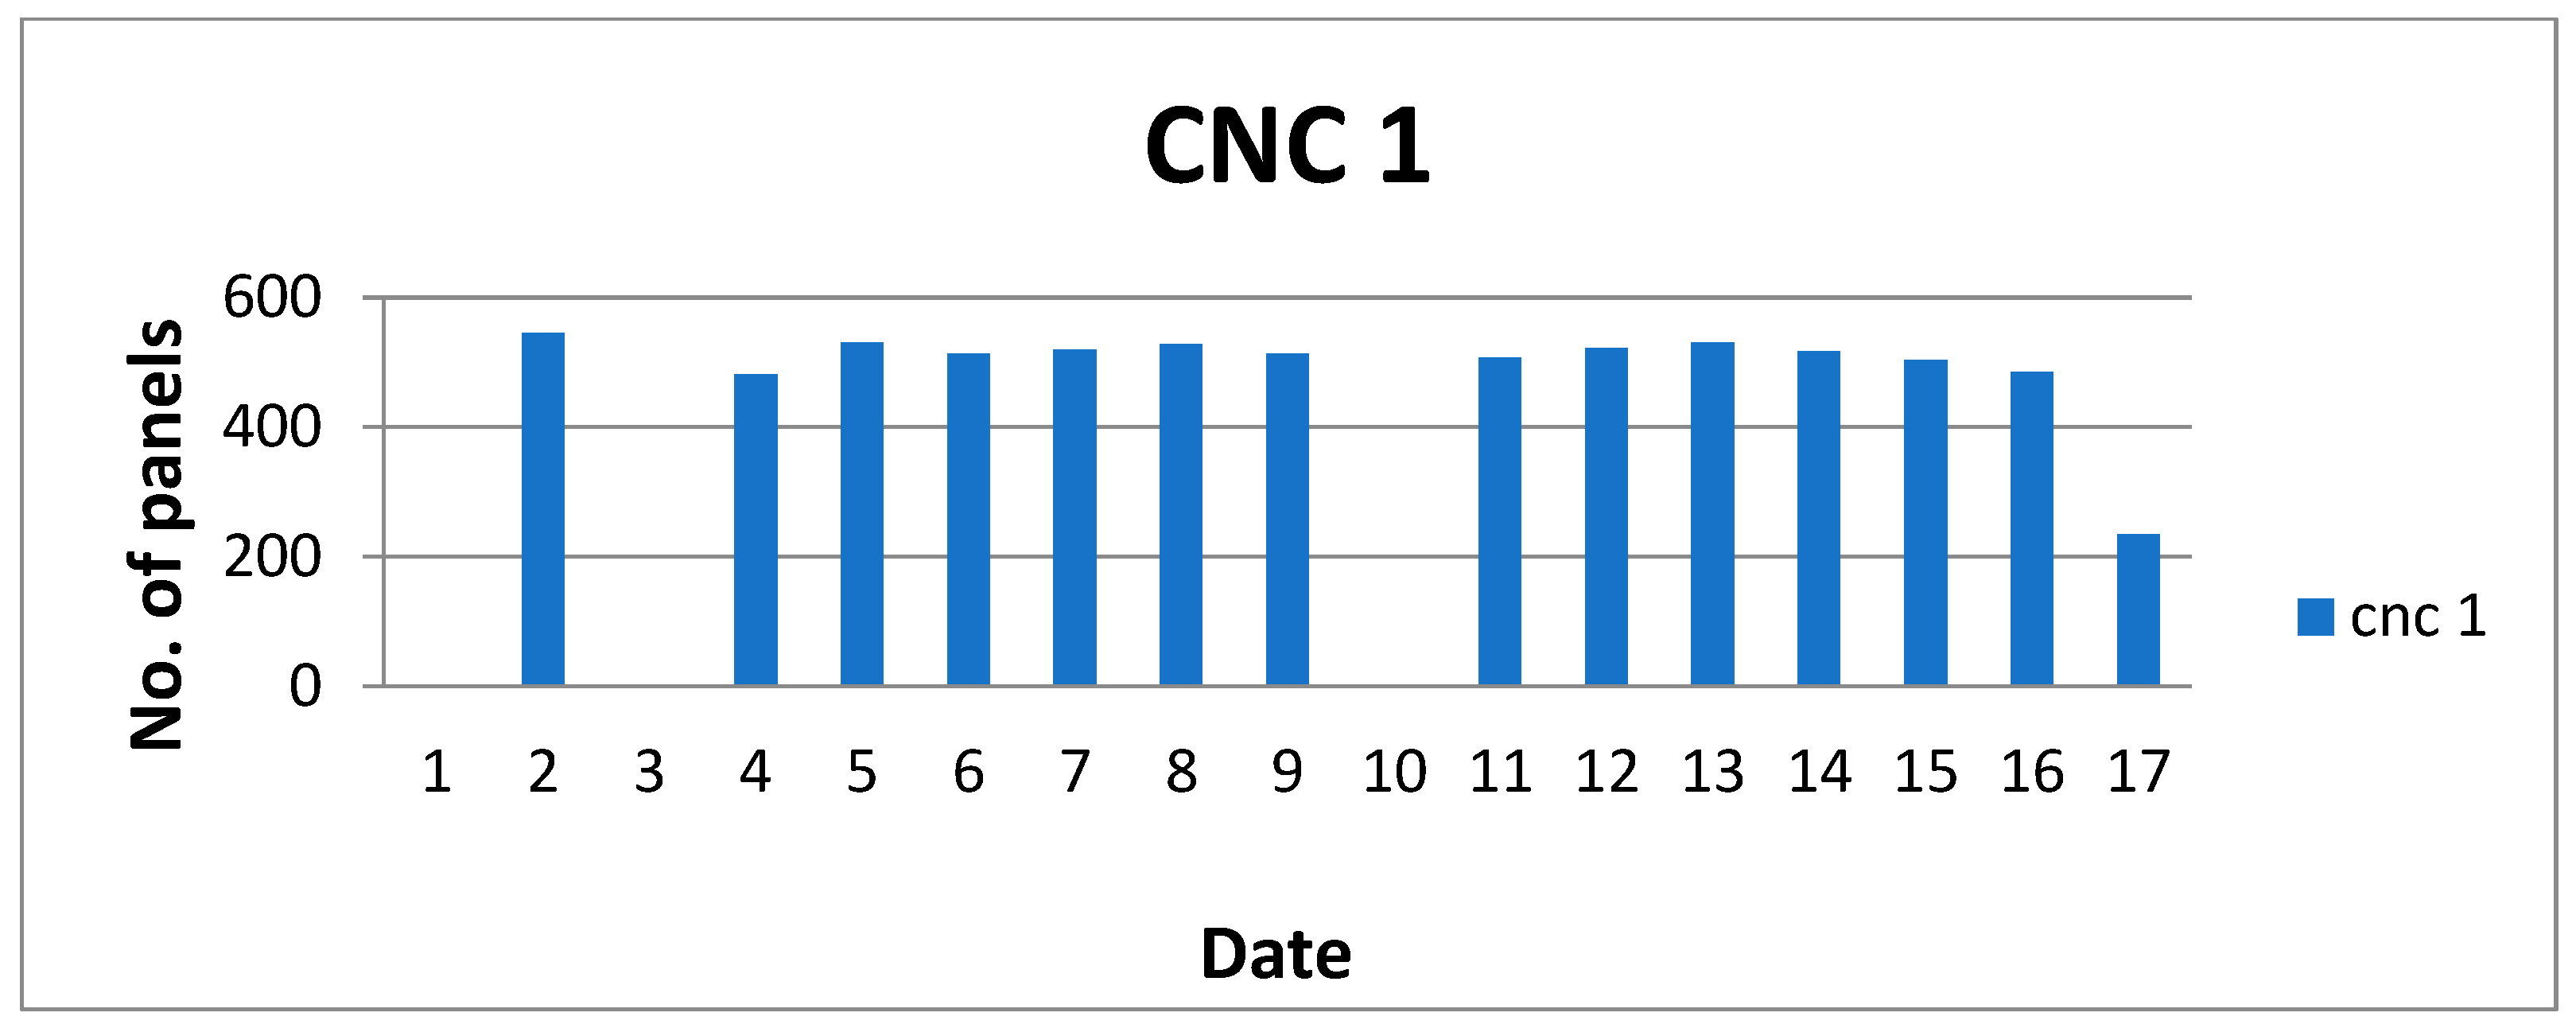
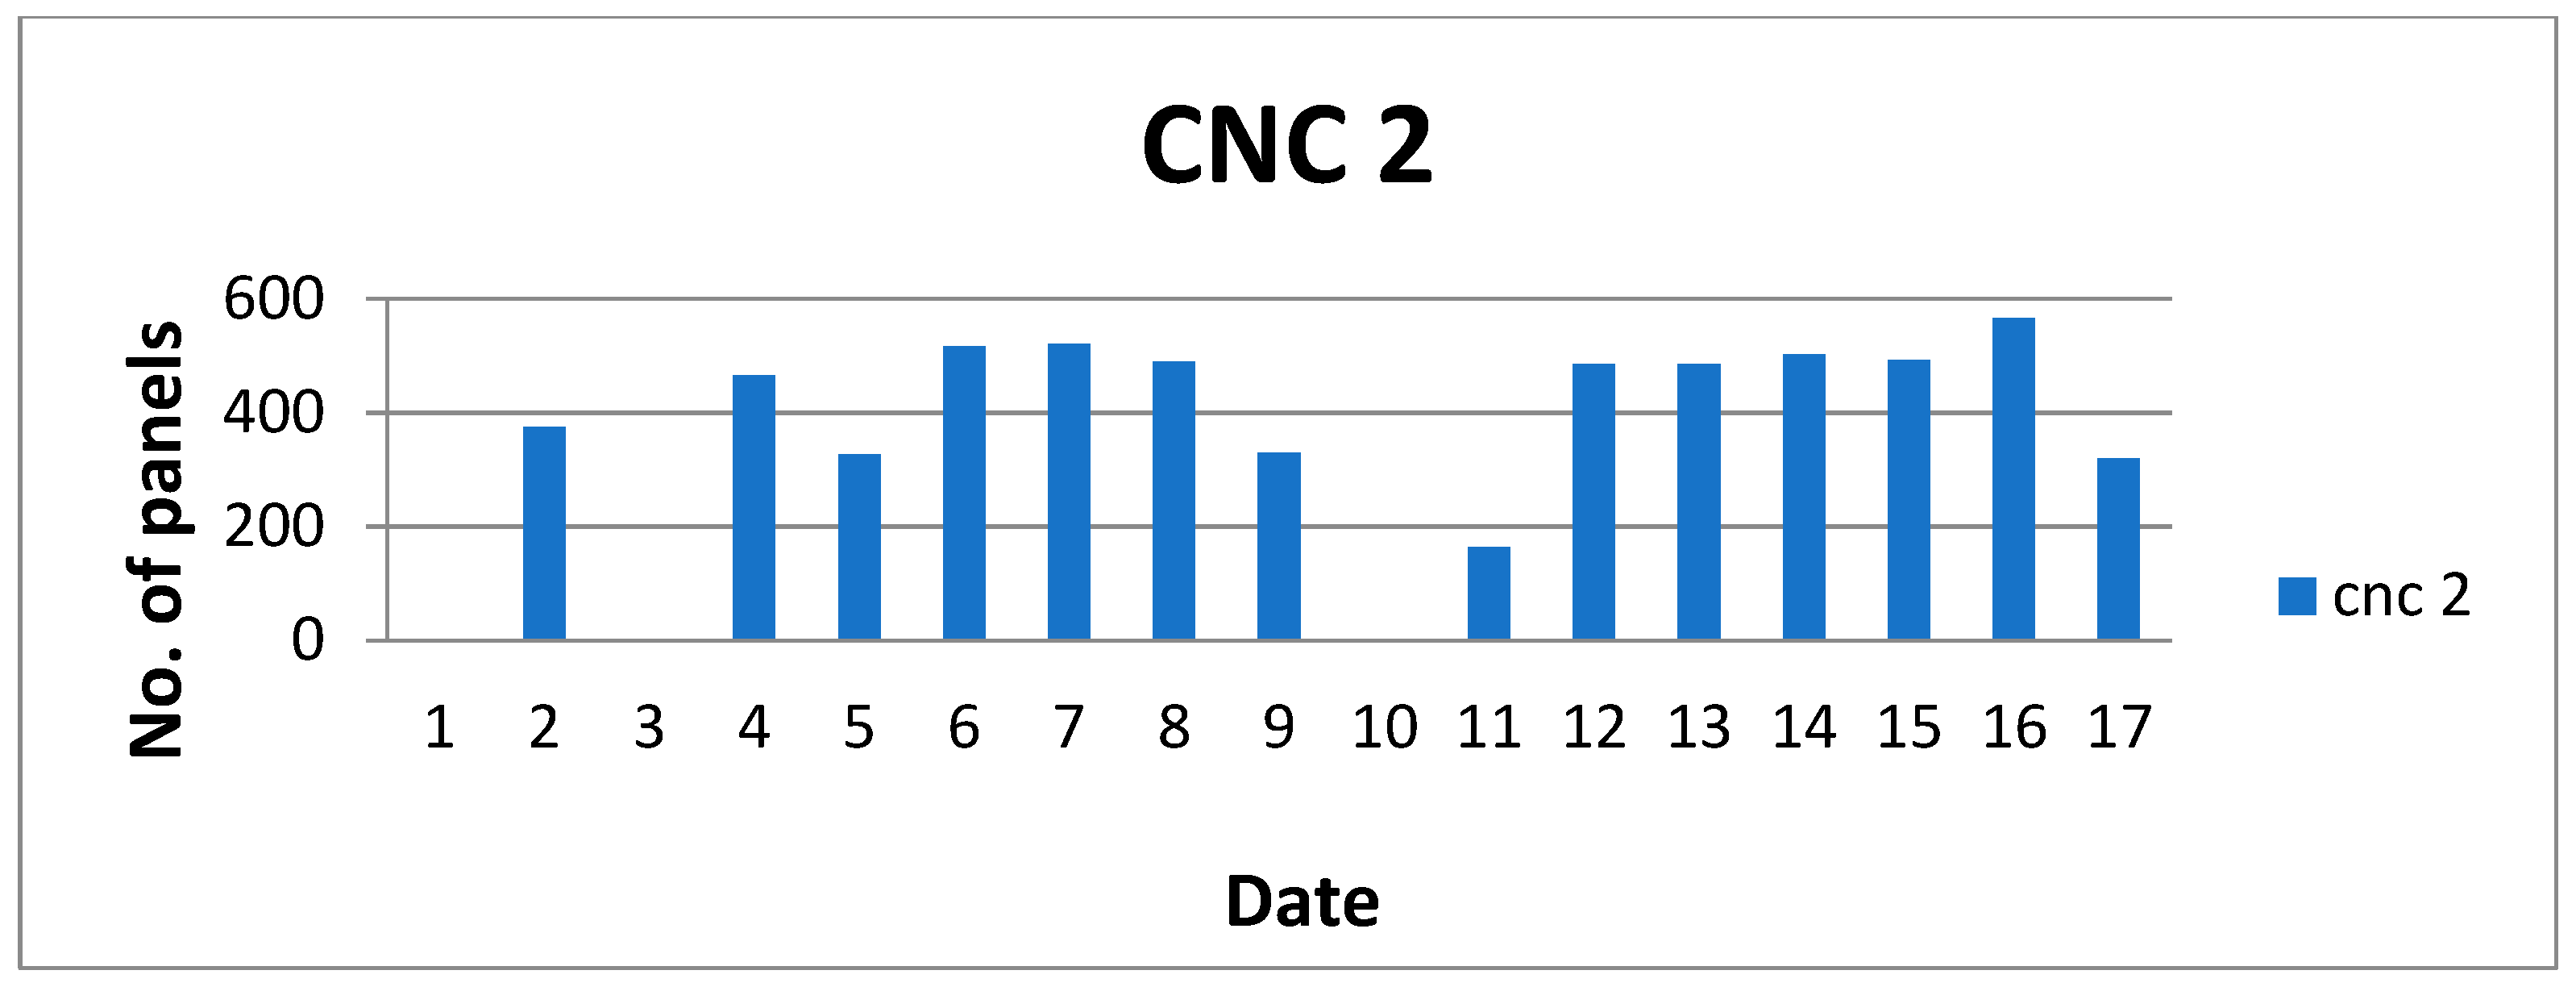
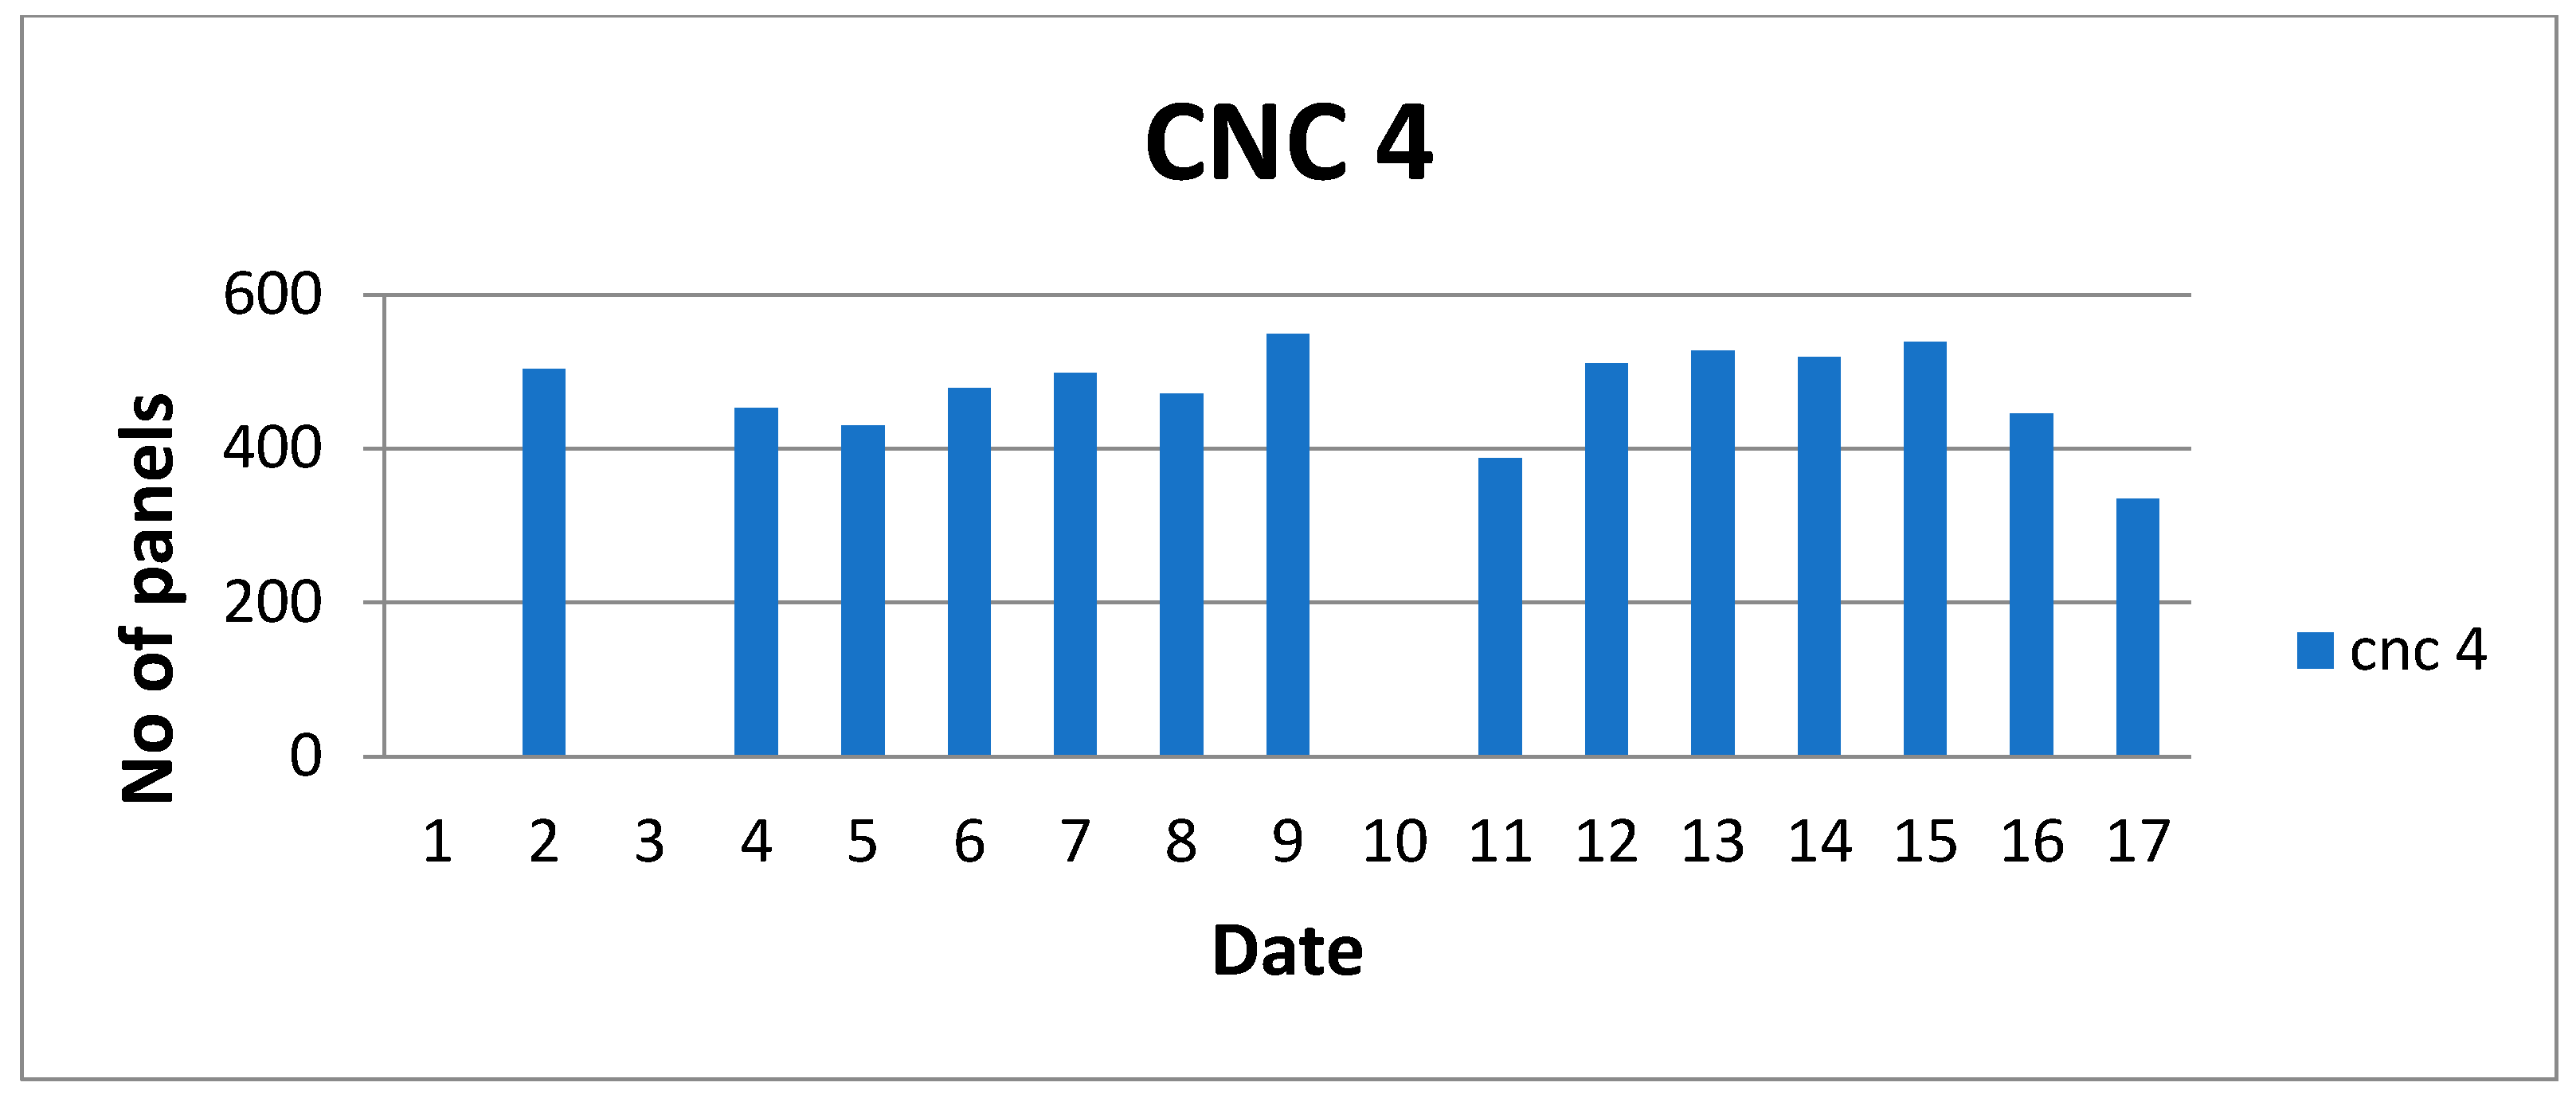
A CNC-wise breakdown of daily panel production (Figure 11, Figure 12, Figure 13 and Figure 14) further con-firmed the bottleneck at CNC-3. Several factors contributed to its reduced productivity, including frequent machine breakdowns and technical issues, a shortage of skilled workers available to operate CNC-3, high levels of rework caused by quality defects, scheduling inefficiencies, and frequent job changes. These Undesirable Effects (UDEs) were mapped in the Current Reality Tree (Figure 4), which illustrated how excessive rework, workforce shortages, and rescheduling collectively led to machine downtime and late deliveries.
Figure 11.
No. of panels vs. no. of date for CNC-1.
Figure 12.
No. of panels vs. no. of date for CNC-2.
Figure 13.
No. of panels vs. no. of date for CNC-3.
Figure 14.
No. of panels vs. no. of date for CNC-4.
4.3. Improvements After TOC Implementation
The application of TOC tools led to notable improvements in production performance. By exploiting CNC-3 through a reduced setup time, better scheduling, and staff reallocation, and by subordinating other CNCs to its capacity, the overall workflow became more balanced. Buffer management and Drum–Buffer–Rope (DBR) scheduling further stabilized operations. As a result, the total processing time across all product categories decreased, plant throughput increased, and delivery delays were reduced. For instance, the processing time for product P-1 dropped from 31,320 min to 29,760 min. Similar gains across other products highlight the direct impact of the TOC in enhancing efficiency and capacity utilization.
4.4. Managerial Implications and Discussion
This study highlights the TOC as a practical framework for managing production constraints in furniture manufacturing SMEs, enabling significant gains in throughput and cost efficiency without major investments. The findings are consistent with prior research—Azaria et al. [] on reducing delays in judicial systems, Tarte et al. [] on inventory and lead time improvements in automotive industries, and Okutmuş et al. [] on optimizing product mix in the furniture sector—demonstrating the TOC’s adaptability across industries. In the present case, implementation challenges such as workforce resistance, frequent CNC-3 breakdowns, and scheduling conflicts were gradually overcome through training, phased adoption, and process realignment, reinforcing TOC’s effectiveness in real-world settings.
4.5. Comparison Between CNC’s
- Production of CNC-1
- Production of CNC-2
- Production of CNC-3
- Production of CNC-4
The production data from CNC-1, CNC-2, CNC-3, and CNC-4 were analyzed. Graphs for February and March production confirmed CNC-3 as the bottleneck, consistently underperforming relative to the other machines. The comparative graphs (Figure 11, Figure 12, Figure 13 and Figure 14) collectively show CNC-3 lagging in throughput, the rate at which a system generates finished products or sales, confirming its role as the capacity constraint.
During the implementation of the TOC, the organization encountered numerous challenges, such as initial resistance from the workforce to alter established routines, a shortage of skilled operators, and recurrent breakdowns of CNC-3 that hindered progress. Managers also faced difficulties in reconciling long-standing scheduling policies with TOC-driven priorities, while the lack of real-time data systems complicated the monitoring of constraints. Furthermore, proposals aimed at alleviating constraints through new investments were met with concerns regarding costs. These obstacles were gradually overcome through training, awareness initiatives, and a phased implementation approach, which fostered acceptance as measurable performance improvements became apparent.
4.6. Comparison with Actual Data
Drum–Buffer–Rope (DBR) is a TOC scheduling mechanism to synchronize production with system constraints. A typical TOC/DBR implementation is an exciting experience, given that it involves the entire organization. In this work, the organization planning achieved spectacular results through the full implementation of TOC/DBR. The approach does work, and further enhancements to its tools and features will make implementation easier. A comparison of the time after applying the TOC is shown in Table 3. Figure 15 shows the time-wise production after applying the TOC in the organization.
Table 3.
Comparison of time after applying TOC.
Figure 15.
Time vs. product number.
5. Conclusions
The successful implementation of the Theory of Constraints (TOC) in a furniture manufacturing-based organization has led to measurable improvements in operational performance, including reduced replenishment time, increased plant efficiency, and enhanced overall productivity. By systematically identifying and addressing key bottlenecks—whether in machinery, labor, or process flow—the organization optimized resource utilization and streamlined production. One of the most notable outcomes was the significant reduction in replenishment time for raw materials and components, which contributed to a smoother production cycle and better alignment with customer demand. Simultaneously, plant efficiency improved due to better scheduling, the elimination of idle time, and improved coordination across departments, directly impacting throughput and on-time delivery rates.
Organization planning by implementing the TOC gives some significant results for the improvement of processes and exploits the constraints of an organization. CNC-3 has been identified as a constraint machine, and the calculated constraint minutes are -185. It increases the capacity of a constraint machine by 4361 min. in a week. Proper resource utilization is possible. By using the Theory of Constraints, it gives a breakthrough solution to all UDEs of the organization. This research underscores the potential of the TOC as a transformative tool for small and medium-sized furniture manufacturers aiming to remain competitive in a dynamic market. Looking ahead, the adoption of digital tools for the real-time monitoring of constraints and predictive analytics for proactive replenishment planning could further elevate plant performance and responsiveness.
Though commonly applied to physical constraints, TOC tools at SpaceWood Pvt. Ltd. showed potential as a practical approach for addressing organizational challenges, supporting management in problem resolution, planning, and decision-making.
Author Contributions
Conceptualization, K.U., L.C., H.M., D.S.P., S.M. and A.R.S.; Methodology, K.U., L.C., H.M. and A.R.S.; Software D.S.P., S.M. and A.R.S.; Validation, K.U., H.M. and A.R.S.; formal analysis, K.U., S.M. and A.R.S.; Investigation, K.U.; Resources, L.C. and P.K.D.; Data curation, K.U., L.C. and S.M.; Writing—original draft preparation, K.U.; Writing—review and editing, H.M. and P.K.D.; Supervision H.M. and A.R.S.; Project administration, L.C., H.M., D.S.P., S.M. and A.R.S.; Funding acquisition K.U., L.C., H.M., D.S.P., S.M., A.R.S. and P.K.D. All authors have read and agreed to the published version of the manuscript.
Funding
This research received no external funding.
Institutional Review Board Statement
Not applicable.
Informed Consent Statement
Not applicable.
Data Availability Statement
All data generated or analyzed during this study are included in this published article.
Acknowledgments
The authors are thankful to the team of Spacewood Furnishers Pvt. Ltd. T-48, MIDC, Hingna Road, Nagpur—440016, for providing the necessary information and kind support.
Conflicts of Interest
The authors declare no conflict of interest.
References
- Azaria, S.; Ronen, B.; Shamir, N. Justice in Time: A theory of constraints approach. J. Oper. Manag. 2023, 69, 1202–1208. [Google Scholar] [CrossRef]
- Tarte, N.; Suryawanshi, Y.; Batule, R. Implementation of Theory of Constraints for Cost Reduction in Manufacturing Industries: A Case Study. Online J. Distance Educ. e-Learn. 2023, 11, 2. [Google Scholar]
- Stopka, O.; Zitrický, V.; Ľupták, V.; Stopková, M. Application of specific tools of the Theory of Constraints—A case study. Cogn. Sustain. 2023, 2, 1. [Google Scholar] [CrossRef]
- Erraoui, Y.; Charkaoui, A. Analysis of Buffer techniques in Lean distribution and theory of constraints in a distribution context. J. Oper. Manag. Optim. Decis. Support 2023, 3, 11–15. [Google Scholar]
- Shashi, M. Sustainable Digitalization in Pharmaceutical Supply Chains Using Theory of Constraints: A Qualitative Study. Sustainability 2023, 15, 8752. [Google Scholar] [CrossRef]
- Mason-Jones, R.; Davies, P.G.; Thomas, A. Applying the Theory of Constraints to Explore the UK Renewable-Energy Supply Chain. Sustainability 2022, 14, 13307. [Google Scholar] [CrossRef]
- Zhao, X.; Hou, J. Applying the Theory of Constraints Principles to Tourism Supply Chain Management. J. Hosp. Tour. Res. 2022, 46, 400–411. [Google Scholar] [CrossRef]
- Urban, W.; Rogowska, P. Systematic Literature Review of Theory of Constraints. In Springer Reference Medizin; Springer: Berlin/Heidelberg, Germany, 2019; pp. 129–138. [Google Scholar] [CrossRef]
- Okutmuş, E.; Kahveci, A.; Kartasova, J. Using theory of constraints for reaching optimal product mix: An application in the furniture sector. Intellect. Econ. 2016, 9, 138–149. [Google Scholar] [CrossRef]
- Aramyan, L.H.; Oude Lansink, A.G.J.M.; van der Vorst, J.G.A.J.; van Kooten, O. Performance measurement in agri--food supply chains: A case study. Supply Chain. Manag. 2007, 12, 304–315. [Google Scholar] [CrossRef]
- Zivaljevic, A. Theory of constraints—Application in land transportation systems. Manag. Environ. Qual. Int. J. 2015, 26, 505–517. [Google Scholar] [CrossRef]
- Ukey, K.; Sawaitul, P.B. Organization planning using theory of constraints. J. Mech. Civ. Eng. 2021, 7, 1–5. [Google Scholar]
- Knop, K. Managing constraints in a machinery company using theory of constraints’ thinking process tools. case study. Prod. Eng. 2025, 33, 401–413. [Google Scholar] [CrossRef]
- Vanomy, A.E.; Engellika, G.; Jeffrey, J.; Vanessa, J.; Liliana, L.; Te, R.; Zhang, S.; Stendy, S.; Vina, V.; Viorensa, V. The Implementation of the Theory of Constraints (TOC) to Increase Production Cost Efficiency and Productivity: VAF Case Study. Profit J. Adminsitrasi Bisnis 2025, 19, 143–162. [Google Scholar]
- Pereira, G.B.; Soardi, G.; Attanasio, A.; Frazzon, E.M. Applying Theory of Constraints (TOC) to digital twins: Simulation and managerial outputs. Procedia CIRP 2025, 134, 717–722. [Google Scholar] [CrossRef]
- Mabin, V.J.; Cavana, R.Y. A framework for using Theory of Constraints thinking processes and tools to complement qualitative system dynamics modelling. Syst. Dyn. Rev. 2024, 40, e1768. [Google Scholar] [CrossRef]
- Gupta, M.; Digalwar, A.; Gupta, A.; Goyal, A. Integrating Theory of Constraints, Lean and Six Sigma: A framework development and its application. Prod. Plan. Control. 2024, 35, 238–261. [Google Scholar] [CrossRef]
Disclaimer/Publisher’s Note: The statements, opinions and data contained in all publications are solely those of the individual author(s) and contributor(s) and not of MDPI and/or the editor(s). MDPI and/or the editor(s) disclaim responsibility for any injury to people or property resulting from any ideas, methods, instructions or products referred to in the content. |
© 2025 by the authors. Licensee MDPI, Basel, Switzerland. This article is an open access article distributed under the terms and conditions of the Creative Commons Attribution (CC BY) license (https://creativecommons.org/licenses/by/4.0/).