Abstract
Digital Image Correlation systems are increasingly being used for non-contact measurement of deformation and strain in sheet metal components. However, the accuracy of such measurements can be significantly affected by various external and system-related factors. If these are not properly considered, substantial errors may be introduced. In this study, a short and longer flat sheet specimen were clamped in a vise to investigate how overhang and clamping stability influence the accuracy of the measured deformation fields. Two different measurement volumes were also evaluated to assess their effect on the results. These factors were evaluated through targeted experiments, and the resulting data were analyzed and interpreted. Based on the findings, recommendations were formulated to enhance the reliability of Digital Image Correlation measurements in both laboratory and industrial environments.
1. Introduction
3D optical measurement of sheet metal components is a key factor in advanced manufacturing, especially in the automotive, marine and aerospace industries, where their large size and thin walls can easily deform. Conventional coordinate-measuring machines (CMMs) are highly accurate but less suitable for inspecting large, complex parts with flexibility. In contrast, structured light 3D scanners enable fast, non-contact measurement, creating a point cloud covering the entire surface [1].
Accurate inspection of large sheets requires aligning measurements from multiple viewpoints, which presents technical challenges. Three-dimensional scanners, which are becoming increasingly common in industrial quality control, are particularly useful for parts with complex geometries, as they provide high-resolution, detailed and documentable results [2].
However, the definition of measurement accuracy is not always obvious, as manufacturers use different criteria. Therefore, it is essential to identify the physical and technological factors that affect measurement accuracy in order to optimize the selection and application of the appropriate technology [2,3].
The timing and frequency of calibration have a major impact on measurement accuracy. Mendricky et al. [2] have demonstrated that systems that have not been freshly calibrated exhibit significant variations, with up to twice the variation for sphere measurements and up to four times the variation for distance measurements. Regular calibration is, therefore, essential, even under stable conditions [2].
Accuracy is also affected by the quality of the calibration, the distribution and number of reference points and the angle position of the camera–projector [4]. Eiríksson et al.’s [5] study shows that continuous observation of the calibration chart at different angles (−40° to +40°) improves the estimation of camera internal parameters such as focal length [5]. The material of the calibration body is also an important factor. Ceramic, for example, can cause distortion due to light scattering. Research has shown that matt-finished titanium spheres give the most accurate results [6].
The measurement accuracy is significantly affected by the material, surface roughness and color of the object. Glossy, dark, reflective or poorly illuminated surfaces make accurate detection difficult, especially in curved or complex geometries where self-shading and burnt-out image areas can cause false spots [3,7,8]. For example, mirror-finished graduations were covered with a white matte tape to reduce glare, but this resulted in an oversize of 106 μm [7]. Additionally, the geometry, topography, and slope of the object limit the applicability of optical methods and solutions [3].
For accurate scanning of glossy surfaces, a matt coating is key. Mendricky et al. [2] demonstrated that a thicker layer of titanium dioxide slightly increases the diameter of the spheres but has a negligible effect on distance measurement. An uneven coating, on the other hand, causes noise and errors, so uniformity and professional application of the coating are essential [2].
Environmental conditions, such as temperature, humidity, lighting, and vibration, also significantly impact measurement accuracy [2]. The heat generated by the equipment can change the measured (apparent) distance between the camera and the projector, worsening the triangulation [7]. Impurities, such as chips or dust, can cause distorted results [9], while uncontrolled lighting increases measurement noise, particularly for sensitive systems [3].
The evaluation method also has a significant impact on the measurement results. In one study, the “Fitting Sphere” feature of GOM Inspect Professional software 2018, combined with Gaussian least squares and 3 × σ filtering, was utilized, which reduced noise and improved accuracy. It became evident that the evaluation procedure can directly influence the final measurement errors [2].
The capabilities of the measurement system are essentially determined by the optical resolution, the type of sensor and the operating principle [3]. The advantage of structured gloss 3D scanning is that it does not contain speckle noise, which is caused by the interaction of coherent light with a rough surface, unlike laser scanning, where the intensity of the light decreases rapidly with distance [8]. Measurement accuracy is also affected by the resolution and layout of the cameras. Dual camera systems provide higher accuracy due to the over-defined geometric model [8]. Structured light systems use Gray code and phase shift pattern projection for pixel identification. Their accuracy assumes the camera-projector position is constant [8].
Valkenburg et al. [4] have achieved significant improvements in spatial accuracy (82% on average) with subpixel and substripe estimates. The coding strategy of structured light is also crucial. According to Eiríksson et al. [5], the Phase Shift method is the most accurate, while the Gray Code and Line Shift methods have less distortion [5]. However, Gray code mapping is sensitive to the optical properties of the surface, so in price-sensitive or contrast-poor areas, incorrect decoding, outliers and model errors (e.g., holes) can occur [10].
User experience, the number of views, the scanning strategy, and post-processing steps (such as filtering and fitting) have a significant impact on measurement accuracy and can cause significant variation between measurements [7]. Guo et al. [9] emphasize that determining the exact spatial relationship between the sensor and the turntable is crucial [9]. In structured light scanning, distortion of the projection lens can also be a significant source of error [10].
The measurement of large sheet metal parts is of increasing importance nowadays, as the accurate determination of the thinning or thickness reduction is a key input parameter in finite element (FEM) simulations. This need has emerged with the advancement of electric vehicles, as the much quieter passenger compartment means that wheel rolling noise or other vibration-induced sounds are amplified more within the body, so that vibroacoustic simulations require increasingly accurate input models. Thickness reductions of a few hundredths of a millimeter can cause a multi-decibel difference between simulations and reality. These requirements necessitate precise measurement techniques, as measuring hundredths of millimeters on car bodies several meters long presents a distinct set of technical challenges compared to other measurements, as well as several technological and methodological challenges. This study aims to explore these measurement risks, with a particular focus on the applicability, accuracy and limitations of structured light 3D scanning in such conditions.
2. Materials and Methods
During the tests, the GOM ATOS TripleScan II optical 3D measuring system was used to perform the measurements. The GOM ATOS Triple Scan II is a structured, light-based, high-precision industrial optical 3D scanner widely used for various geometric measurement tasks, ranging from small electronic components to the inspection of large aircraft parts. The system operates on the principle of optical backscattering, where a projector projects a Gray-coded striped light pattern onto the surface of the object, which is then captured by two precisely calibrated cameras. The resulting images are used by the system to compute precise 3D coordinates, which are displayed by the software as a high-density point cloud. The blue-light-based technology minimizes ambient light interference, allowing the scanner to be used reliably even in a production line environment [11,12,13]. The GOM ATOS TripleScan II and the GOM TRITOP optical measurement systems were manufactured by GOM GmbH, located in Braunschweig, Germany.
For the measurements, the surfaces of the objects had to be prepared and, if necessary, coated with a matting layer to ensure a consistent surface. Reference points also needed to be placed on them to align the multidirectional surfaces. The resulting data can be used to conduct a detailed analysis of the deviation. Multidirectional scanning with a rotary table is particularly effective for bodies of revolution [14].
The system can be complemented with the GOM TRITOP photogrammetry system, which pre-identifies reference points, facilitating the alignment of different scan positions. This is particularly useful for larger objects, as it reduces the risk of alignment errors and speeds up the measurement process [12].
GOM ATOS Professional and GOM Inspect software provide automatic data processing, CAD comparison, and detailed analysis of cross-sectional deviations and local geometric errors. The main advantages of the system include a fast measurement process, non-contact inspection, high accuracy and automation [11].
In the experiment, measurements were carried out on a 1.27 mm thick DC04 (1.0338, DIN EN 10 130) sheet. DC04 steel is a cold-rolled, deep-drawn steel sheet with excellent formability, mainly used in the automotive industry. Due to its high purity and homogeneous structure, it is highly suitable for deep drawing and pressing. It is most commonly applied in the automotive industry for the production of bodyshell components such as doors, bonnets and boot lids.
The reason for using a completely flat, undeformed sheet in this research is that the continuously varying thinning of a deformed body sheet does not cause difficulties in detecting the expected measurement errors. When selecting the undeformed sheet, typical component dimensions commonly utilized in car body manufacturing were considered. The test pieces were 220 mm × 550 mm and 220 mm × 250 mm in size. The measuring gripping device was a conventional machine gripper, from which the length of the outrigger after gripping was 535 mm and 235 mm. The vibration and deflection of the sheet metal parts can be simulated by magnifying the sheet metal gripping in one place. This is necessary because, in practice, there is not always sufficient time and opportunity to design and manufacture a suitable measuring device for complex surface digitization measurements. The measurement results are needed for FEM simulations much faster than it would take to manufacture a device.
To measure the thickness of the reference sheet, a digital micrometer with a hemispherical probe for sheet thickness, Mitutoyo 395-251, was used, with a resolution of 0.001 mm. The micrometer was produced by Mitutoyo Corporation, based in Kawasaki, Japan. The results of the DIC (digital image correlation) measurement are compared with these reference results, which are shown in Figure 1, with an average of 1.27 mm. This is an acceptable value, as manufacturers typically specify a thickness tolerance of ±0.05 mm for this material grade.
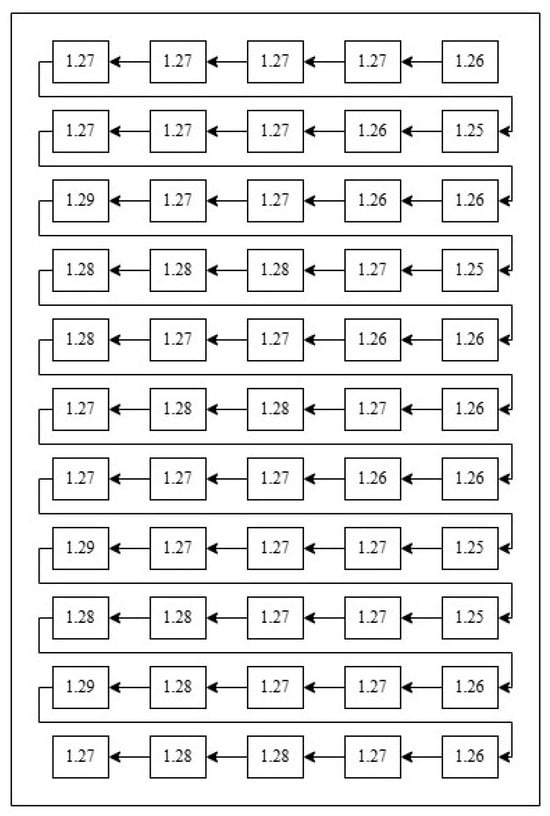
Figure 1.
Measured reference points with a Mitutoyo micrometer.
Once the reference values had been defined, the test matrix for this research was developed. To define the matrix, the first step was to select the applicable measurement ranges of the DIC system (shown in Table 1). One of the measurement ranges is MV170, with an accuracy of 7 µm, which is recommended for measuring changes in the expected tenths to hundredths of a millimeter. The other measurement range is MV560, which would be proposed based on the enclosing dimensions of the sheet metal parts. In addition to measuring each test with the measuring fixture, reference points are also determined in advance using the TRITOP measurement (i.e., GOM’s optical photogrammetry system), which enhances measurement accuracy. Reference points with a diameter of 0.8 mm, i.e., 3 mm, are applied to the surface of the test specimens for the MV170 and MV560 gauge ranges.

Table 1.
Measurement matrix.
The aim of this research is, therefore, to determine the optimal DIC settings and the measurement errors that occur during DIC measurements, which significantly affect the results when creating thickness maps or point clouds of body panels. The aim is to demonstrate that even without the use of a properly manufactured measuring device, it is possible to produce a sufficiently high-quality thickness analysis of body panels.
3. Results and Discussion
This section presents the measurement results as presented in the measurement matrix (Table 1). When evaluating the results, it is essential to consider that identifying and organizing the sources of measurement errors is crucial for obtaining reliable and repeatable results for each measurement. For each measurement in the test, the same sample is measured, with three repetitions in each case. The results presented in this section are averages of the measurements.
Table 2 summarizes the results of measurements with and without the TRITOP system, recorded under different extension settings and measurement conditions. The first row of results shows the average measurement results for the sheet thicknesses, and the second row shows the percentage deviation from the reference.
Table 2.
Differences in measured sheet thicknesses (AVG means average, ABS means absolute).
The results show that the worst measurement result within the MV170 range is the one without the TRITOP measurement, which has a larger overhang, with a deviation of 27.39%. The results also show that the MV170 range gives worse results than the MV560 range everywhere. This is presumably because the smaller measurement range requires capturing many more images, and errors from stitching together multiple images and from vibrations between capturing each image are magnified and added together.
The number of images taken is summarized in Table 3 for each measurement. Although the MV560 range is less accurate, it can yield more accurate results from a far smaller number of images and stitching. The larger measurement range incorporates measurements from an average of a quarter of the number of images, so the stitching inaccuracy is expected to be smaller, which improves the measurement results. It can also be seen from the results that the TRITOP photogrammetry improves the accuracy of both measurement ranges.
Table 3.
Number of pictures taken during the measurement cycle.
The diagrams in Figure 2 and Figure 3 show the measured points on the surface. In both cases, the reference sheet thickness of 1.27 mm is marked by a red, thick line.
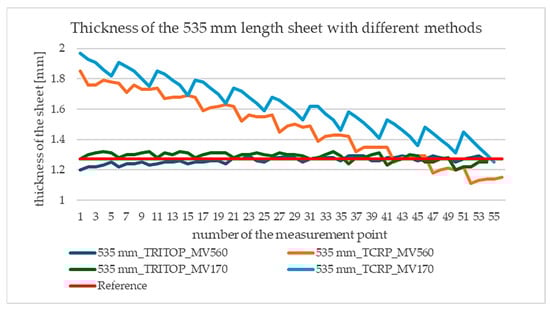
Figure 2.
Thickness of the 535 mm length sheet with different methods.
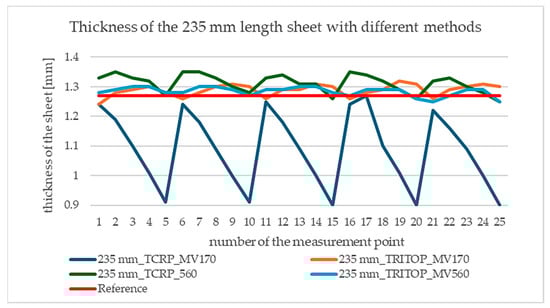
Figure 3.
Thickness of the 235 mm length sheet with different methods.
The most striking is the “sawtooth” behavior of the graphs (Figure 2 and Figure 3), which is caused by the camera moving from right to left during the measurement, so the error on the surface increases from right to left, but the measurement points always move from right to left in sequence, causing a jump in the curve. This illustrates that the error in the thickness measurement is not constant on the surface but is also related to the direction of “travel” of the measurement.
As shown in Figure 4, the GOM ATOS system has a similar order of measurement points to those on the reference measurement using the micrometer (Figure 1). When collecting the results for each measurement, they were recorded sequentially from top to bottom on the sheet surface.
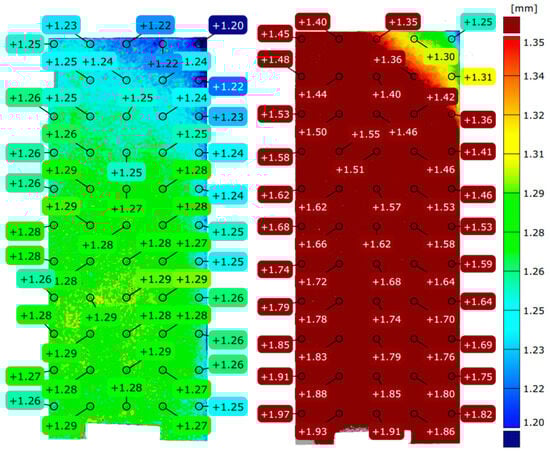
Figure 4.
Thickness of the 535 mm length sheet with MV560, TRITOP on the left side and MV170, TCRP on the right side.
From the diagrams and the color map evaluation, it can be seen that there is a “transition” thickness change during the measurement, which is clearly not the case in reality. This confirms that the measurement strategy plays a crucial role, as the camera is constantly moving, introducing increasing errors in the measurement. However, this can only be eliminated by photogrammetric pre-measurement of the reference points, as the surface digitization will then “pre-know” these measurement points. Unfortunately, the characteristic of sheet metal parts is that they have little shape accuracy, so reference points must be used almost always, unlike an amorphous solid.
The results also illustrate that, by using the TRITOP system, instrumentation can be omitted or even replaced when creating a general thickness map. Of course, the use of devices cannot be avoided when checking positions or mounting positions.
It is essential to note that these errors are less likely to occur when measurements are made in mass production, where properly manufactured instruments are utilized. However, with the advances of surface scanners and their easy availability, there is an increasing number of custom part measurements, even where the operator is not adequately trained. The current research highlights that significant errors can be introduced into the measurement process of thickness maps due to inappropriate gripping and measurement strategies or poorly chosen measurement ranges in sheet thickness measurement.
4. Conclusions
The results of the current study have demonstrated that the DIC measurement technique greatly facilitates the preparation of full-surface thickness images and point clouds of body panel components; however, these tests also carry several risks. It has been demonstrated that handling errors can cause measurement errors of up to 30%, which are not always evident in the results. It has been confirmed that the more inaccurate MV560 measurement set, made from fewer measurement images, can yield better results, even with faulty gripping, as the deviations from the reference were around 1%, which is considered an appropriate result. The research has therefore demonstrated that, with a well-chosen measurement strategy, it is possible to obtain adequate-thickness images for FEM simulations without the need for a custom-designed measuring device.
Future research should focus on refining mathematical-statistical models [15,16,17], such as fuzzy method solutions [18,19], and conducting further full-scale tests to validate the system’s performance. This study lays the basis for a new generation of smart infrastructure capable of maintaining optimal performance under varying conditions.
Author Contributions
Conceptualization, V.N., B.F.S., S.S. and S.F.; methodology, V.N., B.F.S., S.S. and S.F.; software, V.N., B.F.S., S.S. and S.F.; validation, V.N., B.F.S., S.S. and S.F.; formal analysis, V.N., B.F.S., S.S. and S.F.; investigation, V.N., B.F.S., S.S. and S.F.; resources, V.N., B.F.S., S.S. and S.F.; data curation, V.N., B.F.S., S.S. and S.F.; writing—original draft preparation, V.N., B.F.S., S.S. and S.F.; writing—review and editing, V.N., B.F.S., S.S. and S.F.; visualization, V.N., B.F.S., S.S. and S.F.; supervision, V.N., B.F.S., S.S. and S.F.; project administration, V.N., B.F.S., S.S. and S.F.; funding acquisition, V.N., B.F.S., S.S. and S.F. All authors have read and agreed to the published version of the manuscript.
Funding
This research received no external funding.
Institutional Review Board Statement
Not applicable.
Informed Consent Statement
Not applicable.
Data Availability Statement
All data are available within the paper.
Acknowledgments
This paper was prepared by the research team “SZE-RAIL”. This research was supported by the SIU Foundation’s project ‘Sustainable Railways—Investigation of the energy efficiency of electric rail vehicles and their infrastructure’.
Conflicts of Interest
The authors declare no conflicts of interest.
References
- Du, H.; Chen, X.; Xi, J.; Yu, C.; Zhao, B. Development and Verification of a Novel Robot-Integrated Fringe Projection 3D Scanning System for Large-Scale Metrology. Sensors 2017, 17, 2886. [Google Scholar] [CrossRef] [PubMed]
- Mendricky, R. Determination of Measurement Accuracy of Optical 3D Scanners. MM Sci. J. 2016, 2016, 1565–1572. [Google Scholar] [CrossRef]
- Engel, T. 3D optical measurement techniques. Meas. Sci. Technol. 2022, 34, 032002. [Google Scholar] [CrossRef]
- Valkenburg, R.J.; McIvor, A.M. Accurate 3D measurement using a structured light system. Image Vis. Comput. 1998, 16, 99–110. [Google Scholar] [CrossRef]
- Eiríksson, E.R.; Wilm, J.; Pedersen, D.B.; Aanæs, H. Precision and accuracy parameters in structured light 3-D scanning. Int. Arch. Photogramm. Remote Sens. Spat. Inf. Sci. 2016, 5, 7–15. [Google Scholar] [CrossRef]
- Dickin, F.; Pollard, S.; Adams, G. Mapping and Correcting the Distortion of 3D Structured Light Scanners. Precis. Eng. 2021, 72, 543–555. [Google Scholar] [CrossRef]
- Bernal, C.; De Agustina, B.; Marín, M.M.; Camacho, A.M. Performance Evaluation of Optical Scanner Based on Blue LED Structured Light. Procedia Eng. 2013, 63, 591–598. [Google Scholar] [CrossRef]
- Jecić, S.; Drvar, N. The Assessment of Structured Light and Laser Scanning Methods in 3D Shape Measurements. In Proceedings of the 4th International Congress of Croatian Society of Mechanics, Šibenik, Croatia, 18–21 September 2003; pp. 237–244. Available online: https://citeseerx.ist.psu.edu/document?repid=rep1&type=pdf&doi=f213d47377e716f62f281ae0c2f64c746ed40e4e (accessed on 15 May 2025).
- Guo, X.; Shi, Z.; Yu, B.; Zhao, B.; Li, K.; Sun, Y. 3D Measurement of Gears Based on a Line Structured Light Sensor. Precis. Eng. 2020, 61, 160–169. [Google Scholar] [CrossRef]
- Yang, R.; Cheng, S.; Yang, W.; Chen, Y. Robust and Accurate Surface Measurement Using Structured Light. IEEE Trans. Instrum. Meas. 2008, 57, 1275–1280. [Google Scholar] [CrossRef]
- Rokicki, P.; Budzik, G.; Kubiak, K.; Dziubek, T.; Zaborniak, M.; Kozik, B.; Bernaczek, J.; Przeszlowski, L.; Nowotnik, A. The Assessment of Geometric Accuracy of Aircraft Engine Blades with the Use of an Optical Coordinate Scanner. Aircr. Eng. Aerosp. Technol. 2016, 88, 374–381. [Google Scholar] [CrossRef]
- Szalai, S.; Eller, B.; Juhász, E.; Movahedi, M.R.; Németh, A.; Harrach, D.; Baranyai, G.; Fischer, S. Investigation of Deformations of Ballasted Railway Track during Collapse Using the Digital Image Correlation Method (DICM). Rep. Mech. Eng. 2022, 3, 168–191. [Google Scholar] [CrossRef]
- Li, F.; Stoddart, D.; Zwierzak, I. A Performance Test for a Fringe Projection Scanner in Various Ambient Light Conditions. Procedia CIRP 2017, 62, 400–404. [Google Scholar] [CrossRef]
- Marciniec, A.; Budzik, G.; Dziubek, T.; Grzelka, M. Quality Control and Inspection of Bevel Gears of the Aircraft Gearbox Utilizing the ATOS 3D Scanner. J. KONES Powertrain Transp. 2012, 19, 261–266. [Google Scholar] [CrossRef]
- Ézsiás, L.; Tompa, R.; Fischer, S. Investigation of the possible correlations between specific characteristics of crushed stone aggregates. Spectr. Mech. Eng. Oper. Res. 2024, 1, 10–26. [Google Scholar] [CrossRef]
- Fischer, S. Investigation of the Settlement Behavior of Ballasted Railway Tracks Due to Dynamic Loading. Spectr. Mech. Eng. Oper. Res. 2025, 2, 24–46. [Google Scholar] [CrossRef]
- Fischer, S.; Hermán, B.; Kocsis Szürke, S. Possibilities for determining the energy consumption of electric locomotives during acceleration and constant-speed traction. Cogn. Sustain. 2025, 4, 154. [Google Scholar] [CrossRef]
- Biswas, S.; Božanić, D.; Pamučar, D.; Marinković, D. A spherical fuzzy based decision making framework with Einstein aggregation for comparing preparedness of SMES in quality 4.0. Facta Univ. Ser. Mech. Eng. 2023, 21, 453–478. [Google Scholar] [CrossRef]
- Mishra, A.R.; Rani, P.; Cavallaro, F.; Alrasheedi, A.F. Assessment of sustainable wastewater treatment technologies using interval-valued intuitionistic fuzzy distance measure-based MAIRCA method. Facta Univ. Ser. Mech. Eng. 2023, 21, 359–386. [Google Scholar] [CrossRef]


Disclaimer/Publisher’s Note: The statements, opinions and data contained in all publications are solely those of the individual author(s) and contributor(s) and not of MDPI and/or the editor(s). MDPI and/or the editor(s) disclaim responsibility for any injury to people or property resulting from any ideas, methods, instructions or products referred to in the content. |
© 2025 by the authors. Licensee MDPI, Basel, Switzerland. This article is an open access article distributed under the terms and conditions of the Creative Commons Attribution (CC BY) license (https://creativecommons.org/licenses/by/4.0/).