Abstract
The optimal configuration of perception systems in autonomous vehicles is essential for accurate environmental sensing, precise navigation, and overall operational safety. In Formula Student Driverless (FSD) vehicles, sensor placement is particularly challenging due to the compact design constraints and the highly dynamic nature of the racing environment. This study investigates the positioning and configuration of two LIDAR sensors and a stereo camera on an FSD race car, focusing on field-of-view coverage, sensing redundancy, and sensor fusion potential. To achieve a comprehensive evaluation, measurements are conducted exclusively in a simulation environment, where field-of-view maps are generated, detection ranges are analyzed, and perception reliability is assessed under various conditions. The results provide insights into the optimal sensor arrangement that minimizes blind spots, maximizes sensing accuracy, and enhances the efficiency of the autonomous vehicle’s perception architecture.
1. Introduction
The Formula Student competition is one of the world’s largest engineering design contests for university students, with over 1000 teams participating globally. Within this framework, student teams design, build, and test small-scale Formula-style race cars under a shared technical rulebook. The autonomous branch of the competition, known as Formula Student Driverless (FSD), was introduced in 2017 at the Formula Student Germany event, and currently approximately 150–200 teams participate in this category worldwide [].
As a former member of the Arrabona Racing Team (ART) at Széchenyi István University, we were involved in the development of a conventional driver-controlled race car built entirely from scratch, which was called ART_06, shown in Figure 1. In our current roles as research engineers at the university, we are leading the conversion of this vehicle into a fully autonomous platform. This research focuses on the optimization of sensor placement and sensor fusion strategies in a Formula Student Driverless context.
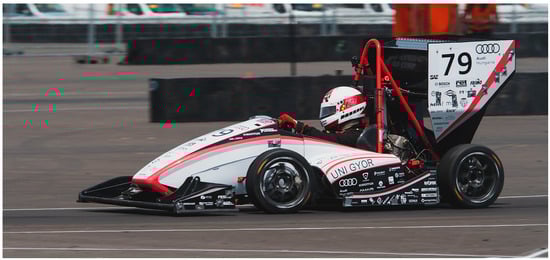
Figure 1.
ART_06 on Formula Student East 2019.
The modified vehicle is equipped with three key sensors: a Livox HAP T1 LiDAR (Shenzhen, China) mounted on the vehicle’s front, an Ouster OS1-64 BH LiDAR (San Francisco, CA, USA), and a StereoLabs ZED2 stereo camera (San Francisco, CA, USA), which are both mounted on the main hoop. Each sensor is mounted with adjustable brackets allowing tilt angles of ±5°, enabling the fine-tuning of sensor orientation.
2. Main Concept and Goals
One of the primary objectives of this research—in collaboration with the Arrabona Racing Team (ART)—is to develop an autonomous driving platform that can be integrated into a Formula Student race car for participation in the Driverless category.
The ART has extensive experience in designing and building competitive electric race cars. The team has recently transitioned to the Electric Vehicle (EV) category, which facilitates the integration of autonomous systems from an energy and control perspective. However, they currently lack the resources required to design and implement a fully functional autonomous driving system. To address this challenge, we decided to develop the autonomous platform independently, using a lower-performance experimental vehicle. This “dummy” test car is equipped with a simplified electric drivetrain to reduce complexity and eliminate the need for in-depth powertrain development during initial testing [].
As a first step, we thoroughly reviewed the technical rulebook issued by Formula Student Germany—who is the rule-maker for the European Formula Student competitions—to identify the allowed and prohibited system architectures, sensor setups, and functional safety constraints for autonomous operation [].
Solutions of AMZ Racing
In the next phase of the project, we analyzed how other Formula Student Driverless teams approached the challenge of autonomous perception and control. We investigated their sensor configurations, algorithmic strategies, and overall system architectures.
One of the pioneering teams in this field was AMZ Racing from ETH Zürich, who introduced their first driverless vehicle in 2017, shown in Figure 2. They continued refining the same core algorithmic structure until 2019, while experimenting with various sensor setups. Their configuration included a front-mounted LiDAR and a custom-developed camera system installed on the main hoop, combining monocular and stereo cameras. The monocular setup was used for long-range cone detection, while the stereo camera supported more accurate localization at closer range [,].
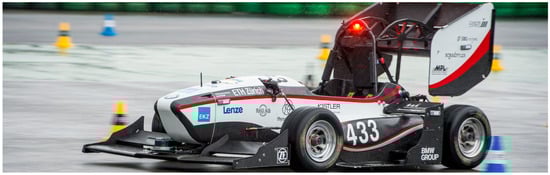
Figure 2.
AMZ Racing flüela driverless car at Formula Student Germany 2017 (https://www.sbg-systems.com/case-studies/driverless-racing-car/ (accessed on 5 May 2025).
Through both simulation and real-world testing, they concluded that to reach the vehicle’s performance, the system needed to predict the track layout at least 2 s ahead. Given that the maximum speed of these cars is around 110 km/h, this corresponds to a required perception range of approximately 61.1 m. However, this exceeds the effective range of most onboard sensors, especially considering that the maximum allowed straight section on an FS track is 80 m [,].
To address this, AMZ adopted a two-phase approach: first, the car completes a few slower laps in SLAM mode, during which it builds a map of the track; then, in subsequent laps, the vehicle uses this map for trajectory planning and high-speed navigation. For perception, they limited the effective range of their sensors to about 15–20 m, ensuring a higher resolution and more reliable detections within that range [,,].
3. ART_06 Mechanical Conversation
As mentioned earlier, we developed a dummy test car, using it for algorithm and control method development. It will have a 48V tractive system with a performance of 3 kW, and belt drive. The actuations of the steering system and braking system were already planned and built in. [] The next step was choosing the sensors we would like to use. Based on further investigation, we chose the following sensor setup:
- Livox HAP T1 LiDAR on the nosecone.
- Ouster OS1 64ch Below Horizon LiDAR on the main hoop.
- StereoLabs ZED2 stereo camera on the main hoop.
- Carnegie Robotics DURO GPS (Pittsburgh, PA, USA) on the back of the car.
- MicroStrain 3DM GX5-AHRS Inertial Measurement Unit (IMU) (Williston, VT, USA) close to the center of gravity of the car.
The GPS and the IMU have a solid bracket to the frame; therefore it is not possible to adjust their position. However, for the LiDARs and camera we made a bracket, which allows +/−5° tilting, for the fine-tuning of the position. The car with the sensor applicated is shown in Figure 3.
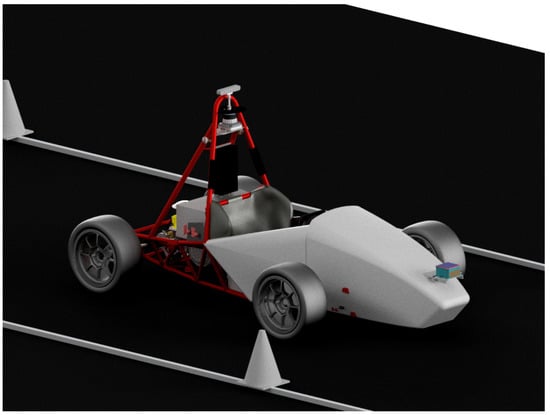
Figure 3.
ART_06 with sensors applicated.
Testing Environment for Positions’ Fine-Tuning
As mentioned earlier, we need to focus our sensor on the range of 15–20 m. For this, we made, with parametric modeling software (Autodesk Inventor 2023), the model of the car and the environment, like the ground, cones, lines. We made the environment akin to how a proper Formula Student track is built. The width of the track is 3 m, the distance between the cones is 5 m, and the shape of the cones is the same, as described in the Formula Student Germany Handbook []. We adjust the sensors, in the range of −5–5°, with a 1° step. We used the Inventor Studio to put the cameras’ Point-of-View (POV) on dedicated locations, which were chosen according to the user manuals of the sensors. We adjusted the sensors’ field-of-view using the user manuals. We made targets on the ground, which were so high that we were able to obtain the exact tilting angles.
4. Position Evaluation Methodology
We exported the POVs of the three sensors. After that the evaluation is based on three main visual metrics:
- Vehicle body obstruction.
- Sky coverage ratio.
- Cone detection clarity.
For choosing the optimal position we made a scoring system, based on the three main visual metrics. Each parameter was scored on a discrete 1–3 scale, where
- 1 indicated a poor performance (e.g., heavy occlusion or no visible cones);
- 2 indicated an acceptable but suboptimal performance;
- 3 represented optimal conditions (clear view, minimal sky, distinct cones).
The scores for the three categories were then summed to yield a total score out of 9 for each sensor and mounting angle combination. In the following chapters we detail the evaluated sensors.
In the context of this study, the term optimal refers to the sensor mounting configuration that maximizes the perception system’s ability to detect and classify relevant track elements within the effective operating range (3–20 m), while minimizing irrelevant or noisy visual information. The three evaluation metrics—vehicle body obstruction, sky coverage ratio, and cone detection clarity—were selected as they directly influence the reliability and consistency of object detection algorithms used in Formula Student Driverless perception pipelines [,]. High vehicle-induced occlusion reduces the number of detectable points on critical objects, excessive sky coverage can introduce false detections or wasted processing capacity, and poor cone clarity directly impairs the accuracy of localization and path planning. By combining these factors into a unified scoring system, the methodology provides a practical, quantifiable means to compare different sensor tilt angles and select the configuration most conducive to robust perception performance [,,,].
4.1. ZED2 Camera
We started by comparing the positions of the ZED2 camera. In Figure 4, the end positions of the stereo camera are shown.
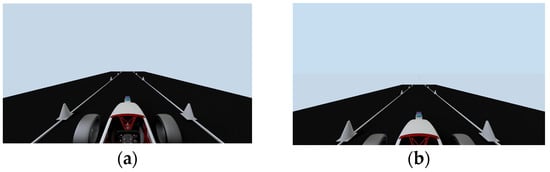
Figure 4.
POV of ZED2 camera in −5° (a) and in +5° (b).
Comparing Figure 4a,b, we can see, in the −5° position, that the vehicle has more obstruction but a lower sky ratio. For us, it is more important that we have less vehicles because it can cause accuracy problems and the detection would not be effective near the car.
In the lower tilt range (−5° to −2°), the camera’s FOV was heavily obstructed by the vehicle’s front bodywork, resulting in significant occlusion and reduced cone visibility. The total scores in this range remained around 5 out of 9, indicating a suboptimal performance.
Between 0° and +2°, the occlusion decreased and cone visibility improved moderately. However, the upper part of the image often contained a relatively large sky region, slightly lowering the overall utility of the sensor’s output. These positions typically received scores of 6/9.
The highest total scores (7/9) were achieved at +3° to +4° tilt angles. At these inclinations, the camera’s view was largely unobstructed, the cones appeared clearly within the effective depth perception range (3–20 m), and the sky region was present but not excessive.
4.2. Ouster OS1 LiDAR
The Ouster OS1 LiDAR demonstrated a consistently strong performance across the evaluated tilt angles. Thanks to its wide vertical and horizontal FOV, the sensor provided robust scene coverage even in less-than-ideal orientations. The end positions are shown in Figure 5.
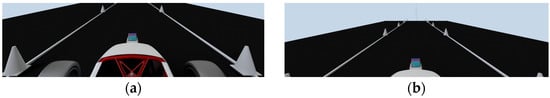
Figure 5.
POV of OS 1 LiDAR in −5° (a) and in +5° (b).
At −5° to −2°, although the sensor still maintained visibility of the surrounding environment, the FOV was partially obstructed by the vehicle frame, and the cone point-cloud became sparser at longer distances. These angles scored 6 out of 9.
From 0° to +1°, the visibility improved notably and the cone shapes became more distinct. However, in these orientations, a small portion of the vehicle’s upper body or frame still partially occluded the lower image region.
The best results were achieved at +2° to +3°, where the sensor had clear forward visibility with minimal obstruction and consistently strong cone point definition. These positions received 8/9 scores, the highest among all evaluated positions.
At +4° and +5°, cone visibility slightly declined due to an increased sky portion within the FOV and the cones appearing lower in the scan range.
4.3. Livox HAP T1 LiDAR
The Livox HAP T1, having a narrower vertical FOV than the OS1, was more sensitive to sensor orientation. Across the tested angles, its performance was relatively stable but never outstanding, largely due to limited spatial coverage and low-resolution cone visualization at longer distances. The end positions are shown in Figure 6.
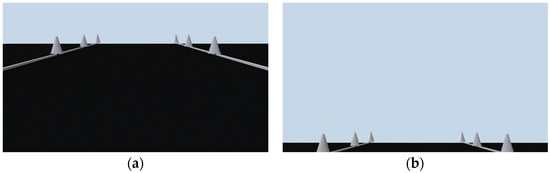
Figure 6.
POV of Livox LiDAR in −5° (a) and in +5° (b).
In the positive tilt range (+1° to +5°), the sensor’s FOV included a significant portion of the sky, reducing the number of points captured on relevant features near the ground. The cone visibility suffered accordingly, and total scores remained in the 5 out of 9 range.
Between −3° and −1°, performance improved modestly. The downward inclination reduced sky dominance and shifted the FOV closer to the ground plane. Still not achieving high-resolution detections, these positions allowed for a more consistent cone presence in the scan. These configurations reached 6/9 total scores, the best among all evaluated angles for this sensor.
5. Summary of the Results and Conclusions
This study investigated the impact of sensor tilt angle on perception quality in a Formula Student Driverless context, focusing on three specific visual evaluation criteria: vehicle-induced occlusion, sky region dominance, and cone visibility. Each sensor configuration was scored on a 1–3 scale per criterion, with a total score out of 9 representing overall effectiveness at each tilt angle.
The results demonstrate that optimal tilt angles vary significantly by sensor type, and selecting the appropriate configuration is critical to achieve robust perception at 3–20 m.
Based on the evaluation, the recommended tilt angles are summarized in Table 1 and are shown in Figure 7.

Table 1.
Scores of the recommended tilt angles.
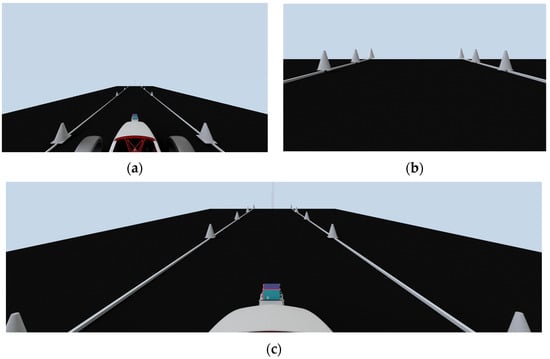
Figure 7.
POV of ZED2 in +3° (a) and POV of Livox in −3° (b) and POV of OS1 in +3° (c).
These angles offer the best trade-off between visibility and visual noise for each sensor. The ZED2 stereo camera benefits from a forward tilt to improve ground-level cone depth perception, while the OS1-64 LiDAR performs best at a slightly lower angle for maximum forward coverage. The Livox HAP T1, with its narrow vertical FOV, achieves better results when slightly tilted downward, minimizing sky exposure and focusing on short-range features.
The ZED2 and OS1 have a common mounting console, so we have to find a compromise. The results support a shared mounting angle of +3° for the ZED2 and OS1, as a practical compromise with minimal performance loss. The Livox unit should be mounted independently at a more downward-facing orientation.
Beyond the Formula Student context, these findings contribute to a broader understanding of sensor placement optimization in autonomous vehicle perception systems. While this study used a controlled, simulation-based track environment, the principles identified—balancing occlusion, vertical field-of-view allocation, and target feature visibility—are directly transferable to other autonomous platforms. For instance, road-going self-driving cars, agricultural robots, and industrial automated guided vehicles all face similar challenges in optimizing sensor geometry to ensure the reliable detection of critical objects while minimizing irrelevant scene content [,,,].
The potential applications and use cases of the methodology and results include the following:
- Urban autonomous driving: optimizing sensor tilt to better detect pedestrians, cyclists, and road furniture at short to medium ranges in cluttered city environments.
- Highway autonomous navigation: ensuring that LiDAR and camera configurations minimize sky or vehicle body occlusion at long detection ranges for improved lane and vehicle tracking.
- Off-road and agricultural autonomy: adjusting sensor orientation for improved terrain feature detection and obstacle avoidance on uneven ground.
- Low-speed maneuvering and parking systems: enhancing short-range cone or curb detection for tight space navigation.
By providing a structured scoring framework for visual metrics, the approach demonstrated here can serve as a practical design and calibration guideline for diverse autonomous vehicle applications, supporting improved perception reliability, safety, and operational efficiency.
Author Contributions
Conceptualization, methodology, validation, formal analysis, and visualization, M.K. and L.I.O.; writing—draft preparation, M.K.; supervision, project administration, funding acquisition, Z.P. All authors have read and agreed to the published version of the manuscript.
Funding
The research was supported by the European Union within the framework of the National Laboratory for Autonomous Systems (RRF-2.3.1-21-2022-00002).
Institutional Review Board Statement
Not applicable.
Informed Consent Statement
Not applicable.
Data Availability Statement
Data for this study is not publicly available.
Acknowledgments
The authors would like to express their sincere gratitude to the Arrabona Racing Team (ART) for providing access to the Formula Student vehicle used in this study. Special thanks are also due to the Vehicle Research Centre of Széchenyi István University for granting access to prior experimental data, which supported the evaluation process.
Conflicts of Interest
The authors declare no conflict of interest.
References
- Tian, H.; Hu, J.N.É.J. Autonomous Driving System Design for Formula Student Driverless Racecar. In Proceedings of the 2018 IEEE Intelligent Vehicles Symposium (IV), Changshu, China, 26–30 June 2018; pp. 1–6. [Google Scholar]
- Agnihotri, A.; O’Kelly, M.; Abbas, R.M.É.H. Teaching Autonomous Systems at 1/10th-Scale: Design of the F1/10 Racecar, Simulators and Curriculum. In Proceedings of the 51st ACM Technical Symposium on Computer Science Education (SIGCSE), Portland, OR, USA, 11–14 March 2020; ACM: New York, NY, USA, 2020; pp. 657–663. [Google Scholar]
- Formula Student Germany. Formula Student Rules 2025; Formula Student Germany: Bad Abbach, Germany, 2025. [Google Scholar]
- Valls, d.l.I.M.; Hendrikx, H.F.C.; Reijgwart, V.; Meier, F.V.; Sa, I.; Dubé, R.; Gawel, A.R.; Siegwart, M.B.É.R. Design of an Autonomous Racecar: Perception, State Estimation and System Integration. arXiv 2018, arXiv:1804.03252. [Google Scholar] [CrossRef]
- Kabzan, J.; Valls, d.l.I.M.; Reijgwart, V.J.F.; Hendrikx, H.F.C.; Ehmke, C.; Prajapat, M.; Bühler, A.; Gosala, N.; Gupta, M.; Sivanesan, R.; et al. AMZ Driverless: The Full Autonomous Racing System. J. Field Robot. 2020, 37, 1267–1294. [Google Scholar] [CrossRef]
- Engel, J.; Cremers, T.S.É.D. LSD-SLAM: Large-Scale Direct Monocular SLAM. In Proceedings of the Computer Vision—ECCV 2014, Zurich, Switzerland, 6–12 September 2014; Fleet, D., Pajdla, T., Tuytelaars, B.S.É.T., Eds.; Springer Int. Publishing: Cham, Switerland, 2014; pp. 834–849. [Google Scholar]
- Kapocsi, M. Formula Student Race Car Mechanical Redesign to Support Self-Driving Functions; Széchenyi István Egyetem: Győr, Hungary, 2024. (In Hungarian) [Google Scholar]
- Formula Student Germany. FSG Competition Handbook 2025; Formula Student Germany: Bad Abbach, Germany, 2025. [Google Scholar]
- Xiang, C.; Feng, C.; Xie, X.; Shi, B.; Lu, H.; Lv, Y.; Yang, M.; Niu, Z. Multi-Sensor Fusion and Cooperative Perception for Autonomous Driving: A Review. IEEE Intell. Transport. Syst. Mag. 2023, 15, 36–58. [Google Scholar] [CrossRef]
- Wang, Z.; Niu, Y.W.É.Q. Multi-Sensor Fusion in Automated Driving: A Survey. IEEE Access 2020, 8, 2847–2868. [Google Scholar] [CrossRef]
Disclaimer/Publisher’s Note: The statements, opinions and data contained in all publications are solely those of the individual author(s) and contributor(s) and not of MDPI and/or the editor(s). MDPI and/or the editor(s) disclaim responsibility for any injury to people or property resulting from any ideas, methods, instructions or products referred to in the content. |
© 2025 by the authors. Licensee MDPI, Basel, Switzerland. This article is an open access article distributed under the terms and conditions of the Creative Commons Attribution (CC BY) license (https://creativecommons.org/licenses/by/4.0/).