Abstract
For L-PBF (Laser Powder Bed Fusion) metal additive manufacturing (AM) the choice of available materials is still limited. 1.2709 maraging steel powders are widely used for injection molds and high-quality engineering parts. The quality of the parts produced by L-PBF are significantly affected by the process parameters. The aim of this research was to find optimal process parameters for producing 1.2709 tool steel at a layer thickness of 20 µm and to reveal the possible parameter settings yielding comparable build quality as the “EOS surface” parameter set at a layer thickness of 20 µm. Findings showed that too low or too high input energies produce improper parts. A large range of parameters produce good quality parts, of which the optimum parameters can be chosen.
1. Introduction
Layer manufacturing methods first appeared in the late 1980s. Nowadays, this technology is used in several industries, where various processes use “layer manufacturing”. Scientific and practical literature identifies this technology with different denominations, such as 3D printing, additive manufacturing (AM), direct digital manufacturing, and rapid prototyping. L-PBF processing is the most common AM technology used to produce metal parts. Selective Laser Melting (SLM) and Direct Metal Laser Sintering (DMLS) are the two main L-PBF processes. Both use a focused laser beam to melt fine metallic powder particles together with respect to the layer geometry. Due to the ability of the L-PBF machines to produce detailed 3D parts with high strength [,,], it has found applications in various sectors such as medical [], injection molding [], and automotive [], as well as producing general-purpose mechanical parts [].
In general, the initially set melting parameters are kept constant during laser additive manufacturing. In L-PBF additive manufacturing, the metal powder is spread in layers with a certain layer thickness (building height), typically in the range of 20–60 µm []. A number of papers deal with the topic of how layer thickness, laser power, and scanning speed influence the mechanical properties of L-PBF parts. Adb–Elghany and Bourell [] fabricated samples with a layer thickness of 30 µm, 50 µm, and 70 µm from stainless steel powder. At a layer thickness of 70 µm, porosity increased significantly. Mugwagwa et al. [] analyzed the influence of the main process parameters on the density of 18Ni300 samples. The authors concluded that high porosity occurs due to both overheating and insufficient heating. The smallest porosity values were found in samples manufactured at 600 mm/s and 180 W. In another study [], process parameters for production with a layer thickness of 100 µm were investigated. The maximum relative density was obtained with 340 W laser power and 500 mm/s scanning speed.
Manufacturers of L-PBF machines supply different parameter sets for a given material used in the process. EOS GmbH recommends using the parameter set named “EOS MS1_02_X surface” at a layer thickness of 20 µm for their EOSINT M270 machine, but the parameter values are not public. Thus, the central idea of the present study was to reveal the possible parameter settings yielding comparable build quality as the “EOS surface” parameter set at a layer thickness of 20 µm.
2. Materials and Methods
Samples were prepared from 18Ni300 (1.2709) maraging steel powder (supplied by EOS GmbH) by L-PBF. The powder used for the specimens was reclaimed from prior jobs with the use of an 80 μm sieve. The samples in this study were produced using an EOSINT M270 machine (EOS GmbH–Krailling/Munich, Germany; 200 W, 1070 nm Yb-fiber laser, and 100 µm focus diameter), which was used with a 20 μm layer thickness in a nitrogen gas atmosphere.
Cubic samples of ~125 mm3 were produced, as shown in (Figure 1) for the study. A reference was printed with EOS MS1_02_101 surface parameters, accompanied by a matrix of 12 samples with varying parameters; laser powers of 125 W, 150 W, and 175 W, and scanning speeds of 400 mm/s, 600 mm/s, 800 mm/s, and 1000 mm/s were studied. Samples were manufactured using a rotated scanning strategy that changed the scanning direction angle of each subsequent layer by 67°. All of the samples were made with 40 °C building platform temperature, and the hatch distance was 0.1 mm.
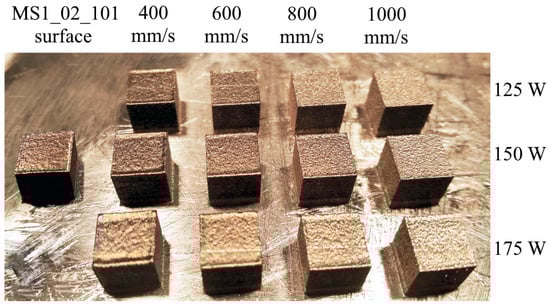
Figure 1.
L-PBF cubes used in this study.
The porosity of each cube was determined through the analysis of metallographic longitudinal cross-sections parallel to the building direction. Prior to the microstructural examination, the samples were prepared through grinding and polishing. A Zeiss Axioimager M1 (Zeiss Group, Oberkochen, Germany) optical microscope was used to image the prepared specimens. Additional details regarding the porosity measurement methodology can be found in a previously published study [].
Vickers microhardness was determined through measurements on a KB30 hardness testing machine (KB Prüftechnik GmbH, Hochdorf-Assenheim, Germany) according to ISO 6507-1. Hardness values were measured at 10 different locations arranged in an array on the surface of the specimens. A test load of 0.5 kg (HV05) was used for the measurements.
Surface topography measurements were carried out on a Leica DCM 3D confocal microscope (Leica Microsystems GmbH, Wetzlar, Germany). An area of 1.91 mm × 2.07 mm was scanned with a Leica HC PL Fluotar EPI 20X lens (Leica Microsystems GmbH, Wetzlar, Germany). A vertical range from 100 μm to 600 μm was utilized with a step height between 1 μm and 5 μm to account for the differences in height. The scanned surfaces were post-processed in Mountains 8, including the extraction and leveling of the topography layer prior to roughness parameter calculations. Areas with missing data points were filled in using a smooth shape based on the neighboring points for the visualizations. Standardized primary surface roughness parameters were calculated according to ISO 25178.
3. Results
3.1. Three-Dimensional Surface Topography
Surface topography measurements revealed the top surface texture and rough parameters of the sample cubes. Samples are chosen for Figure 2 to display three of the distinct surface textures that are formed among the sample cubes, as well as the reference cube printed with the MS1_02_101 surface parameter. A different color scale was used for Figure 2 in order to better enhance the surface topography of the samples.
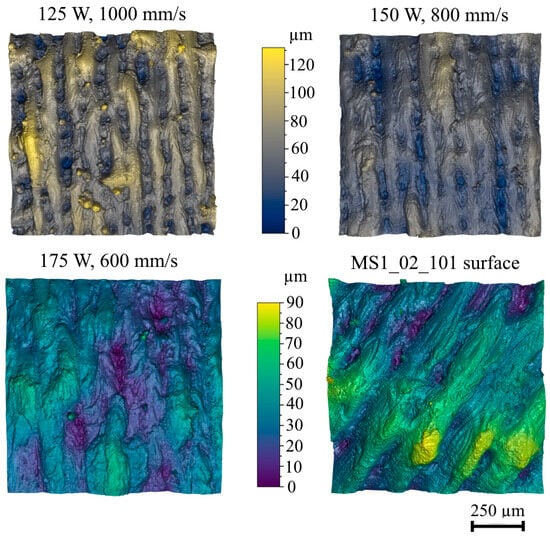
Figure 2.
Top surface topography measurement by Leica 3D.
Unmelted particles can be observed at a severely high 1000 mm/s scanning speed and low laser power of 125 W. While decreasing the scanning speed to 800 mm/s and increasing the laser power to 150 W eliminates unmelted particles, the underlying wave-like shape of the surface remains. Both of these samples show marked peaks of sharp lines along the laser-scanning path. A sample printed at a comparably high laser power and slow scanning speed of 175 W and 600 mm/s shows no unmelted particles and no sharp, wave-like formations on the surface. This sample consists of equally distributed low peaks and shallow valleys with gradual transitions, with its features mostly resembling the reference surface.
Measured quantitative surface roughness values are shown in Figure 3 and Figure 4. Root mean square deviation (Sq) was calculated on the surface to characterize the average amplitude. Maximum height (Sz) was also determined. Sq values are close to the reference in the case of scanning speeds of 800 mm/s and 1000 mm/s. Sz values are similar or significantly lower compared to the reference. The best RMS roughness was found at 175 W laser power and 600 mm/s scanning speed.
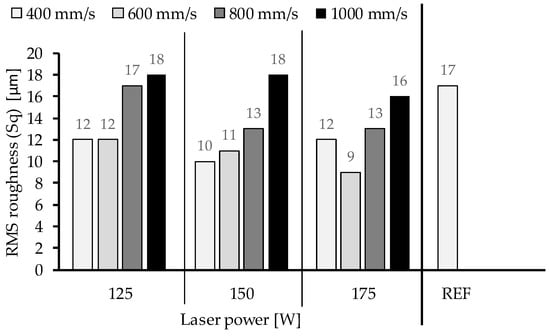
Figure 3.
RMS roughness (Sq) comparison for different build parameters.
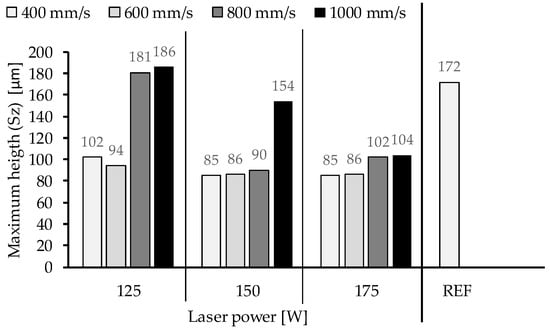
Figure 4.
Maximum heigth (Sz) comparison for different build parameters.
3.2. Porosity Measurement
Optical microscope images were taken along the building directions of the cubic specimens. Figure 5 demonstrates the concentration of pores, represented by dark spots on the microscope images of polished cross-sections. Extended and sharp-edged pores can be observed at a large 1000 mm/s scanning speed and a low laser power of 125 W, caused by the lack of input energy. The absorbed energy is insufficient to fully melt the powder, resulting in large and irregular porosities. Likewise, numerous, mostly round pores are visible at a very high specific energy input (175 W and 400 mm/s). High input energy values result in over-melting, leading to excessive penetration, which leaves a pore near the bottom of the melt pool after solidification.
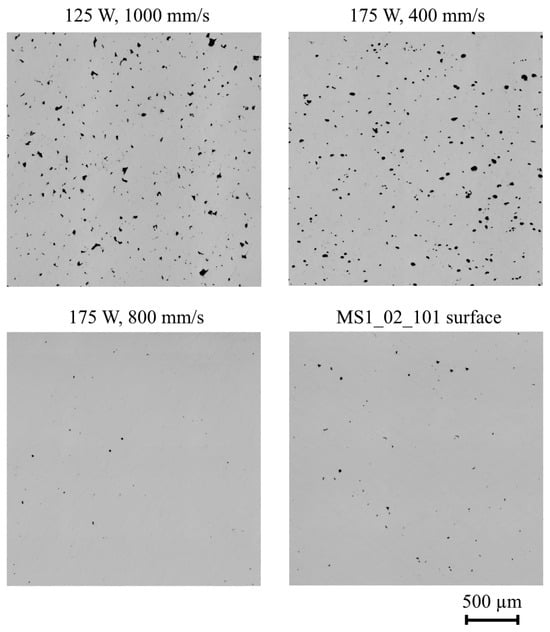
Figure 5.
Optical images of polished cross-sections for selected process parameter combinations.
Relative porosity values under different manufacturing conditions are presented in Figure 6. A brief assessment of the values reveals that most of the different laser power and scanning speed parameter pairs result in very low porosity close to the value of the reference sample. The resulting pore density of some parameter pairs even surpasses the porosity of the reference. Pore defects are more prominent in the case of parameter parts with high melting energy (low scanning speed and high laser power) and low melting energy (high scanning speed and low laser power). The highest porosity value (1.96%) can be observed at parameters 400 mm/s and 175 W. An optimum parameter combination of 150 W laser power and 600 mm/s scanning speed results in an exceptionally low pore density (0.03%) and the lowest registered average void size. Process parameters need to be accurately adjusted to fabricate parts with low porosity.
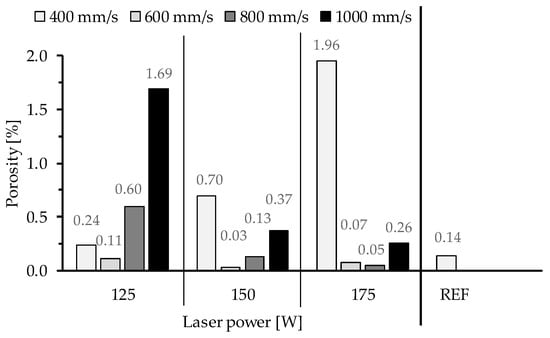
Figure 6.
Porosity comparison for different build parameters.
Volumetric energy density (VED) is often used as an optimization metric for L-PBF process parameters because it takes all four major parameters into consideration. Equation (1) is the formula for VED (J/mm3) [].
where P is the laser power (W), v is the laser scanning speed (mm/s), h is the laser scanning spacing (mm), and t is the layer thickness (mm). The relationship between VED and porosity is depicted in Figure 7, which shows that the relative density of samples increased with an increase in VED until the minimal porosity was reached. Further increase in VED caused a decrease in density. The results in Figure 7 suggest the VED range for producing near highly dense parts is from 110 to 150 J/mm3. The highest observed relative density was 99.97%, corresponding to a VED of 125 J/mm3.
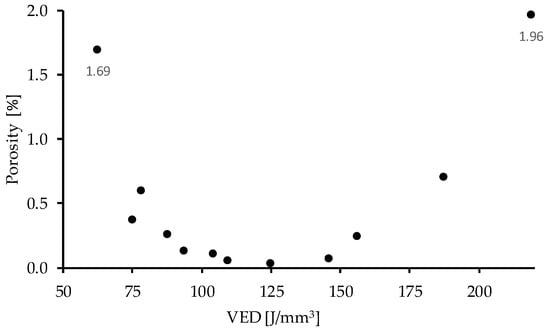
Figure 7.
The variation of the relative density of 1.2709 samples produced using different VED of L-PBF.
3.3. Hardness
Average Vickers hardness measurements with their extrema and standard deviation values are displayed in Figure 8. According to the datasheet of the manufacturer, bulk hardness is expected to be within 305–352 HV5 (33–37 HRC) [] after DMLS. The measured hardness of the reference material is slightly higher than the suggested range. Most test samples show hard values comparable to the reference. None of the individual hardness test points showed a value under the lower hardness limit specified by the manufacturer. The consistent standard deviations suggest a correct measurement process.
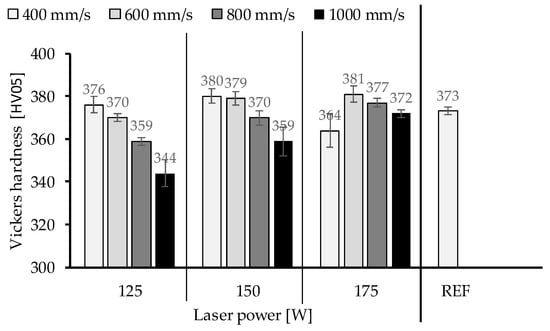
Figure 8.
Effect of scanning speed and laser power on measured Vickers hardness.
The obtained data are supplemented by the assessment of the influence of the porosity on the Vickers hardness of the samples (Figure 9). Based on the results, it can be stated that the hardness of the samples is affected by porosity; with an increase in porosity, the measured hardness ordinarily declines, clearly indicating a connection between the defects in the AM parts and the mechanical properties of the printed parts. However, at high porosity levels, there may be no strong correlation between HV05 hardness and porosity. The hard variations could also be attributed to differences in VED during melting, as microhardness is affected by heating temperature, cooling rate, and holding time.
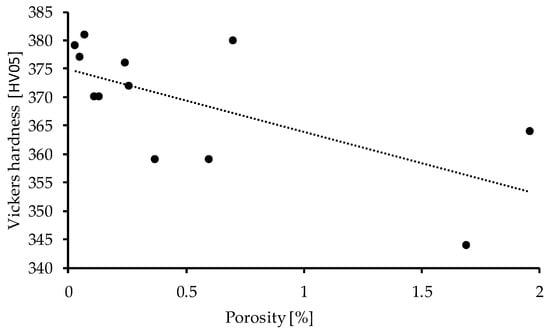
Figure 9.
Vickers hardness as a function of porosity.
4. Conclusions
Surface topologies can be good visual indicators in metal AM parameter optimization. It can provide additional insights into the melting process; inadequate melting of the base powder is indicated by unmelted particles visible on the scanned surface. This information cannot be inferred from the quantitative surface roughness values exclusively; only a higher roughness value is apparent.
Porosity measurements indicate the quality of the melting process and also hint at the mechanical strength of the printed part. By combining process parameters, it is possible to identify a region between low and high energy density where optimal processing conditions can be utilized to achieve high density.
The best RMS roughness was obtained at 175 W of laser power and 600 mm/s of scanning speed.
A relative density of 99.97% could be achieved for 1.2709 using optimal process parameters (P = 150 W, v = 600 mm/s, and t = 20 µm).
A maximal hardness values were reached with 175 W and 600 mm/s (381 HV5), 150 W and 400 mm/s (380 HV5), and 150 W and 600 mm/s (379 HV5) manufacturing parameters.
Based on the presented results, the best resemblance to the reference in terms of roughness, porosity, and hardness was found at 150 W laser power and 800 mm/s scanning speed.
Author Contributions
Conceptualization, I.H. and I.F.; methodology, A.L.N. and I.F.; software, I.F.; validation, B.L., I.H. and I.F.; formal analysis, A.L.N.; investigation, B.L.; resources, I.H.; data curation, B.L.; writing—original draft preparation, B.L.; writing—review and editing, I.H.; visualization, A.L.N.; supervision, A.L.N.; project administration, I.H.; funding acquisition, I.H. All authors have read and agreed to the published version of the manuscript.
Funding
Project no. TKP2021-NVA-23 has been implemented with the support provided by the Ministry of Innovation and Technology of Hungary from the National Research, Development and Innovation Fund, financed under the TKP2021-NVA funding scheme.
Institutional Review Board Statement
Not applicable.
Informed Consent Statement
Not applicable.
Data Availability Statement
Data for this study is available upon request from the corresponding author.
Acknowledgments
Authors would like to thank Bence Kocsis (Faculty of Engineering, University of Szeged) for his help with the diagrams used in this paper.
Conflicts of Interest
The authors declare no conflicts of interest.
References
- Marrey, M.; Malekipour, E.; El-Mounayri, H.; Faierson, E.J. A Framework for Optimizing Process Parameters in Powder Bed Fusion (PBF) Process Using Artificial Neural Network (ANN). Procedia Manuf. 2019, 34, 505–515. [Google Scholar] [CrossRef]
- Matos, F.; Godina, R.; Jacinto, C.; Carvalho, H.; Ribeiro, I.; Peças, P. Additive Manufacturing: Exploring the Social Changes and Impacts. Sustainability 2019, 11, 3757. [Google Scholar] [CrossRef]
- Hatos, I.; Hargitai, H.; Fekete, G.; Fekete, I. Effect of Energy Density on the Mechanical Properties of 1.2709 Maraging Steel Produced by Laser Powder Bed Fusion. Materials 2024, 17, 3432. [Google Scholar] [CrossRef] [PubMed]
- Kónya, J.; Kulcsár, K.; Hargitai, H. Examination of Welded Joint of Titanium Alloy Used in Oral Surgery. IOP Conf. Ser. Mater. Sci. Eng. 2020, 903, 012016. [Google Scholar] [CrossRef]
- Zink, B.; Kovács, N.K.; Kovács, J.G. Thermal Analysis Based Method Development for Novel Rapid Tooling Applications. Int. Commun. Heat Mass Transf. 2019, 108, 104297. [Google Scholar] [CrossRef]
- Orosz, T.; Horváth, T.; Tóth, B.; Kuczmann, M.; Kocsis, B. Iron Loss Calculation Methods for Numerical Analysis of 3D-Printed Rotating Machines: A Review. Energies 2023, 16, 6547. [Google Scholar] [CrossRef]
- Kónya, J.; Jaber, H.; Kovács, T.A.; Hargitai, H. Effects of Selective Laser Melting Building Directions and Surface Modifications on Surface Roughness of Ti6Al4V Alloy. Discov. Appl. Sci. 2024, 6, 5. [Google Scholar] [CrossRef]
- Kozak, J.; Zakrzewski, T. Accuracy Problems of Additive Manufacturing Using SLS/SLM Processes. AIP Conf. Proc. 2018, 2017, 020010. [Google Scholar] [CrossRef]
- Abd-Elghany, K.; Bourell, D.L. Property Evaluation of 304L Stainless Steel Fabricated by Selective Laser Melting. Rapid Prototyp. J. 2012, 18, 420–428. [Google Scholar] [CrossRef]
- Mugwagwa, L.; Yadroitsev, I.; Matope, S. Effect of Process Parameters on Residual Stresses, Distortions, and Porosity in Selective Laser Melting of Maraging Steel 300. Metals 2019, 9, 1042. [Google Scholar] [CrossRef]
- Andronov, V.; Šimota, J.; Beránek, L.; Blažek, J.; Rušar, F. Optimization of Process Parameters for Additively Produced Tool Steel 1.2709 with a Layer Thickness of 100 Μm. Materials 2021, 14, 2852. [Google Scholar] [CrossRef] [PubMed]
- Hatos, I.; Fekete, I.; Harangozó, D.; Hargitai, H. Influence of Local Porosity on the Mechanical Properties of Direct Metal Laser-Sintered 1.2709 Alloy. Stroj. Vestn.—J. Mech. Eng. 2020, 66, 351. [Google Scholar] [CrossRef]
- Buhairi, M.A.; Foudzi, F.M.; Jamhari, F.I.; Sulong, A.B.; Radzuan, N.A.M.; Muhamad, N.; Mohamed, I.F.; Azman, A.H.; Harun, W.S.W.; Al-Furjan, M.S.H. Review on Volumetric Energy Density: Influence on Morphology and Mechanical Properties of Ti6Al4V Manufactured via Laser Powder Bed Fusion. Prog. Addit. Manuf. 2023, 8, 265–283. [Google Scholar] [CrossRef]
- EOS GmbH. Material Data Sheet: EOS MaragingSteel MS1. Available online: https://www.fabb-it.de/files/datenblaetter/werkzeugstahl.pdf. (accessed on 4 August 2025).
Disclaimer/Publisher’s Note: The statements, opinions and data contained in all publications are solely those of the individual author(s) and contributor(s) and not of MDPI and/or the editor(s). MDPI and/or the editor(s) disclaim responsibility for any injury to people or property resulting from any ideas, methods, instructions or products referred to in the content. |
© 2025 by the authors. Licensee MDPI, Basel, Switzerland. This article is an open access article distributed under the terms and conditions of the Creative Commons Attribution (CC BY) license (https://creativecommons.org/licenses/by/4.0/).