Abstract
The operation of autonomous vehicles requires the coordinated operation of a number of sensors to improve road safety. Data from the sensors are processed by vehicle control algorithms, which then make decisions. If there is a degradation in the efficiency of these sensors, the reliability of the whole system is affected. Different weather conditions affect the efficiency of the system. The research has identified the weather factors that affect the performance of the sensors based on a literature search. Following the literature analysis, a simulation test was carried out to investigate the extent to which the detection performance of a stereo video camera installed in an experimental autonomous vehicle is affected when part of the sensor is covered by a contaminant. The measurement was followed by a comparison of the vehicle and obstacle detection efficiency when the camera is completely clean and when part of the camera is covered.
1. Introduction
In recent decades, the number of passenger cars has gradually increased in countries around the world, but so has the number of accidents. In 2006, the global passenger car fleet was 679 million vehicles, while in 2015 it reached 947 million vehicles. By 2020, this number had exceeded 1.18 billion [1,2]. In the United States, between 2010 and 2019, the number of road accidents (total road traffic accidents) increased from approximately 5.4 million to 6.7 million per year [3]. More and more people have died in traffic accidents. Passive and active safety devices were the first to appear, contributing significantly to reducing the severity of accidents, while active devices also helped to reduce the number of collisions. However, in the early 2000s, traffic safety experts and car manufacturers’ managers and development engineers came to the conclusion that these systems were no longer sufficient for safe traffic due to the large number of vehicles, pedestrians, and cyclists on the roads. Around the turn of the millennium, developments began and, as a result, newer and newer modern driver assistance systems, or Driver Assistance Systems (DAS) technologies, were continuously introduced [4]. In one study, the authors used a Recurrent Neural Network (RNN) architecture to predict pedestrians’ movement intentions. Based on these predictions, the vehicles braked earlier (on average 0.5–0.8 s sooner), significantly reducing the risk of collision [5].
Driver assistance systems and, in the future, autonomous vehicles require a coordinated sensor system and control algorithm that receives detailed information about the vehicle’s environment during sensing. The effectiveness of environmental perception is critical for the accuracy of sign recognition and lane detection, as well as for the detection of obstacles, vehicles, and people [6,7].
Weather conditions such as rain intensity, humidity, fog, and sunlight intensity therefore affect the performance of sensors, and thus the obstacle detection capabilities of cameras and LiDAR. Variable weather conditions, including rain, snow, fog, ice formation, and different lighting conditions, pose challenges for the sensors responsible for the operation of autonomous vehicles. Rain and snow have a significant impact on detection accuracy because water droplets and snowflakes can distort light under certain conditions, confusing the sensors and causing them to transmit less and less accurate data to the data processing system. Radars are less sensitive in this respect, as radar waves can penetrate rain and snow [8].
In order to determine the recognition accuracy of objects and lanes, it is essential to examine these factors and conditions during the research of autonomous vehicles. The so-called ‘adversarial attack’ method allows for the software testing of the effectiveness of deep learning-based object recognition and lane detection algorithms, which can be used to modify the input data in software, thus simulating changed weather conditions. This method can be used to weaken the performance of models and the efficiency of recognition, allowing weather conditions recorded in real traffic to be tested and modified [9].
There are two main ways to mess with input data using software. One is to make visible changes to images (image processing attacks), where weather effects are added to the system in a way that is obvious to the human eye, changing how the image looks to people and cameras [10]. The other method is the use of invisible perturbations (adversarial patterns) [11]. This method allows changes to be made to the input data that are imperceptible to the human eye and capable of deceiving the object detection model. These modifications can be digital solutions or deceptive stickers or signs placed in real space [12].
Goodfellow et al. (2015) further simplified the intervention methodology, using a method called Fast Gradient Sign Method (FGSM) to generate a small perturbation to every pixel of the image in a single step using the model gradient [13].
In their research, Michaelis et al. used a test set in which the input data were distorted using software methods (Gaussian noise, blurring, weather effects) and the effect was examined. The tests showed that sensor performance can be reduced by up to 40–50% under the strongest distortions [14].
Secci and Ceccarelli (2022) defined the potential detection difficulties of cameras built into autonomous vehicles (blurring, noise, darkening/whitening, partial occlusion) and used a generator program to produce a variety of faulty images, which they analyzed using six different sensors to examine detection efficiency [15].
2. Materials and Methods
2.1. YOLO Networks
To evaluate the robustness of state-of-the-art object detectors under visual perturbations, we selected several recent versions of the YOLO (You Only Look Once) model family. These models are widely used in autonomous driving applications due to their real-time detection capabilities and high accuracy. The following subsection briefly summarizes the architectural advances of YOLOv8 through YOLOv12, highlighting their relevance for the subsequent experiments.
The YOLOv8 model introduced a CSPNet-based backbone for efficient feature extraction, combined with FPN+PAN for improved multi-scale detection. Its anchor-free approach simplifies predictions while maintaining real-time accuracy on benchmarks such as COCO and Roboflow 100 [16].
YOLOv9 brought significant improvements with the Generalized Efficient Layer Aggregation Network (GELAN) and Programmable Gradient Information (PGI), enhancing feature processing and training efficiency. Modules like Depthwise Convolutions and C3Ghost reduced computational load while improving accuracy and inference speed across various hardware [17].
YOLOv10 eliminated the traditional Non-Maximum Suppression (NMS) step through consistent dual assignments, reducing redundancy and increasing detection accuracy. Compared to YOLOv9, YOLOv10 achieved 1.8× faster inference and 46% lower latency with comparable accuracy [18].
YOLOv11 introduced the C3k2 block, SPPF module, and C2PSA attention mechanism, expanding capabilities to instance segmentation and oriented object detection (OBB). It provided better accuracy and efficiency while maintaining real-time applicability [19].
YOLOv12 focused on attention-based detection, improving accuracy by 2.1% over YOLOv10n while retaining high speed. Variants like YOLOv12s achieved 42% faster inference using only 36% of the computational resources compared to similar RT-DETR models [20].
2.2. COCO Dataset
The primary purpose of the Microsoft COCO (Common Objects in Context) dataset is to enable and facilitate the accurate and efficient detection and segmentation of objects and obstacles located in real-world environments. The dataset contains approximately 300,000 images, but this number is constantly growing. The images are classified into 80 categories, which can be found in the database with manual annotations and precise outlines. One of the most important principles of the COCO dataset is the recognition of contextual relationships between objects, thus enabling not only exact object recognition, but also detailed analysis and evaluation of the images and the collected data. Based on the above, the COCO dataset is one of the most important databases for machine vision applications, widely used for object detection and segmentation tasks, as well as for training and evaluating neural networks [21].
2.3. Proposed Dataset
To assess the robustness of the selected YOLO models, a custom dataset was created for testing purposes. This dataset consists of images with a resolution of pixels, extracted from a short video sequence recorded during a drive around the Széchenyi István University campus in Győr, Hungary, on public roads. The average vehicle speed during data collection was approximately 20–25 km/h, reflecting typical low-speed urban driving conditions. The footage captures various real-world traffic scenarios, including vehicles, pedestrians, and bicycles, providing a realistic environment for evaluating detection performance.
All images were manually annotated following the COCO dataset class definitions, ensuring consistency with the object categories used during model training. Specifically, annotations were created for vehicles (cars, trucks, buses, motorcycles), pedestrians and Bicycles.
To simulate typical sensor degradations encountered in real-world applications, each image was artificially distorted using the Albumentation (v2.0.8) [22] image augmentation library. Three types of adversarial visual perturbations were applied, each with five predefined intensity levels to simulate varying degrees of sensor degradation:
- RandomFog—used to simulate the effect of water droplets accumulating on the camera lens, creating blurred and partially occluded areas in the image. The augmentation was applied with varying probabilities () to simulate increasing levels of contamination.
- Spatter—used to emulate dirt and mud contamination on the sensor, reproducing typical soiling effects encountered during off-road or adverse weather conditions. The severity of the spatter effect was controlled via the probability parameter ().
- RandomSunFlare—applied to model lens flare and sun glare effects caused by direct sunlight. The intensity and position of the flare were adjusted using the flare_roi parameter, defined as , where , to progressively increase the impact of the glare.
Artificial distortions were preferred over real contaminations to ensure full control over intensity and location of sensor degradations, enabling reproducible and safety-compliant testing scenarios. This approach also facilitates large-scale, systematic evaluation without the logistical constraints of real-world data collection.
Table 1 illustrates examples of the five intensity levels for each of the three adversarial visual perturbations applied in this study: water droplets (RandomFog), dirt contamination (Spatter), and sunflare glare (RandomSunFlare).

Table 1.
Sample images from our dataset showing different severity levels of adversarial water droplet, mud, and sunflare effects applied for robustness evaluation.
3. Results
In this section, we present the evaluation results of the selected YOLO models on the custom dataset described in Section 2.3. The YOLO object detection models implemented in the Ultralytics framework (v8.3.221), pre-trained on the COCO dataset, were tested in three scenarios, with three types of adversarial visual perturbations applied to the images.
For each perturbation type, five predefined intensity levels were applied to analyze the progressive impact of increasing contamination severity. The models’ performance was evaluated in terms of precision, recall, and F1-score, providing a comprehensive assessment of robustness under adverse conditions. For the evaluation, a selection of YOLO models was made to ensure a representative comparison across different network sizes. Within each category, models were selected to have comparable parameter counts, ensuring a fair comparison of architectural improvements across versions. The exact number of training parameters and the corresponding mAP (mean average precision) values measured on the COCO dataset are summarized in Table 2, while Figure 1 visualizes these values in a two-dimensional diagram, illustrating the relationship between model complexity and detection accuracy.
Table 2.
Selected models: parameters and performance on COCO dataset.
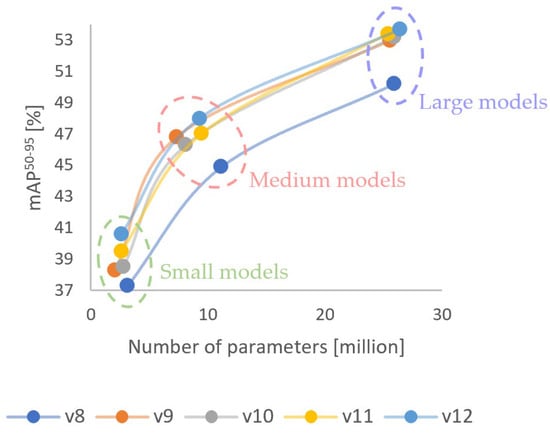
Figure 1.
Comparison of the selected YOLO models in terms of parameters and performance.
The evaluation was conducted using four different Intersection over Union (IoU) thresholds: , , , and . For each IoU threshold, every model was assessed across a comprehensive set of evaluation metrics. These metrics were derived from: three types of adversarial visual perturbations (water droplets, mud contamination, sunflare glare), five predefined intensity levels per perturbation type, and three performance indicators (precision, recall, and F1-score). This setup allowed for a detailed analysis of how each YOLO model’s detection performance degrades under varying levels of visual distortion and stricter localization requirements. Figure 2 illustrates the number of cases in which each YOLO model achieved the best performance among the 45 evaluation metrics, for each tested IoU threshold.
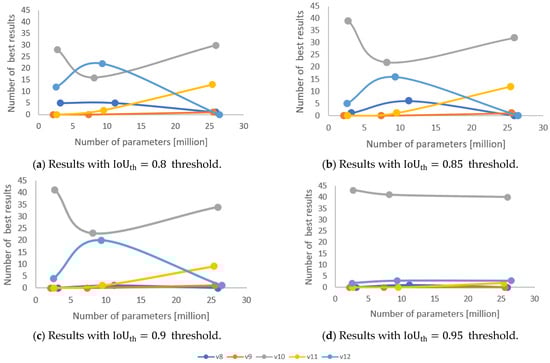
Figure 2.
Number of best detection performance results achieved by the selected YOLO models across 45 evaluation metrics under varying IoU threshold values.
The detailed evaluation results are presented in Table 3, Table 4, Table 5, Table 6, Table 7, Table 8, Table 9, Table 10 and Table 11. The results of the small, medium, and large model groups are the averages of the four IoU thresholds tested, where for each metric, the best performing model at a given noise level is highlighted.
Table 3.
Performance of small models under adversarial water droplet.
Table 4.
Performance of small models under adversarial mud contamination.
Table 5.
Performance of small models under adversarial sunflare interference.
Table 6.
Performance of medium models under adversarial water droplet.
Table 7.
Performance of medium models under adversarial mud contamination.
Table 8.
Performance of medium models under adversarial sunflare interference.
Table 9.
Performance of large models under adversarial water droplet.
Table 10.
Performance of large models under adversarial mud contamination.
Table 11.
Performance of large models under adversarial sunflare interference.
4. Discussion
The analysis reveals that YOLOv10 consistently achieved the highest precision and F1-score values across all model sizes and perturbation types, especially under more challenging noise levels. Notably, YOLOv12 exhibited slightly better recall values in several high-intensity scenarios, particularly for mud contamination and sunflare glare, suggesting its improved sensitivity in detecting partially occluded objects. Overall, the results confirm that YOLOv10 offers the most balanced performance in terms of precision and F1-score, while YOLOv12 shows potential benefits in situations where maintaining high recall under extreme visual degradation is critical. These trends were consistently observed across the small (Table 3, Table 4 and Table 5), medium (Table 6, Table 7 and Table 8), and large model groups (Table 9, Table 10 and Table 11), emphasizing the robustness advantages of the newer model generations under adverse conditions.
The trends shown in Figure 2 highlight clear differences in model performance across the evaluated IoU thresholds and model sizes. At the lower IoU thresholds (0.8 and 0.85), YOLOv12 and YOLOv10 models achieved the highest number of best results, particularly within the medium and large parameter ranges, reflecting their ability to handle more challenging detection scenarios with higher flexibility in bounding box accuracy. However, as the IoU threshold increased to 0.9 and 0.95, YOLOv10 consistently dominated across all model sizes, achieving the highest number of best results independently of the number of parameters. This indicates that YOLOv10 exhibits superior robustness and localization precision under stricter detection conditions, especially when high IoU is required. Furthermore, the results confirm that the latest versions (YOLOv11 and YOLOv12) showed better performance trends at lower IoU thresholds, suggesting improved detection capabilities under looser matching conditions, while YOLOv10 demonstrated the most stable and dominant performance at higher thresholds, making it a favorable choice for applications requiring strict object localization.
5. Conclusions and Future Work
The precise, accurate, and reliable operation of sensors is essential for society to have sufficient confidence in these technologies. If autonomous vehicles are unable to reliably detect individual obstacles in changing environmental conditions, people will find it much more difficult to accept these solutions. The acceptance of current driver assistance systems is also greatly influenced by the sense of safety and reliability provided by the system. This article focused on the detection efficiency of road users, but future plans include testing the efficiency of lane, traffic sign, and traffic light recognition under various weather conditions. The identification of these infrastructure elements is also crucial for the operation of autonomous vehicles. Another important area of research could be the change in recognition efficiency at higher speeds in rural and highway conditions. While synthetic perturbations enable controlled and reproducible testing, a limitation is that real-world contamination may exhibit more complex patterns. Therefore, future work should include validation on real sensor data to confirm the transferability of these results.
Author Contributions
Conceptualization, D.C., F.S. and J.H.; methodology, J.H. and D.C.; software, J.H.; validation, J.H., D.C.; formal analysis, D.C.; investigation, J.H.; resources, J.H.; data curation, J.H.; writing—original draft preparation, D.C. and J.H.; writing—review and editing, D.C. and J.H.; visualization, J.H. and D.C.; supervision, J.H. and F.S.; project administration, D.C.; funding acquisition, F.S. All authors have read and agreed to the published version of the manuscript.
Funding
The research was supported by the European Union within the framework of the National Laboratory for Artificial Intelligence (RRF-2.3.1-21-2022-00004).
Institutional Review Board Statement
Not applicable.
Informed Consent Statement
Not applicable.
Data Availability Statement
Data for this study are available upon request from the corresponding author.
Conflicts of Interest
The authors declare no conflicts of interest.
References
- Statista. Number of Passenger Cars and Commercial Vehicles in Use Worldwide from 2006 to 2015. Available online: https://www.statista.com (accessed on 22 July 2025).
- OICA. Vehicles in Use. International Organization of Motor Vehicle Manufacturers. Available online: https://www.oica.net (accessed on 22 July 2025).
- World Health Organization. Global Status Report on Road Safety 2018; WHO: Geneva, Switzerland, 2018. [Google Scholar]
- Zhang, Y.; Carballo, A.; Yang, H.; Takeda, K. Perception and Sensing for Autonomous Vehicles under Adverse Weather Conditions: A Survey. ISPRS J. Photogramm. Remote Sens. 2023, 196, 146–177. [Google Scholar]
- Dollár, P.; Wojek, C.; Schiele, B.; Perona, P. Pedestrian Detection: An Evaluation of the State of the Art. IEEE Trans. Pattern Anal. Mach. Intell. 2012, 34, 743–761. [Google Scholar] [CrossRef] [PubMed]
- Goodin, C.; Carruth, D.; Doude, M.; Hudson, C. Predicting the Influence of Rain on LIDAR in ADAS. Electronics 2019, 8, 89. [Google Scholar] [CrossRef]
- Aloufi, N.; Alnori, A.; Basuhail, A. Enhancing Autonomous Vehicle Perception in Adverse Weather: A Multi-Objectives Model for Integrated Weather Classification and Object Detection. Electronics 2024, 13, 3063. [Google Scholar] [CrossRef]
- Linnhoff, C.; Hofrichter, K.; Elster, L.; Rosenberger, P.; Winner, H. Measuring the Influence of Environmental Conditions on Automotive Lidar Sensors. Sensors 2022, 22, 5266. [Google Scholar] [CrossRef] [PubMed]
- Ibrahim, A.D.M.; Hussain, M.; Hong, J.E. Deep Learning Adversarial Attacks and Defenses in Autonomous Vehicles: A Systematic Literature Review from a Safety Perspective. Artif. Intell. Rev. 2025, 58, 28. [Google Scholar] [CrossRef]
- Maqsood, M.; Yasmin, S.; Gillani, S.; Aadil, F.; Mehmood, I.; Rho, S.; Yeo, S.-S. An Autonomous Decision-Making Framework for Gait Recognition Systems Against Adversarial Attack Using Reinforcement Learning. ISA Trans. 2023, 132, 80–93. [Google Scholar] [CrossRef] [PubMed]
- Marchisio, A.; Caramia, G.; Martina, M.; Shafique, M. FakeWeather: Adversarial Attacks for Deep Neural Networks Emulating Weather Conditions on the Camera Lens of Autonomous Systems. In Proceedings of the International Joint Conference on Neural Networks (IJCNN), Padova, Italy, 18–23 July 2022; pp. 1–9. [Google Scholar]
- Man, Y.; Li, M.; Gerdes, R. Remote Perception Attacks Against Camera-Based Object Recognition Systems and Countermeasures. ACM Trans. Cyber-Phys. Syst. 2023, 8, 1–27. [Google Scholar] [CrossRef]
- Goodfellow, I.; Shlens, J.; Szegedy, C. Explaining and Harnessing Adversarial Examples. arXiv 2014, arXiv:1412.6572. [Google Scholar]
- Michaelis, C.; Mitzkus, B.; Geirhos, R.; Rusak, E.; Bringmann, O.; Ecker, S.A.; Bethge, M.; Brendel, W. Benchmarking Robustness in Object Detection: Autonomous Driving When Winter is Coming. arXiv 2019, arXiv:1907.07484. [Google Scholar]
- Secci, F.; Ceccarelli, A. RGB Cameras Failures and Their Effects in Autonomous Driving Applications. arXiv 2020, arXiv:2008.05938. [Google Scholar]
- Yaseen, M. What Is YOLOv8: An In-Depth Exploration of the Internal Features of the Next-Generation Object Detector. arXiv 2024, arXiv:2408.15857. [Google Scholar]
- Yaseen, M. What Is YOLOv9: An In-Depth Exploration of the Internal Features of the Next-Generation Object Detector. arXiv 2024, arXiv:2409.07813. [Google Scholar]
- Wang, A.; Chen, H.; Liu, L.; Chen, K.; Lin, Z.; Han, J.; Ding, G. YOLOv10: Real-Time End-to-End Object Detection. Adv. Neural Inf. Process. Syst. 2024, 37, 107984–108011. [Google Scholar]
- Rahima, K.; Muhammad, H. YOLOv11: An Overview of the Key Architectural Enhancements. arXiv 2024, arXiv:2410.17725. [Google Scholar] [CrossRef]
- Tang, Y.; Yuan, Q.; Doermann, D. YOLOv12: Attention-Centric Real-Time Object Detectors. arXiv 2025, arXiv:2502.12524. [Google Scholar]
- Lin, T.-Y.; Maire, M.; Belongie, S.; Hays, J.; Perona, P.; Ramanan, D.; Dollár, P.; Zitnick, C.L. Microsoft COCO: Common Objects in Context. In Proceedings of the European Conference on Computer Vision (ECCV), Zurich, Switzerland, 6–12 September 2014; pp. 740–755. [Google Scholar]
- Buslaev, A.; Iglovikov, V.I.; Khvedchenya, E.; Parinov, A.; Druzhinin, M.; Kalinin, A.A. Albumentations: Fast and Flexible Image Augmentations. Information 2020, 11, 125. [Google Scholar] [CrossRef]


Disclaimer/Publisher’s Note: The statements, opinions and data contained in all publications are solely those of the individual author(s) and contributor(s) and not of MDPI and/or the editor(s). MDPI and/or the editor(s) disclaim responsibility for any injury to people or property resulting from any ideas, methods, instructions or products referred to in the content. |
© 2025 by the authors. Licensee MDPI, Basel, Switzerland. This article is an open access article distributed under the terms and conditions of the Creative Commons Attribution (CC BY) license (https://creativecommons.org/licenses/by/4.0/).