Abstract
Timely and precise identification of breast cancer is crucial for enhancing clinical outcomes; however, current AI systems frequently exhibit deficiencies in transparency, trustworthiness, and the capacity to assimilate varied data modalities. We introduce a reliable, multi-agent, multimodal AI system for individualised early breast cancer diagnosis, created on the CBIS-DDSM dataset. The system consists of four specialised agents that cooperatively analyse diverse data. An Imaging Agent employs convolutional and transformer-based models to analyse mammograms for lesion classification and localisation; a Clinical Agent extracts structured features including breast density (ACR), view type (CC/MLO), laterality, mass shape, margin, calcification type and distribution, BI-RADS score, pathology status, and subtlety rating utilising optimised tabular learning models; a Risk Assessment Agent integrates outputs from the imaging and clinical agents to produce personalised malignancy predictions; and an Explainability Agent provides role-specific interpretations through Grad-CAM for imaging, SHAP for clinical features, and natural language explanations customised for radiologists, general practitioners, and patients. Predictive dependability is assessed by Expected Calibration Error (ECE) and Brier Score. The framework employs a modular design with a Streamlit interface, facilitating both comprehensive deployment and interactive demonstration. This paradigm enhances the creation of reliable AI systems for clinical decision assistance in oncology by the integration of strong interpretability, personalised risk assessment, and smooth multimodal integration.
1. Introduction
Breast cancer is a highly prevalent and life-threatening condition impacting women globally. Timely and precise detection is fundamental for enhancing prognosis and decreasing mortality rates. Mammography screening programmes have greatly improved early detection; however, diagnostic interpretation remains challenging due to the complexity of breast tissue patterns, variability in clinical presentations, and the subjective nature of radiological evaluation. Recent advancements in artificial intelligence (AI) and deep learning have established these technologies as significant aids in breast cancer detection, potentially enhancing accuracy, consistency, and efficiency. Many contemporary AI systems demonstrate significant limitations that hinder their implementation in practical clinical environments. Most models are predominantly unimodal, concentrating solely on imaging, or they do not utilise the extensive contextual information present in structured clinical data, including patient history, breast density, or BI-RADS assessments. Additionally, these systems frequently function as opaque black boxes, exhibiting deficiencies in interpretability, personalisation, and modularity attributes crucial for establishing clinical trust and facilitating nuanced decision-making across various medical roles.
We propose a multi-agent, multimodal AI framework to facilitate personalised early breast cancer detection through the collaborative processing of heterogeneous data. The system utilises the CBIS-DDSM dataset and divides the diagnostic workflow into four specialised, interoperable agents: an Imaging Agent that employs convolutional and transformer-based models for lesion classification and localisation of mammograms; a Clinical Agent that extracts structured features from patient metadata, including breast density (ACR), view type, laterality, mass characteristics, calcification descriptors, BI-RADS scores, pathology labels, and subtlety ratings; a Risk Assessment Agent that integrates imaging and clinical outputs to produce individualised malignancy risk predictions; and an Explainability Agent that generates stakeholder-specific interpretations through Grad-CAM visualisations, SHAP-based feature attribution, and natural language explanations for radiologists, general practitioners, and patients. Model calibration is assessed through Expected Calibration Error (ECE) and Brier Score to verify predictive reliability.
The framework employs a modular and extensible architecture, featuring a Streamlit-based interface that accommodates both comprehensive deployment and interactive demonstration exploration. Our approach seeks to bridge the divide between advanced AI research and clinically applicable diagnostic systems by integrating multimodal data, facilitating interpretable decision support, and providing personalised risk assessments. This research advances the development of AI tools that are accurate, scalable, trustworthy, and adaptable to the specific needs of real-world oncology practice.
2. Related Work
Deep learning has transformed mammographic analysis by allowing convolutional neural networks (CNNs) to attain performance comparable to that of radiologists. Architectures like ResNet and DenseNet, often pre-trained on natural pictures and subsequently fine-tuned on extensive mammography datasets, have high sensitivity and specificity for tumour detection [1,2]. Ensemble methods that integrate complementary architectures (e.g., EfficientNet, DenseNet, ResNet) augment robustness and diminish false positives, attaining area-under-curve (AUC) values surpassing 0.98 in early-stage cancer classification [3]. Nevertheless, image-based models are limited by the availability of annotated data and naturally neglect non-imaging risk factors, including familial history, hormone status, and breast density.
To overcome these limitations, multimodal fusion techniques combine mammographic features with structured clinical variables. Gao et al. demonstrated that integrating image representations with patient age, hormone usage, and family history results in notable enhancements compared to unimodal baselines [4], while Zhang et al. expanded this approach to merge radiological findings with genetic and pathology data for improved malignancy prediction [5]. Wu et al. notably reported an AUC of 0.889 in molecular subtype classification by utilising joint image–clinical embeddings, in contrast to 0.612 for image-only networks [6]. Even with these advancements, numerous fusion frameworks continue to be monolithic, limiting their flexibility in adapting to new data sources or clinical workflows.
By breaking out the diagnostic pipeline into specialised, compatible components, modular, agent-based architectures provide a fix. Dedicated agents in such systems do duties including image analysis, tabular data processing, risk estimation, and decision fusion; then they report to create a coherent diagnosis [7]. This design facilitates extensibility new modalities (e.g. ultrasound, MRI) or updated clinical recommendations can be included with minimal disruption and encourages transparency, as each agent outputs can be audited separately. With its MONAI framework, which arranges autonomous agents for sequential interpretation and report production across multimodal inputs [8], NVIDIA exhibits this paradigm.
Clinical acceptance depends critically on interpretability. While SHAP values clarify feature contributions in tabular models [9], post hoc techniques such Grad-CAM highlight salient areas in mammograms to justify CNN predictions [10]. Still, current explainability technologies mostly target radiologists and provide minimal flexibility for patients or general practitioners. While few systems dynamically produce such customised outputs, ref. [11] emphasise the need of role-specific explanations detailed attention maps for experts versus plain-language summaries for patients. Furthermore rare are research on human–AI explanations assessing their relevance.
Confidence calibration is equally essential. Contemporary deep networks frequently generate too confident probabilities that inaccurately reflect actual likelihoods, a critical concern in cancer [12]. Temperature scaling, Expected Calibration Error (ECE), and Brier scores are conventional metrics utilised to evaluate and rectify miscalibration [12,13]. Bayesian ensembles and Monte Carlo dropout facilitate the quantification of epistemic uncertainty, hence identifying low-confidence instances for human evaluation [14]. Although these strategies have proven effective in general machine learning, their systematic use in breast cancer AI is still constrained.
Notwithstanding significant progress in imaging, multimodal fusion, modular architectures, interpretability, and model calibration, a comprehensive end-to-end framework that cohesively integrates these components remains elusive. Contemporary research often investigates each facet in isolation: high-performing multimodal models frequently lack transparency and modularity, while agent-based systems rarely incorporate robust uncertainty quantification or stakeholder aware interpretability. Bridging these silos to construct a trustworthy, deployable AI system for early breast cancer detection one that integrates diverse modalities, provides audience-specific explanations, and maintains calibrated predictive confidence remains a critical and open challenge in the field. This work aims to address that gap by unifying these capabilities within a coherent, extensible, and clinically grounded multi-agent architecture.
3. Materials
Dataset
We use the Curated Breast Imaging Subset of the Digital Database for Screening Mammography (CBIS-DDSM) as the primary dataset for developing and evaluating our framework. CBIS-DDSM is a publicly available, expert-annotated extension of the original DDSM collection, curated by the Cancer Imaging Archive (TCIA) and reformatted for machine learning research.
The dataset contains over 3000 mammographic studies, comprising four standard views per patient: craniocaudal (CC) and mediolateral oblique (MLO) for both the left and right breasts. Each image is linked to expert annotations that include lesion contours, pathology-confirmed labels (benign or malignant), and structured clinical metadata. All images are provided in DICOM format with pixel-level annotations for mass lesions and calcifications.
For our study, we extract and utilise the structured clinical features from the accompanying XML metadata (Table 1).

Table 1.
Structured clinical features extracted from CBIS-DDSM metadata.
For preprocessing, DICOM images are converted to PNG for compatibility with image models, while clinical variables are parsed and normalised. Cases labelled with incomplete data or uncertain pathology are excluded to maintain label consistency.
We split the dataset into 70% training, 15% validation, and 15% test sets, ensuring patient-level separation to prevent data leakage across splits. Stratified sampling is applied to maintain class balance across subsets.
This dataset provides the necessary multimodal structure for training the Imaging Agent and Clinical Agent independently while supporting downstream fusion in the Risk Assessment Agent. Its real-world complexity and comprehensive annotations make it suitable for evaluating both performance and interpretability in breast cancer detection models.
4. Methodology
We propose a modular, multi-agent, multimodal artificial intelligence (AI) framework designed to enhance the early and accurate detection of breast cancer by integrating mammographic imaging with structured clinical data. This architecture is purposefully built to maximise extensibility, interpretability, and clinical applicability while addressing three critical challenges commonly observed in current AI diagnostic systems: the lack of modular architectures that enable scalable development and independent validation; insufficient model calibration, which undermines the reliability of predicted probabilities; and limited stakeholder-specific explainability, which hampers clinical adoption and trust.
As illustrated in Figure 1, the system employs a planning-based architecture orchestrated by a central controller that coordinates four specialised agents: the Imaging Agent, Clinical Agent, Risk Assessment Agent, and Explainability Agent. This design supports independent training, evaluation, and optimisation of each agent, allowing continuous updates without compromising the integrity of the overall system.
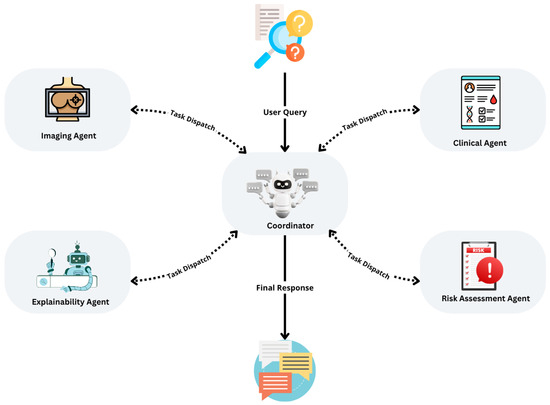
Figure 1.
Overview of the multi-agent diagnostic system for early breast cancer detection, illustrating the planning pattern, agent interactions, and iterative task execution loop.
The system adopts a service-oriented, agent-based architecture, where agents operate asynchronously and communicate through standardised API calls. A central controller manages data flow, orchestrates asynchronous execution, monitors stopping conditions, and ensures system resilience. This configuration enhances maintainability, scalability, and fault tolerance, making it well-suited for real-time clinical settings.
The Imaging Agent serves as the entry point for mammographic data, ingesting DICOM-format mammograms from the CBIS-DDSM dataset. Prior to analysis, images undergo pixel normalisation, resizing to 224 by 224 pixels, and RGB channel conversion to ensure compatibility with the chosen backbone models. We evaluate several deep learning architectures, including EfficientNet-B0, known for its computational efficiency; ResNet-50, valued for its robustness; and SwinUNet, applied for its superior image segmentation capabilities. The agent outputs binary lesion classifications (benign or malignant), confidence scores, Grad-CAM saliency maps that highlight diagnostically relevant regions, and intermediate feature embeddings for downstream fusion. To ensure robust performance even under imperfect conditions, fallback logic substitutes synthetic placeholders when mammographic inputs are unavailable.
The Clinical Agent processes structured metadata derived from the CBIS-DDSM dataset, which includes patient age, breast density classified by the American College of Radiology system, lesion laterality and imaging view, as well as detailed descriptors of mass shape, margin, calcification patterns, BI-RADS assessment scores, pathology status, and subtlety ratings. This agent employs several tabular learning models, including LightGBM, CatBoost, and TabNet, each optimised through Bayesian hyperparameter tuning. Outputs from the Clinical Agent consist of modality-specific malignancy probabilities, SHAP-based feature importance rankings, and learned embeddings prepared for multimodal fusion. Missing data are addressed using median or mode imputation, and categorical simplification is applied to manage sparse or noisy variables. The end-to-end controller and agent interfaces are outlined in Algorithm 1.
| Algorithm 1 Multi-Agent Breast Cancer Detection Pipeline |
|
At the heart of the system is the Risk Assessment Agent, which integrates outputs from the Imaging and Clinical Agents to generate calibrated malignancy risk scores. Two distinct fusion strategies are employed: a late fusion approach using logistic regression or shallow multilayer perceptrons (MLPs) on concatenated outputs, and a generative fusion approach leveraging variational autoencoders and Bayesian networks for embedding-level integration and counterfactual simulations. Calibration quality is rigorously assessed using metrics such as Expected Calibration Error (ECE), Brier Score, and reliability diagrams. Notably, this agent enables counterfactual risk analysis, allowing the system to answer clinically meaningful questions, for example, estimating how the risk profile would change if a patient’s age or BI-RADS score were adjusted.
The Explainability Agent addresses the crucial need for tailored interpretability across diverse user groups. For radiologists, it generates Grad-CAM overlays, visual confidence maps, and region-specific attention visualisations. For general practitioners, it provides SHAP-based summaries of feature contributions, modality-specific probability breakdowns, and summaries contextualised by patient comorbidities. For patients, it employs large language models, such as GPT or Claude, to deliver natural language explanations that address common concerns and provide individualised insights, such as why a particular risk estimate was assigned. These explanations are dynamically generated using structured outputs from preceding agents and are adapted to match the communication needs and domain knowledge of each user group.
As shown in Figure 1, the system implements a planning pattern in which a user query initiates a planning cycle. The central controller sequentially dispatches tasks to each agent, collects and evaluates intermediate results, and iteratively refines outputs until predefined stopping criteria are satisfied. This design guarantees stepwise optimisation, robust handling of incomplete or missing inputs, and supports the integration of advanced reasoning modules, such as ReAct Agents, for enhanced decision support. The modularity of the system ensures that it can evolve over time to incorporate new data types, agents, and learning methods, making it an adaptable framework for real-world clinical deployment.
As shown in Figure 1, the system follows a planning pattern: the user’s query initiates a planning cycle, wherein the controller dispatches tasks to agents, evaluates intermediate results, and iteratively refines outputs until stopping criteria are satisfied. This ensures sequential task optimisation, robust handling of incomplete inputs, and supports the integration of advanced modules such as ReAct Agents for reasoning and decision-making.
4.1. Evaluation Metrics
To comprehensively assess the performance of our framework, we report both classification quality and calibration reliability metrics. Each metric captures a different aspect of system behaviour, which is critical for clinical applicability where both accuracy and predictive confidence matter.
4.1.1. Brier Score
The Brier Score evaluates the mean squared difference between the predicted probability and the actual binary outcome across all instances:
where N is the total number of samples. Lower Brier Scores indicate better calibrated and more accurate probabilistic predictions. In contrast to simple accuracy metrics, the Brier Score penalises both overconfident wrong predictions and underconfident correct ones.
4.1.2. Expected Calibration Error (ECE)
The Expected Calibration Error (ECE) quantifies how closely the predicted confidence scores align with actual correctness likelihoods. Predictions are grouped into M confidence bins , and ECE is computed as follows:
where is the empirical accuracy in bin and is the average predicted confidence for that bin. ECE provides a weighted average of the absolute difference between confidence and accuracy. Lower ECE values indicate that the model’s confidence scores are reliable indicators of actual prediction correctness a critical property for trustworthy clinical decision support.
5. Evaluation and Results
We evaluate the performance of our multi-agent, multimodal framework on the CBIS-DDSM dataset, using a stratified held-out test set containing 226 cases. Overall, the system demonstrates strong classification performance, achieving an accuracy of 81.0% and a F1-score of 0.707. The receiver operating characteristic (ROC) curve shown in Figure 2 yields an area under the curve (AUC) of 0.922, indicating excellent discriminative ability between benign and malignant cases. Such a high AUC suggests that the fusion of imaging and clinical features provides complementary information, enhancing the model’s capacity to separate classes across different thresholds of sensitivity and specificity.
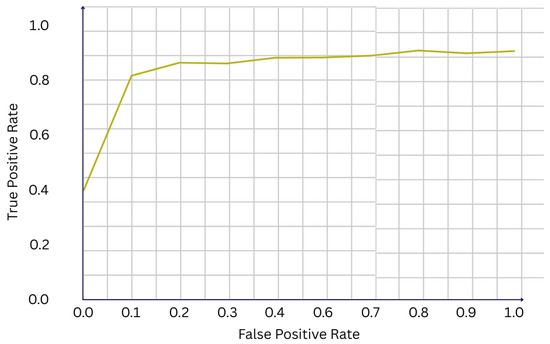
Figure 2.
ROC curve of the final model (AUC = 0.922).
Further analysis of the confusion matrix in Figure 3 reveals that the model correctly identifies 131 out of 145 benign cases and 52 out of 81 malignant cases. Although the overall performance is strong, a non-negligible number of false negatives (29 malignant cases misclassified as benign) persists. This observation highlights an important trade-off common in clinical AI: minimising false negatives is critical in cancer screening, where missing a malignancy could have serious consequences. The presence of false negatives, despite multimodal fusion, underscores the complexity of certain cases and motivates the inclusion of calibrated risk scores and counterfactual analysis modules in our framework.
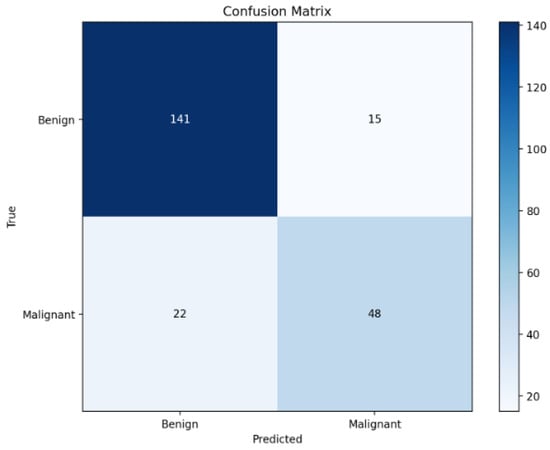
Figure 3.
Confusion matrix on the test set.
Reliability and calibration metrics further substantiate the framework’s trustworthiness. The calibration curve presented in Figure 4 demonstrates close alignment between predicted probabilities and observed outcome frequencies across different risk bins. Quantitatively, the model achieves a Brier Score of 0.129 and an Expected Calibration Error (ECE) of 0.075. These values indicate that the predictive probabilities generated by the system are well-calibrated, meaning that a predicted probability of, for example, 70% corresponds closely to an actual 70% observed malignancy rate. Calibration is crucial for supporting risk-based clinical decision-making, as it allows clinicians to appropriately weigh model predictions against other diagnostic evidence.
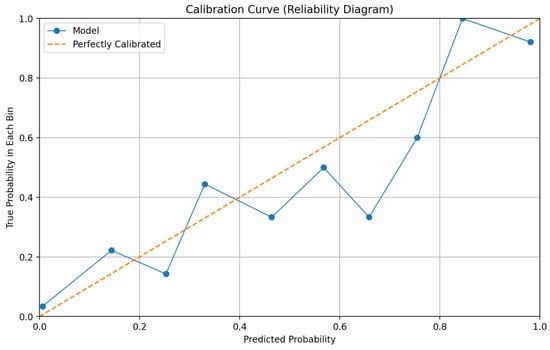
Figure 4.
Reliability diagram (calibration curve) for final predictions.
The distribution of predicted risk scores, illustrated in Figure 5, provides additional insights into model behaviour. Malignant cases are predominantly clustered toward higher risk predictions, while benign cases are skewed toward lower risk scores. However, some overlap exists in the mid-range risk interval (0.4–0.7), corresponding to cases where imaging and clinical cues may present conflicting or ambiguous signals. These ambiguous cases are precisely where the multi-agent explainability framework becomes particularly valuable, offering stakeholders interpretability outputs that contextualise uncertainty rather than mask it.
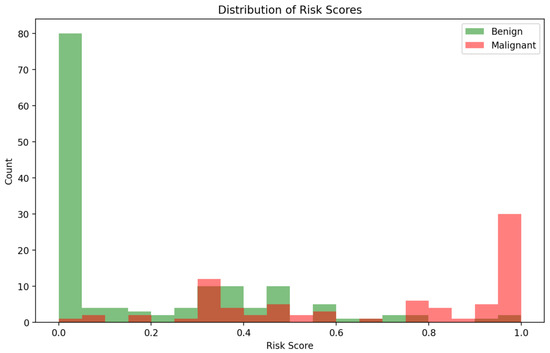
Figure 5.
Distribution of predicted risk scores for benign vs. malignant cases.
Explainability outputs generated by the Explainability Agent significantly enhance clinical interpretability. Figure 6 presents a unified, audience-specific explanation panel, illustrating how the system delivers tailored outputs for radiologists, general practitioners, and patients. By integrating Grad-CAM visualisations, SHAP-based feature attributions, and natural language explanations, the framework adapts to varying levels of clinical expertise and informational needs. This role-aware, multimodal approach moves beyond binary classification to provide interpretable, personalised justifications, thereby fostering transparency, user confidence, and more informed decision-making across diverse medical roles.
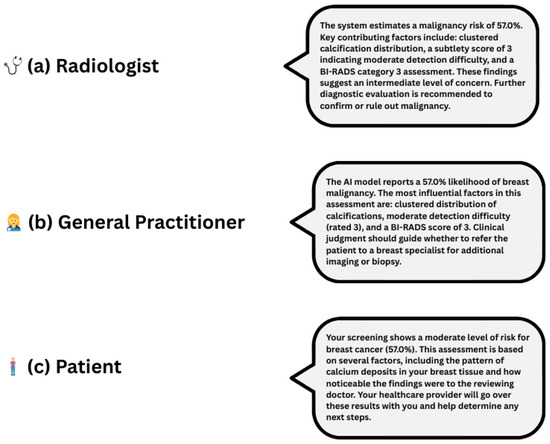
Figure 6.
Role-specific natural language explanations for a 57.0% malignancy risk prediction. Each explanation is adapted to its audience: (a) radiologist—technical and diagnostic detail, (b) General Practitioner—clinical guidance, (c) patient—plain language and next steps.
In summary, our framework achieves strong predictive performance with an AUC of 0.922, an accuracy of 81.0%, and a F1-score of 0.707, while maintaining reliable calibration as indicated by a Brier Score of 0.129 and an ECE of 0.075. Beyond raw predictive metrics, the system’s modular design supports calibrated, interpretable, and stakeholder-specific outputs. This combination of high accuracy, reliable calibration, and rich interpretability positions our system as a promising candidate for real-world deployment in high-stakes breast cancer screening environments.
Table 2 presents a benchmarking comparison of our framework against existing state-of-the-art models evaluated on the CBIS-DDSM dataset. While several models achieve higher raw accuracy (e.g., Ragab et al. at 97.90%), these often rely on unimodal architectures or handcrafted fusion strategies. In contrast, our approach prioritises interpretability, stakeholder-specific explanations, and calibration, achieving a strong balance between predictive power and clinical reliability.
Table 2.
Benchmarking of CBIS-DDSM classification performance across different models.
Limitations
Despite promising results, our framework has several limitations. Firstly, it was developed and validated exclusively on the CBIS-DDSM dataset, which may limit generalisability to other populations or imaging modalities such as ultrasound or MRI. Secondly, the model’s performance, while strong, still yields a notable number of false negatives an especially critical issue in cancer screening. Thirdly, although the Explainability Agent generates tailored outputs, these explanations have not yet been evaluated through human-subject usability studies. Finally, the system has not been tested in real-world clinical environments, and integration with existing radiological workflows and regulatory compliance remains future work.
Author Contributions
Conceptualization, I.E.; Methodology, I.E.; Software, I.E. and I.T.; Validation, I.E. and F.-E.B.-B. and B.J.; Formal analysis, I.E.; Investigation, I.E.; Resources, I.E.; Data curation, I.E.; Writing—original draft preparation, I.E. and M.C.E.M.; Writing—review and editing, F.-E.B.-B., I.T., M.C.E.M. and B.J.; Visualization, I.E.; Supervision, F.-E.B.-B. and B.J.; Project administration, F.-E.B.-B. and B.J. All authors have read and agreed to the published version of the manuscript.
Funding
This work was supported by the Mohammed VI Foundation for Sciences and Health through a student scholarship granted during the research period. The funders had no role in the design of the study; in the collection, analyses, or interpretation of data; in the writing of the manuscript; or in the decision to publish the results.
Institutional Review Board Statement
Ethical review and approval were waived for this study because it used only publicly available, de-identified resources (e.g., TCIA CBIS-DDSM imaging metadata and publicly released language corpora/guidelines) and did not involve interaction with human participants or access to identifiable private information. The study was conducted in accordance with the Declaration of Helsinki.
Informed Consent Statement
Not applicable.
Data Availability Statement
CBIS-DDSM is publicly available from The Cancer Imaging Archive (TCIA). All scripts used are available from the corresponding author upon reasonable request.
Conflicts of Interest
The authors declare no conflict of interest. The funders had no role in the design of the study; in the collection, analyses, or interpretation of data; in the writing of the manuscript; or in the decision to publish the results.
References
- Lotter, W.; Diab, A.R.; Haslam, B.; Kim, J.G.; Grisot, G.; Wu, E.; Wu, K.; Onieva, J.O.; Boyer, Y.; Boxerman, J.L.; et al. Robust breast cancer detection in mammography and digital breast tomosynthesis using an annotation-efficient deep learning approach. Nat. Med. 2021, 27, 244–249. [Google Scholar]
- Wu, N.; Phang, J.; Park, J.; Shen, Y.; Huang, Z.; Zorin, M.; Jastrzebski, S.; Fevry, T.; Katsnelson, J.; Kim, E.; et al. Deep neural networks improve radiologists’ performance in breast cancer screening. IEEE Trans. Med. Imaging 2019, 39, 1184–1194. [Google Scholar] [CrossRef] [PubMed]
- Shah, D.; Khan, M.A.U.; Abrar, M.; Tahir, M. Optimizing Breast Cancer Detection with an Ensemble Deep Learning Approach. Int. J. Intell. Syst. 2024, 2024, 5564649. [Google Scholar] [CrossRef]
- Gao, F.; Zhang, H.; Li, J. Deep learning fusion of mammographic and clinical data for breast cancer diagnosis. Med. Image Anal. 2021, 70, 101993. [Google Scholar]
- Zhang, Y.; Wang, X.; Xu, R. Multimodal fusion for breast cancer diagnosis using mammography and clinical data. IEEE Access 2020, 8, 115470–115481. [Google Scholar]
- Wu, P.; Chen, Y.; Sun, Z. Multimodal deep learning for breast cancer molecular subtype prediction. J. Med. Imaging 2025, 12, 15–27. [Google Scholar]
- Jiang, M.; Li, S.; Zhou, T. Collaborative agents for multimodal diagnostic decision support. Front. Artif. Intell. 2022, 5, 34. [Google Scholar]
- Cardoso, M.J.; Li, W.; Brown, R.; Ma, N.; Kerfoot, E.; Wang, Y.; Murrey, B.; Myronenko, A.; Zhao, C.; Yang, D.; et al. MONAI: An open-source framework for deep learning in healthcare. arXiv 2022, arXiv:2211.02701. Available online: https://arxiv.org/abs/2211.02701 (accessed on 22 June 2025). [CrossRef]
- Lundberg, S.M.; Lee, S.-I. A unified approach to interpreting model predictions. In Advances in Neural Information Processing Systems; Guyon, I., Luxburg, U.V., Bengio, S., Wallach, H., Fergus, R., Vishwanathan, S., Garnett, R., Eds.; Curran Associates: Red Hook, NY, USA, 2017; Volume 30, pp. 4765–4774. [Google Scholar]
- Selvaraju, R.R.; Cogswell, M.; Das, A.; Vedantam, R.; Parikh, D.; Batra, D. Grad-CAM: Visual explanations from deep networks via gradient-based localization. In Proceedings of the IEEE International Conference on Computer Vision, Los Alamitos, CA, USA, 22–27 October 2017; IEEE: Venice, Italy, 2017; pp. 618–626. [Google Scholar]
- Tonekaboni, S.; Joshi, S.; McCradden, M.D.; Goldenberg, A. What clinicians want: Contextualizing explainable machine learning for clinical end use. In Machine Learning for Healthcare; PMLR: Stockholm, Sweden, 2019; Volume 106, pp. 99–108. [Google Scholar]
- Guo, C.; Pleiss, G.; Sun, Y.; Weinberger, K.Q. On calibration of modern neural networks. In Proceedings of the International Conference on Machine Learning, Sydney, Australia, 6–11 August 2017; PMLR: Stockholmsmässan, Sweden, 2017; Volume 70, pp. 1321–1330. [Google Scholar]
- Liang, G.; Zhang, Y.; Wang, X.; Jacobs, N. Improved Trainable Calibration Method for Neural Networks on Medical Imaging Classification. arXiv 2020, arXiv:2009.04057. Available online: https://arxiv.org/abs/2009.04057 (accessed on 22 June 2025). [CrossRef]
- Kendall, A.; Gal, Y. What uncertainties do we need in Bayesian deep learning for computer vision? In Advances in Neural Information Processing Systems; Curran Associates: Red Hook, NY, USA, 2017; Volume 30, pp. 5574–5584. [Google Scholar]
- Ragab, D.A.; Attallah, O.; Sharkas, M.; Ren, J.; Marshall, S. A framework for breast cancer classification using Multi-DCNNs. Comput. Biol. Med. 2021, 131, 104245. [Google Scholar] [CrossRef] [PubMed]
- Ragab, D.A.; Sharkas, M.; Marshall, S.; Ren, J. Breast cancer detection using deep convolutional neural networks and support vector machines. PeerJ 2019, 7, e6201. [Google Scholar] [CrossRef] [PubMed]
- Petrini, D.G.P.; Shimizu, C.; Roela, R.A.; Valente, G.V.; Folgueira, M.A.A.K.; Kim, H.Y. Breast Cancer Diagnosis in Two-View Mammography Using End-to-End Trained EfficientNet-Based Convolutional Network. IEEE Access 2022, 10, 77723–77736. [Google Scholar] [CrossRef]
- Montaha, S.; Azam, S.; Haque, A.K.M.R.; Ghosh, P.; Hasan, M.Z.; Jonkman, M.; De Boer, F. BreastNet18: A High Accuracy Fine-Tuned VGG16 Model Evaluated Using Ablation Study for Diagnosing Breast Cancer from Enhanced Mammography Images. Biology 2021, 10, 1347. [Google Scholar] [CrossRef] [PubMed]
- Busaleh, M.; Hussain, M.; Aboalsamh, H.A.; Amin, F.-e. Breast Mass Classification Using Diverse Contextual Information and Convolutional Neural Network. Biosensors 2021, 11, 419. [Google Scholar] [CrossRef] [PubMed]


Disclaimer/Publisher’s Note: The statements, opinions and data contained in all publications are solely those of the individual author(s) and contributor(s) and not of MDPI and/or the editor(s). MDPI and/or the editor(s) disclaim responsibility for any injury to people or property resulting from any ideas, methods, instructions or products referred to in the content. |
© 2025 by the authors. Licensee MDPI, Basel, Switzerland. This article is an open access article distributed under the terms and conditions of the Creative Commons Attribution (CC BY) license (https://creativecommons.org/licenses/by/4.0/).