You are currently viewing a new version of our website. To view the old version click .
Engineering Proceedings
  • Proceeding Paper
  • Open Access

31 October 2025

Multiscale Modeling of C/SiC Ceramic Matrix Composites (CMCs) †

,
,
,
and
1
Dipartimento di Ingegneria dell’Innovazione, Università del Salento, 73100 Lecce, Italy
2
Department of Aeronautics and Astronautics, University of Southampton, Southampton SO17 1BJ, UK
3
Centro Italiano Ricerche Aerospaziali (CIRA), 81043 Capua, Italy
*
Author to whom correspondence should be addressed.

Abstract

Ceramic Matrix Composites (CMCs) have found numerous applications in aerospace, automotive and space vehicles due to their light weight and ability to withstand extreme temperatures. To develop a design criterion for CMCs, elastic properties at different scales need to be evaluated. In this research, elastic properties of CMCs are evaluated at the micro- and meso-level using representative volume element (RVE) in the Ansys Material Designer module. These properties are then validated using various analytical models including Rule of Mixture (ROM), the Chamis Model and the Mori–Tanaka Model. In-plane elastic properties (E11 and G12) of numerical models are in close agreement with the analytical models at both micro- and mesoscales. However, for out of plane properties (E22, G23), Mori–Tanaka Model provides the highest and the Chamis Model provides the lowest.

1. Introduction

Ceramic matrix composites are becoming increasingly popular in extreme environments due to their high thermal stability. The wide use of CMCs in aerospace, defense, space exploration and astronautics is because of its lightweight and outstanding mechanical properties [,]. Despite its excellent mechanical and thermal characteristics, the major prevailing issue is its complex geometry, which yields difficulties for the researcher to predict the fracture and failure mechanism precisely and accurately inside the structure at various levels of mechanical modeling [].
The evaluation of constitutive properties at the micro- and mesoscale level is important in the designing phase of the material as it helps to understand the material’s behavior at different levels. It also predicts deformation as well as failure mechanisms under various loading (tensile, shear, compressive and thermal) types []. So correctly evaluating stress state enhances and improves structural reliability, particularly in unexpected and extreme environments and establishes a safety border. It is also essential to estimate constitutive properties during multi-level temperature ranges, like in aerospace, where materials must undergo different levels of temperature. Also in FEM, a reliable and accurate stress distribution analysis can only be performed when constitutive properties of materials are accurately calculated [].
In CMCs, as the base material and matrix material have different properties and due to several manufacturing processes, the final property of the CMC changes due to the manufacturing process and porosity inside the fiber and matrix. To evaluate the micro- and meso-mechanical properties of CMCs during multiscale modeling, the concept of representative volume element (RVE) has been widely used in recent years as it can provide an average estimate about the mechanical properties of composites using homogenization methodology which is based on bridge mechanics principle. This saves a lot of resources and computation time and performing simulations at the micro-level becomes infeasible and complex due to an extremely large number of elements [].
Another challenging aspect of CMCs during experimentation is the calculation of out-of-plane properties due to insufficient specimen dimensions in the transverse direction. Due to the alignment of fiber orientation with the length and width of direction and standard sizing of the specimen while using equipment like a universal testing machine, the in-plane properties are easier to measure in comparison with out-of-plane properties like interlaminar shear stress and out-of-plane thermal expansion []. Out-of-plane properties become a challenging task in experimentation because of low reinforcement in the transverse direction, as it mainly depends on the matrix, which is weaker when compared with fiber, and the complex setup for an interlaminar shear test and delamination can also lead to failure [].
To overcome these challenges, the concept of multiscale analysis is being applied where simulation is being performed in two stages, on the micro- and mesoscale. To effectively evaluate constitutive properties of the unidirectional fiber composites at the microscale level, various RVE types like square, diamond, hexagonal and random fiber distribution models, along with analytical models like Rule of Mixture (ROM), the Chamis Model and the Mori–Tanaka Model are being studied by researchers. The elastic properties obtained at microscale are then transformed to mesoscale modeling [].
The analytical models provide a better understanding of how the elastic properties of unidirectional carbon fibers can be estimated. Voigt in 1910 gave an equation to calculate the maximum stiffness and then in 1920 Reuss proposed an equation to find the minimum stiffness of the composite. Later, based on the equations of Voigt and Reuss, the Rule of Mixture model was developed by a researcher, but this model was not sufficient to accurately estimate the out-of-plane shear modulus. Halpin–Tsai equations are another classical mechanic model which can better optimize the composites properties based on volume fraction and the aspect ratio of fibers given by Halpin and Tsai in 1969. Then, Chamis proposed a model based on the ROM which significantly improved the estimates and can calculate the out-of-plane properties, as well utilizing the concept of volume fractions and fiber orientation. For enhancing predicted values of strength and stiffness of composites, the Mori–Tanaka Model is also used, which can estimate the elastic properties by focusing on the interaction between the fiber and the matrix. It is often used by researchers where it is necessary to consider the effect of reinforcement on the strength and stiffness of the composite. To better respond to the microstructural complexities in woven designs while predicting the elastic properties, a self-consistent (SC) model was developed which treats the fiber and the matrix as the single phase. The Generalized self-consistent (GSC) model is the extension of self-consistent model which was developed to estimate the engineering constant for more complex anisotropic geometries. To provide insights of transfer of loads between woven composites to see the behavior of the fiber and matrix under stress, RVE-based full-field homogenization was then proposed to be used in recent homogenization software packages [,].
Now for mesoscale modeling, the main issue is effective derivation of the geometrical parameter of tows of woven twill composites and the yarn and fiber volume fractions. Accurate morphology of the woven twill can be evaluated by using various optical microscopy, SEM or CT tomography. Based on the results of morphological assessment, exact values of geometrical parameters can be computed, which can be used to perform mesoscale mechanical modeling to evaluate the constitutive elastic properties of the composite which can be used for macroscale modeling of the laminated model to effectively evaluate the failure mechanism using fracture and failure models like progressive failure analysis (PFA), cohesive zone element (CZM), extended finite element analysis (XFEM) and the virtual crack closure technique (VCCT) [].
The objective of the paper is to develop a methodology which integrates the numerical and experimental approaches to evaluate the thermo-mechanical reliability of CMCs under elevated temperatures and loading conditions. Starting from the evaluation of one or two constitutive properties from the experimental tests followed by an evaluation of the morphology of the geometrical parameters of the woven twill using optical microscopy techniques. Then, we conducted an evaluation of the fiber and matrix properties based on the literature, the manufacturer’s data sheet or morphological assessment. The next step was the evaluation of microscale constituent properties using the analytical (ROM, Chamis and M-T) and micromechanical modeling of hexagonal RVE in the ANSYS v2024/R2 material designer module. Based on the micromechanical elastic properties and geometrical parameters of woven twill calculated using morphological assessment, we designed and developed mesoscale RVEs to calculate the final constitutive properties of mesoscale twill RVEs. The last step was the comparison of mesoscale RVE elastic properties with the experimental values at the first step of the methodology.

2. Materials and Methodology

The ceramic matrix composite is prepared using liquid phase infiltration, the base material used is carbon fiber and the matrix is SiC. The properties used to perform micro- and mesoscale modeling in the discussion ahead are shown in the tables below, Table 1 and Table 2:
Table 1. Carbon fiber properties.
Table 2. Matrix SiC properties.

3. Analytical Models

A few classical models including Rule of Mixture (ROM), the Chamis Model and the Mori–Tanaka Model are presented to compute the micromechanical properties for the unidirectional fiber composite.

3.1. Rule of Mixture (ROM)

To formulate and predict the engineering constraints for the discussed composite at the microscale level, ROM is one of the most classical models []. Based on Equations (1)–(6), the engineering constraints are calculated and presented in MPa in Table 3. The data generated from the result of the micro level is then transferred to the RVE model of the twill-woven composite and the mesoscale elastic properties.
E 11 = V f E f , 11 + V m E m  
E 22 = E 33 = E m 1 V f 1 E m E f , 22 = E f , 22 E m V f E m + V m E f .22
G 12 = G 13 = G m 1 V f 1 G m G f , 12 = G f , 12 G m V f G m + V m G f , 12
G 23 = G m 1 V f 1 G m G f , 23 = G f , 23 G m V f G m + V m G f , 23
ν 12 = ν 13 = V f ν f , 12 + V m ν m
ν 23 = ν f , 23 V f E m + ν m V m E f , 22 V f E m + V m E f , 22
Table 3. Elastic properties of the micromodel at various fiber volume fractions using ROM.

3.2. Chamis Model

To calculate the values of E11 and v12, Equations (1) and (5) are used in this model as ROM provides less accurate calculations for transverse modulus, so this model is applied to calculate engineering constraints []. To calculate E22, G12, G23 and v23, Equations (6)–(10) are used and elastic properties obtained in MPa are presented in Table 4. These homogenized properties are then used to obtain mesoscale modeling results using an RVE-based approach in the material designer module and the output of the elastic properties obtained based on the Chamis equation.
E 22 = E 33 = E m 1 V f 1 E m E f , 22 = E f , 22 E m V f E m + 1 V f E f , 22
G 12 = G 13 = G m 1 V f 1 G m G f , 12 = G f , 12 G m V f G m + 1 V f G f , 12
G 23 = G m 1 V f 1 G m G f , 23 = G f , 23 G m V f G m + 1 V f G f , 23
ν 23 = E 22 2 G 23 1
Table 4. Elastic properties of the micromodel at various fiber volume fractions using the Chamis Model.

3.3. Mori–Tanaka Model

To calculate and predict elastic properties with higher accuracy, the M-T Model is one of the best analytical models, particularly for composite materials and to formulate the micromechanical properties for a given composite [], Equations (11)–(18) are used and the properties obtained are shown in Table 5. The intermediate variables, Z1 and Z2, are derived using Equations (17) and (18) and their values at different fiber volume fractions are gathered in Table 6. Based upon these elastic properties of the composite on the microscale, a mesoscale model of twill-woven RVEs in the ANSYS material designer is simulated and the elastic properties of mesoscale modeling are generated.
E 11 = V f E f , 11 + V m E m + 2 V f V m Z 1 ν f , 12 ν m 2
E 22 = E 11 / 1 ν m 2 1 1 v m 2 + 2 V f E 11 Z 2 1 + ν f , 23 E f , 22 E m 1 + ν m + V f Z 1 E f , 11 E m 1 + v m E m 2 E f , 11 + 1 v f , 23 E f , 22
G 12 = G 13 = E m 2 V m 1 + ν m 1 + V f 4 V f 1 + V f + 2 V m G f , 12 E m 1 + ν m 1
G 23 = E m 2 1 + ν m + V f V m 8 1 ν m 2 + G f , 23 E m 2 G f , 23 1 + ν m 1
ν 12 = ν 13 = ν m + 2 V f Z 1 E m ν f , 12 ν m 1 ν m 2
ν 23 = 1 E 22 E 11 2 + 2 V f V m E f , 11 E m 1 ν m 2 × 1 2 Z 1 V f E f , 11 1 ν m 2 + V m E m 1 ν f , 12 2 E f , 11 E m E 11 E m 1 + ν m
Table 5. Elastic properties of the micromodel at various fiber volume fractions using the Mori–Tanaka Model.
Table 6. Intermediate variables Z1 and Z2 at various fiber volume fractions.
Here, Z1 and Z2 are two intermediate variables:
Z 1 = 2 V m v f , 12 2 E f , 11 + V m 1 v f , 23 E f , 22 + 1 + ν m 1 + V f 1 2 ν m E m 1
Z 2 = E f .22 3 + V f 4 ν m 1 + ν m + V m E m 1 + v f , 23

4. Numerical Modeling Strategy

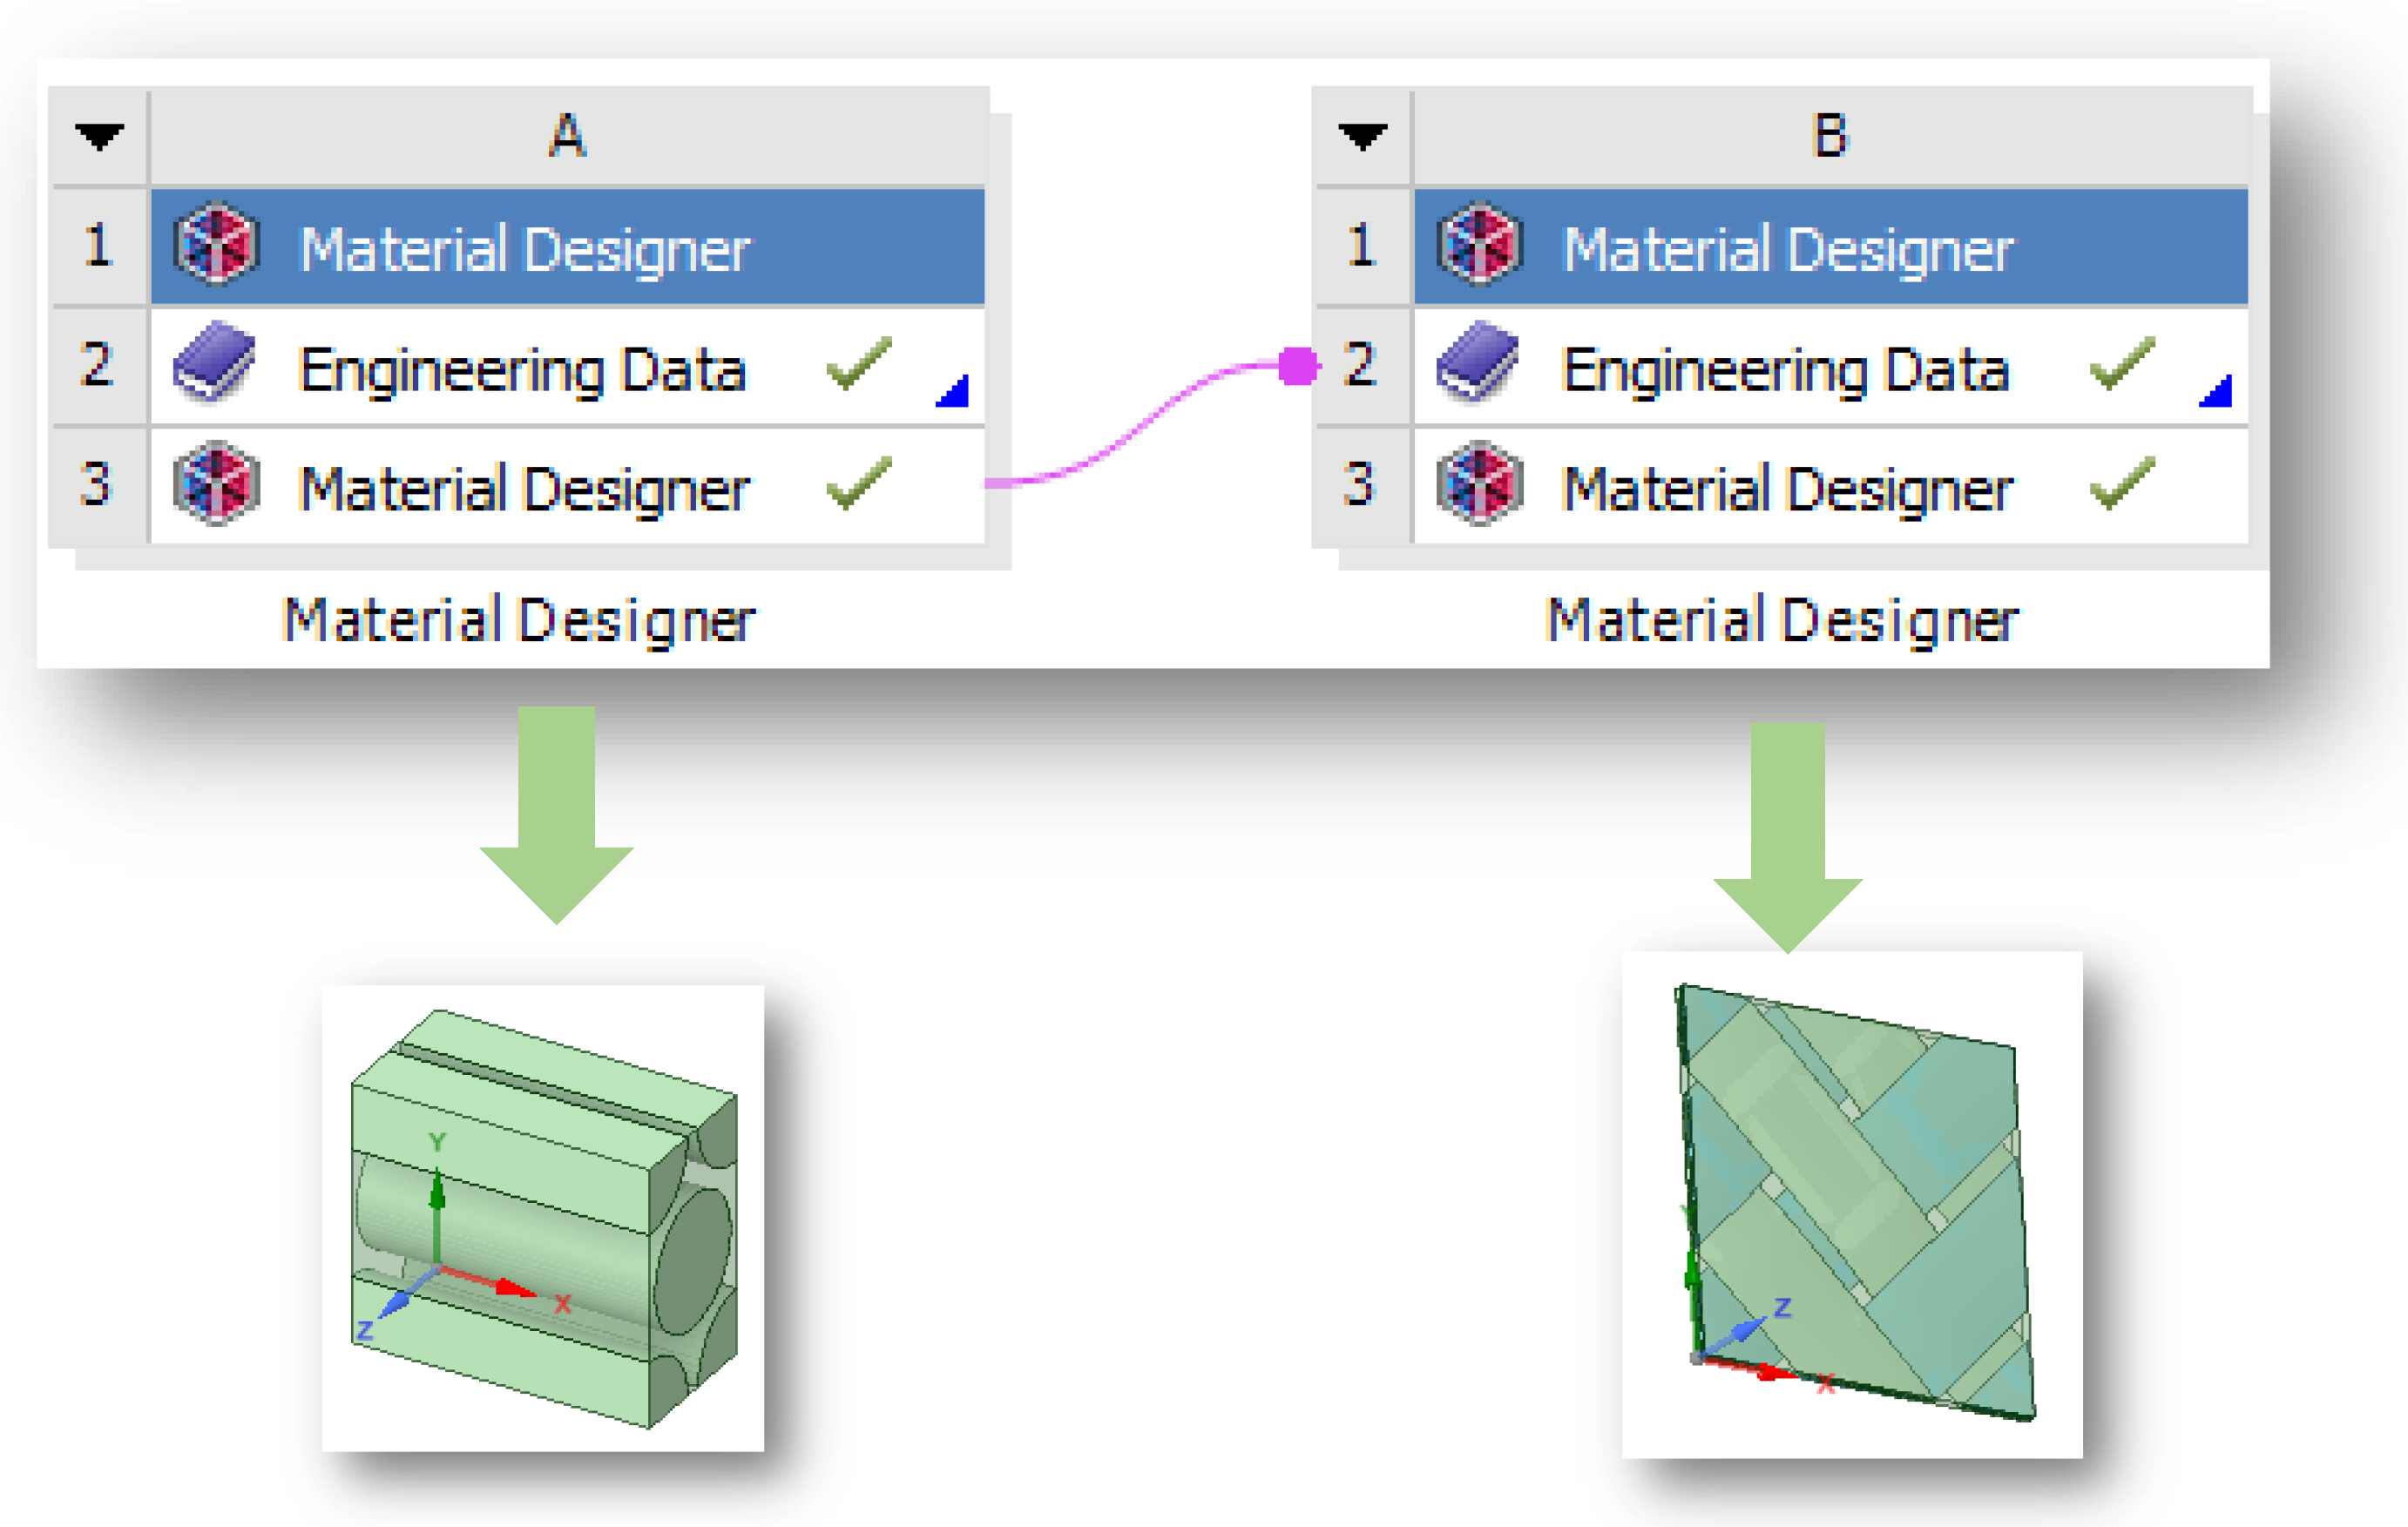
The FEA-based multiscale modeling approach is applied to obtain the elastic properties for the woven composite. The approach consists of two phases: microscale modeling of unidirectional composite and then the transmission of microscale results to mesoscale modeling for woven RVEs in the ANSYS material designer module []. The final engineering constraint obtained from the mesoscale model can be transferred to the engineering database as composite properties for the macroscale modeling of the composite. The strategy follows the schematics given below in Figure 1.
Figure 1. (A) module micro and (B) module meso RVE model in the ANSYS material designer module.

4.1. Microscale Model

For the microscale modeling of a unidirectional composite, carbon fiber is used as the base material and SiC as the matrix material. An RVE model of hexagonal shape is generated in the ANSYS material designer module using tabular data from Table 1 and Table 2, where 70% of the material is taken as carbon fiber and 30% as matrix material while setting fiber volume ratio. The diameter of carbon fiber was 5 µm. The mesh size varied from 0.35 to 0.7 µm and simulations were performed. Based on these results, the optimized mesh size was taken as 0.5 µm. To compute orthotropic linear elastic properties, a homogenized approach was applied where the RVE model was constrained on one side and loaded on the opposite side by tensile loads in X, Y and Z directions, and shear loads in XY, YZ and ZX directions. In this module, to compute the stiffness of unidirectional composite, for a blocked periodic mesh, periodic boundary conditions were implemented. After implementing the macroscopic strain on the corresponding faces, reaction forces were calculated. The ANSYS material designer uses a full-field homogenization theory, which integrates the stress acting on the surface of RVEs to calculate the stiffness matrix. Finally, the stiffness matrix was inverted using Equations (19)–(22) to obtain the constitutive properties of the material. The elastic properties obtained by the ANSYS material designer are shown in Table 7.
σ x σ y σ z σ x y σ y z σ z x = D 11 D 12 D 13 0 0 0 D 21 D 22 D 23 0 0 0 D 31 D 32 D 33 0 0 0 0 0 0 D 44 0 0 0 0 0 0 D 55 0 0 0 0 0 0 D 66 ε x ε y ε z γ x y γ y z γ z x
Table 7. Elastic properties of the micromodel at various fiber volume fractions using the ANSYS material designer module.
At ε x = 0.01
D 11 D 21 D 31 0 0 0 = 1 0.01 σ x σ y σ z σ x y σ y z σ x x
C = D 1
  C = 1 E x v y x E y v z x E z 0 0 0 v x y E x 1 E y v z y E z 0 0 0 v x z E x v y z E y 1 E z 0 0 0 0 0 0 1 G x y 0 0 0 0 0 0 1 G y z 0 0 0 0 0 0 1 G z x

4.2. Mesoscale Model

An RVE of a 2 × 2 twill-woven composite is again developed in another material designer where twill yarn properties are the homogenized properties obtained from micromodel, as shown in Table 1, and the matrix is the same SiC used in microscale modeling. The output of the microscale model is directly mapped onto the mesoscale model. Here, the fiber volume fraction is 38% while yarn fiber volume fraction is 80%. The thickness of fabric is taken as 0.2 mm and spacing between consecutive yarn is 2.11 mm. Mesh size is taken as 0.5 mm and an algorithm for the yarn shape is a lenticular shaped yarn structure [,]. To compute the orthotropic linear elastic properties, again the RVE is constrained and loaded by tensile and shear loads according to the condition already described for the microscale model (Table 8, Table 9, Table 10 and Table 11).
Table 8. Elastic properties of the mesomodel at various fiber volume fractions using the ANSYS material designer module.
Table 9. Engineering Constraints of the mesomodel at various fiber volume fractions using RVEs in the material designer based on the ROM micro result in Table 3.
Table 10. Elastic properties of the mesomodel at various fiber volume fraction using RVEs in the material designer based on Chami’s micro result in Table 4.
Table 11. Elastic properties of the mesomodel at various fiber volume fractions using RVEs in the material designer based on the Mori–Tanaka Model results in Table 5.

5. Results and Discussion

5.1. Fiber Volume Fraction on Longitudinal Young’s Modulus E11

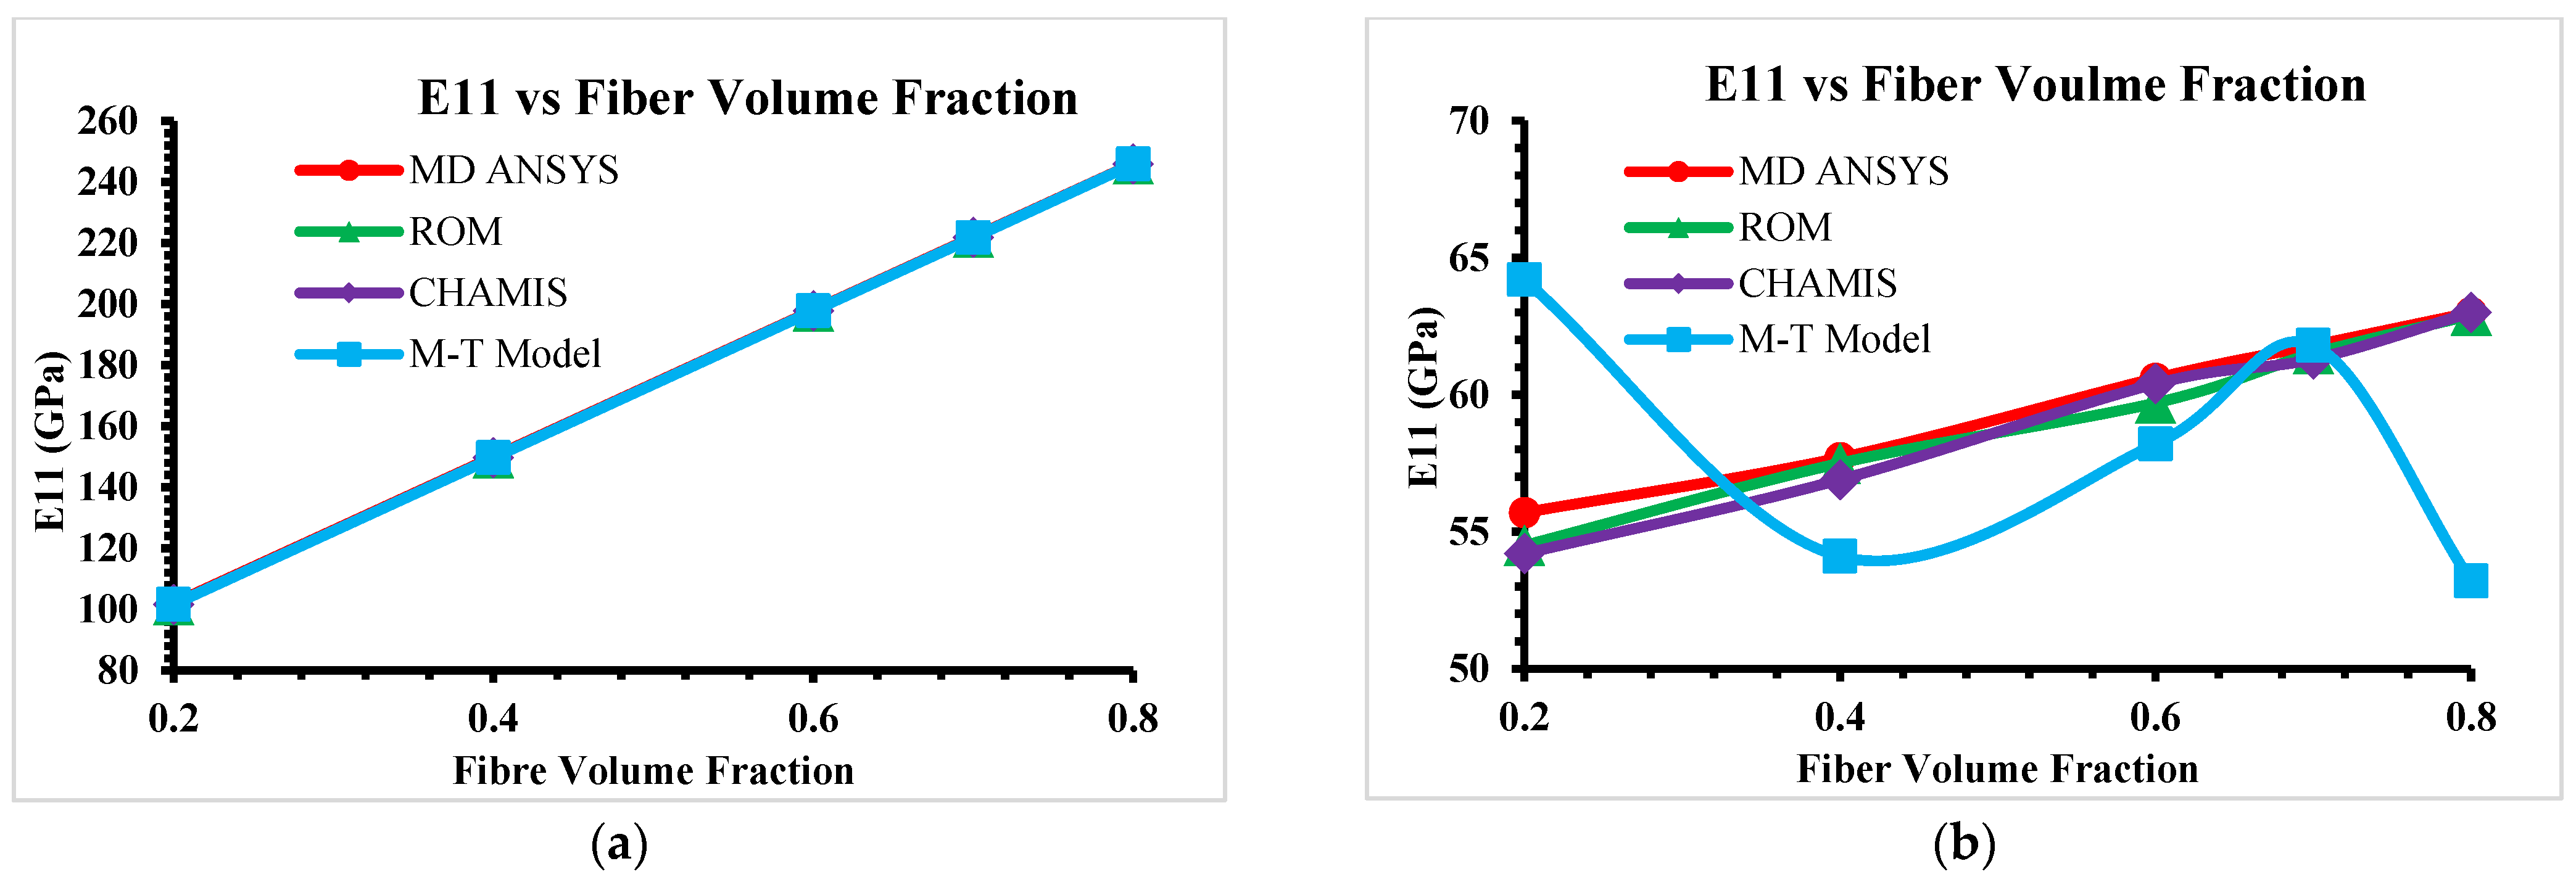
The outcome of longitudinal Young’s modulus E11 at various fiber volume fractions using the ANSYS 2024/R2 material designer and analytical models are shown in Figure 2a,b. From Figure 2a, it is evident from graphical representation that the results of the software are in agreement with the analytical models for the microscale model while Figure 2b shows that for the mesoscale model, software and the analytical model are closer except for in M-T Model, which provides higher and lower values of E11 and only meets the graph at 70% of the fiber volume.
Figure 2. (a) Microscale E11 vs. Vf. (b) Mesoscale E11 vs. Vf.

5.2. Fiber Volume Fraction on Transversal Young’s Modulus E22 and E33

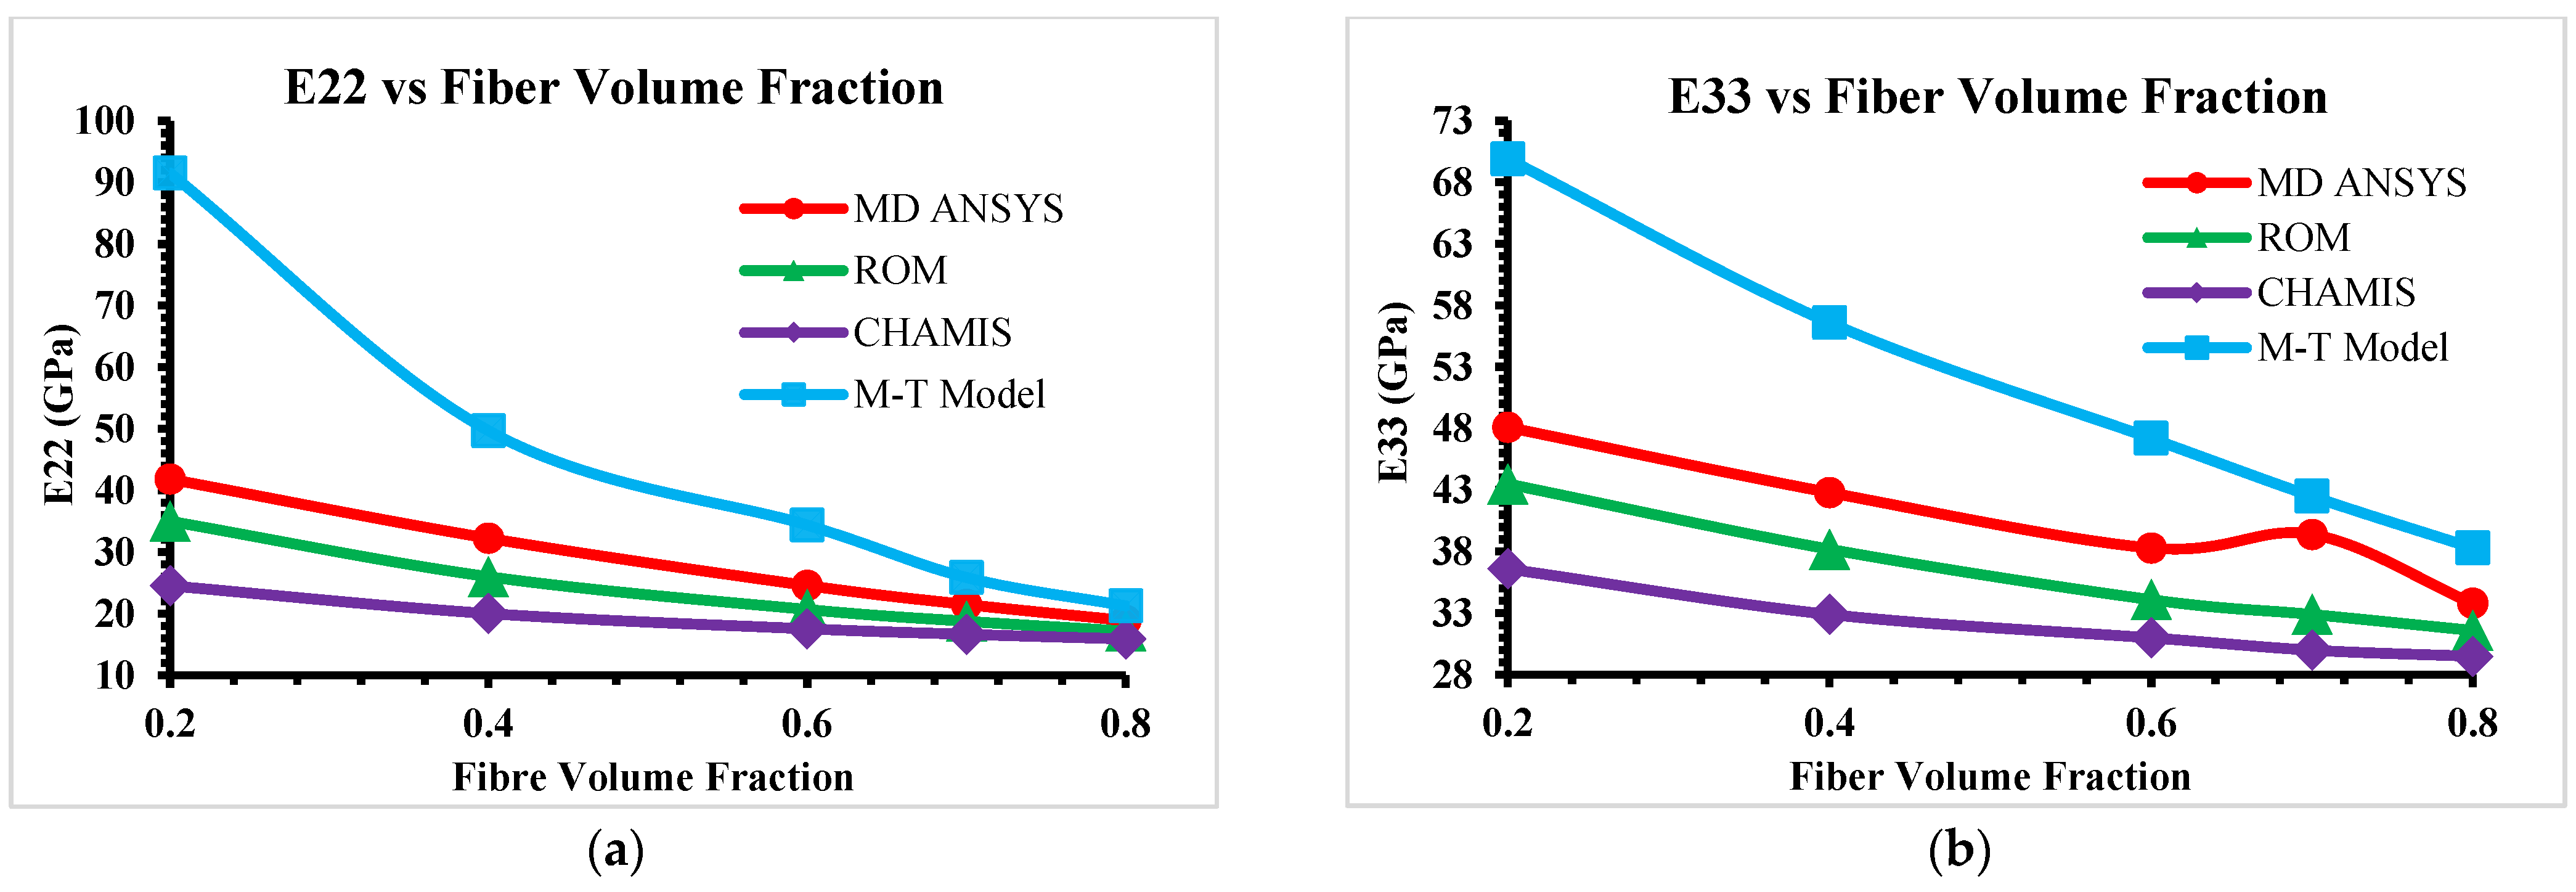
Transversal Young’s modulus is calculated using analytical models and using the ANSYS material designer and results show a higher value of E22 using the material designer as compared to the ROM and Chamis models at various fiber volume fractions of the RVE model. Figure 3a shows the inverse behavior of the fiber volume fraction on E22 for the microscale model in MPa. Figure 3b also shows the same trend for E33 for the mesoscale model. The Mori–Tanaka Model provides the highest values of 20% fiber volume, as compared to other models in both micro- and mesoscale modeling.
Figure 3. (a) Microscale E22 vs. Vf. (b) Mesoscale E33 vs. Vf.

5.3. Fiber Volume Fraction on In-Plane Shear Modulus G12

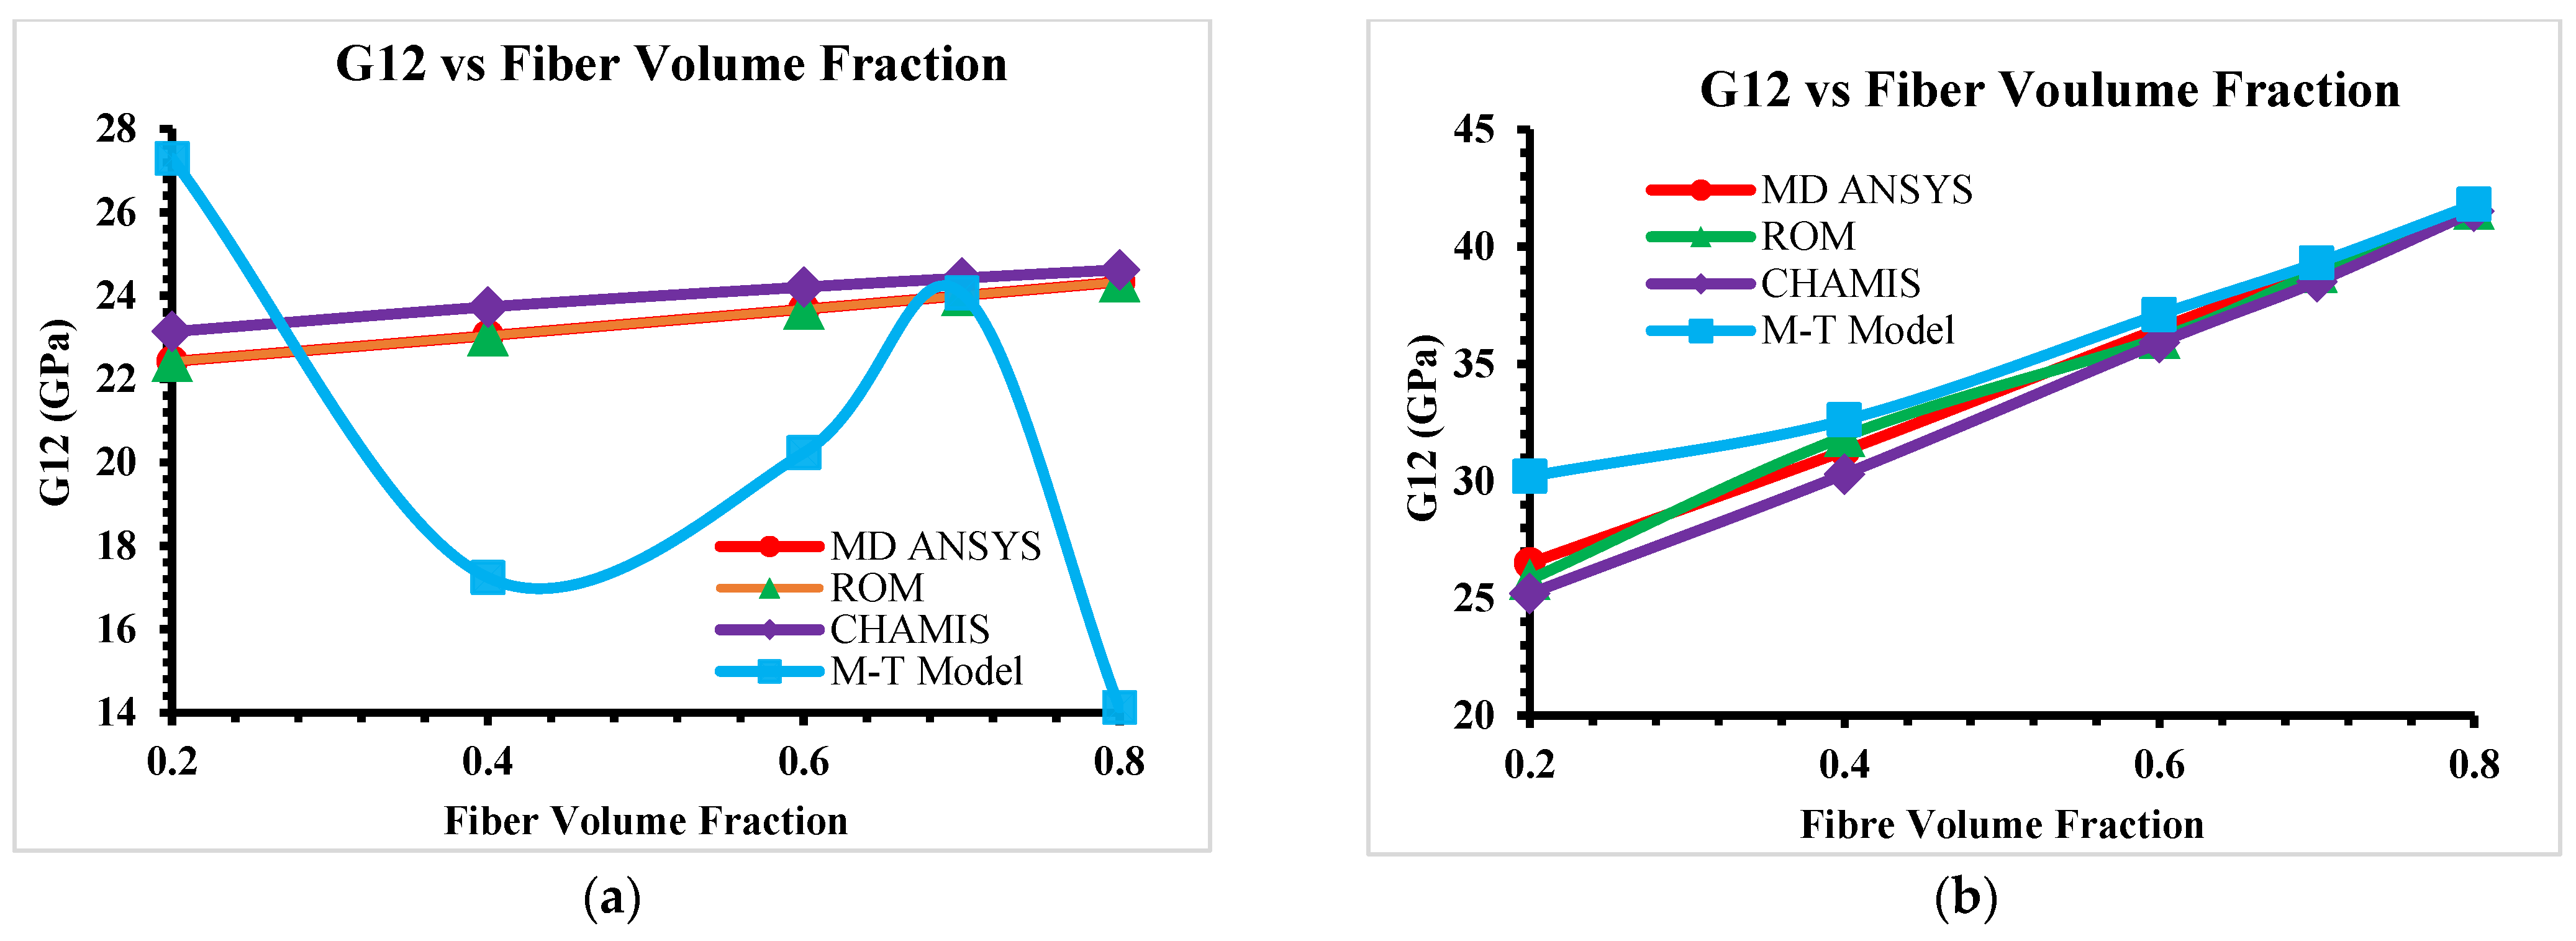
The values of G12 at various fiber volumes are quite close for the microscale model but the M-T Model provides a fluctuating curve and meets the other predictions of the analytical and software model only at 70% of fiber volume, which represented in Figure 4a. However, for the mesoscale model only at 20% of the fiber volume is the value slightly higher and further values are in agreement with the analytical and software results, as presented in Figure 4b.
Figure 4. (a) Microscale G12 vs. Vf. (b) Mesoscale G12 vs. Vf.

5.4. Fiber Volume Fraction on Out-of-Plane Shear Modulus G23

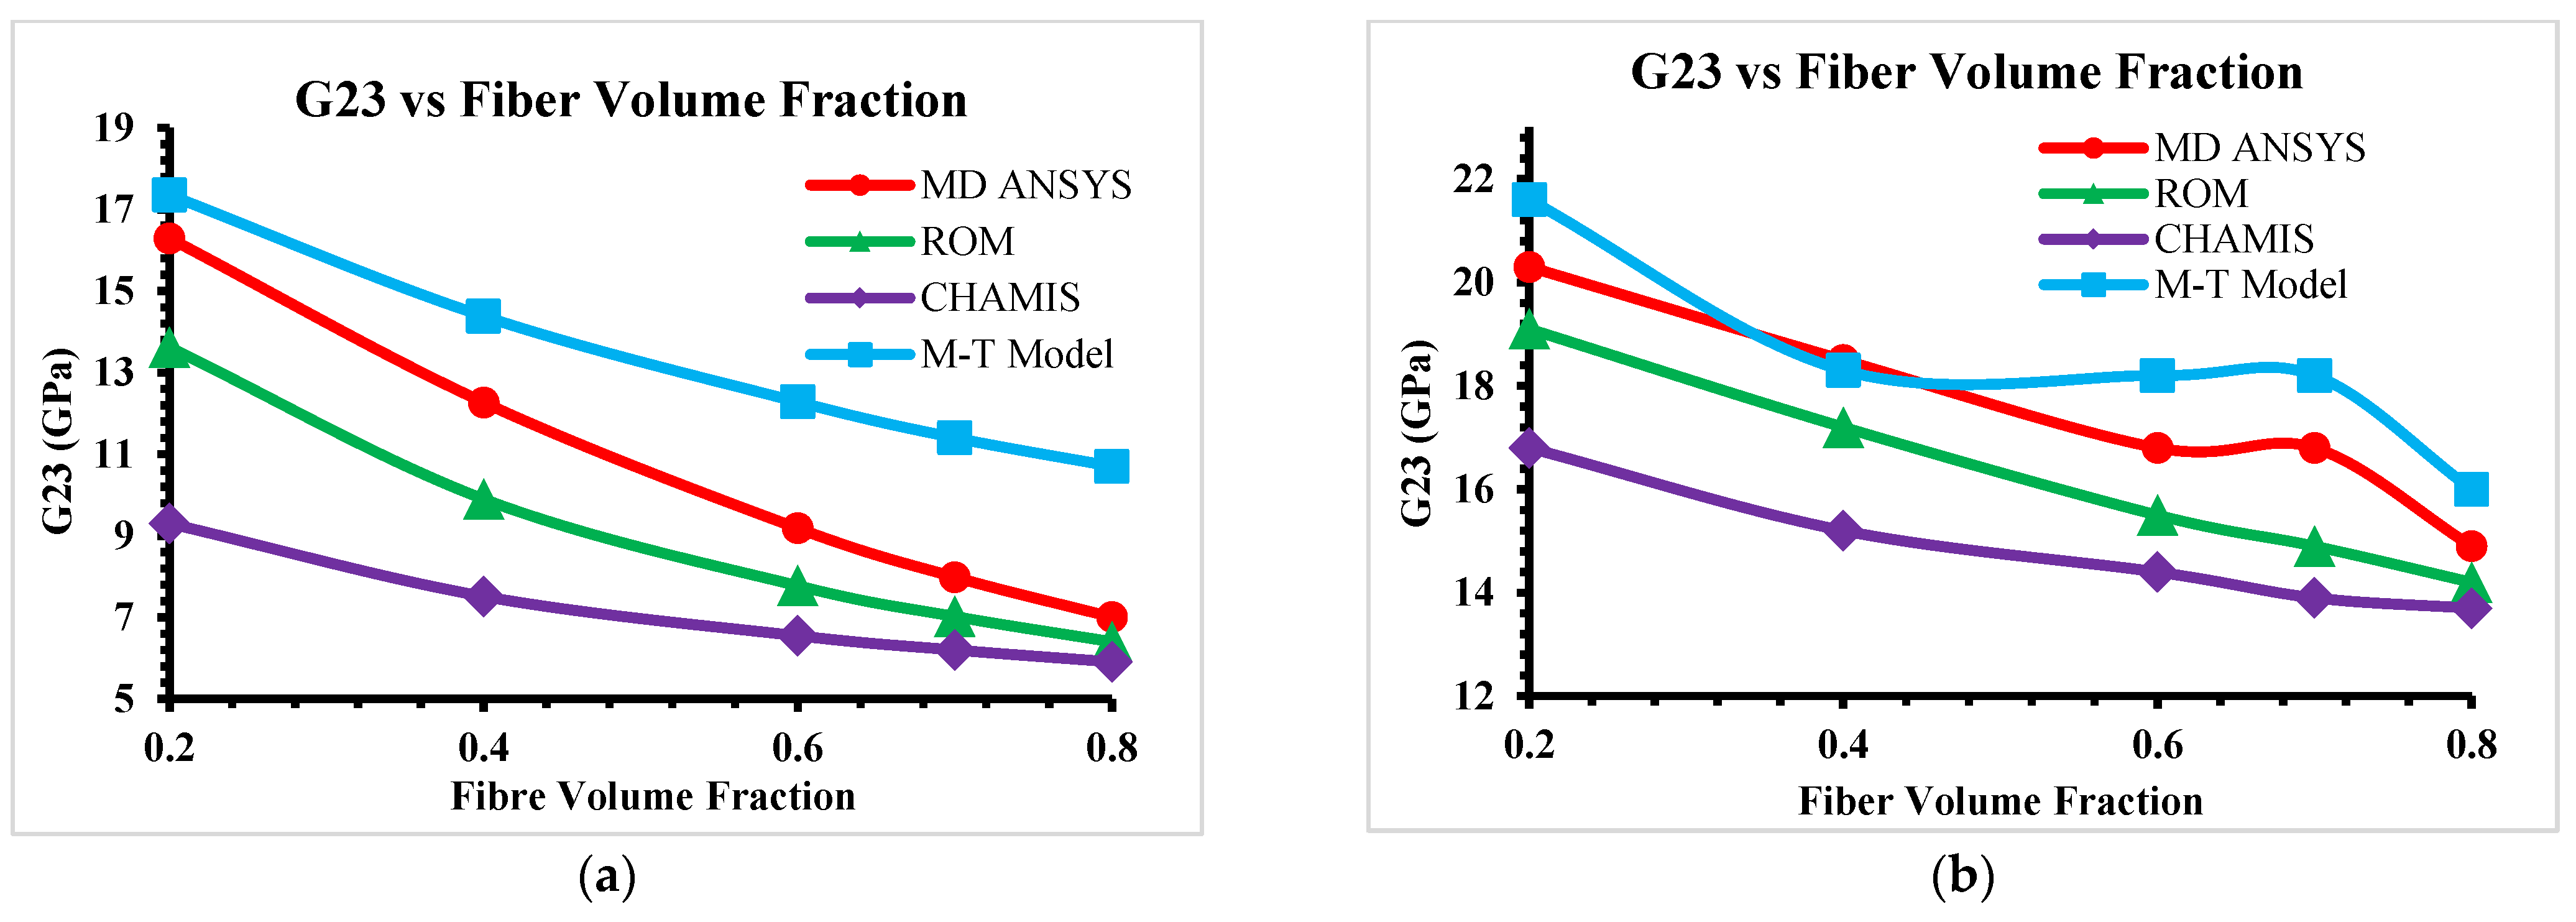
For out-of-plane shear modulus G23, the M-T Model produces the highest and the Chamis Model produces the lowest values at various fiber volume fraction for both the micro and mesoscale model, as shown in Figure 5a,b.
Figure 5. (a) Microscale G23 vs. Vf. (b) Mesoscale G23 vs. Vf.

5.5. Fiber Volume Fraction on In-Plane Poisson’s Ratio v12

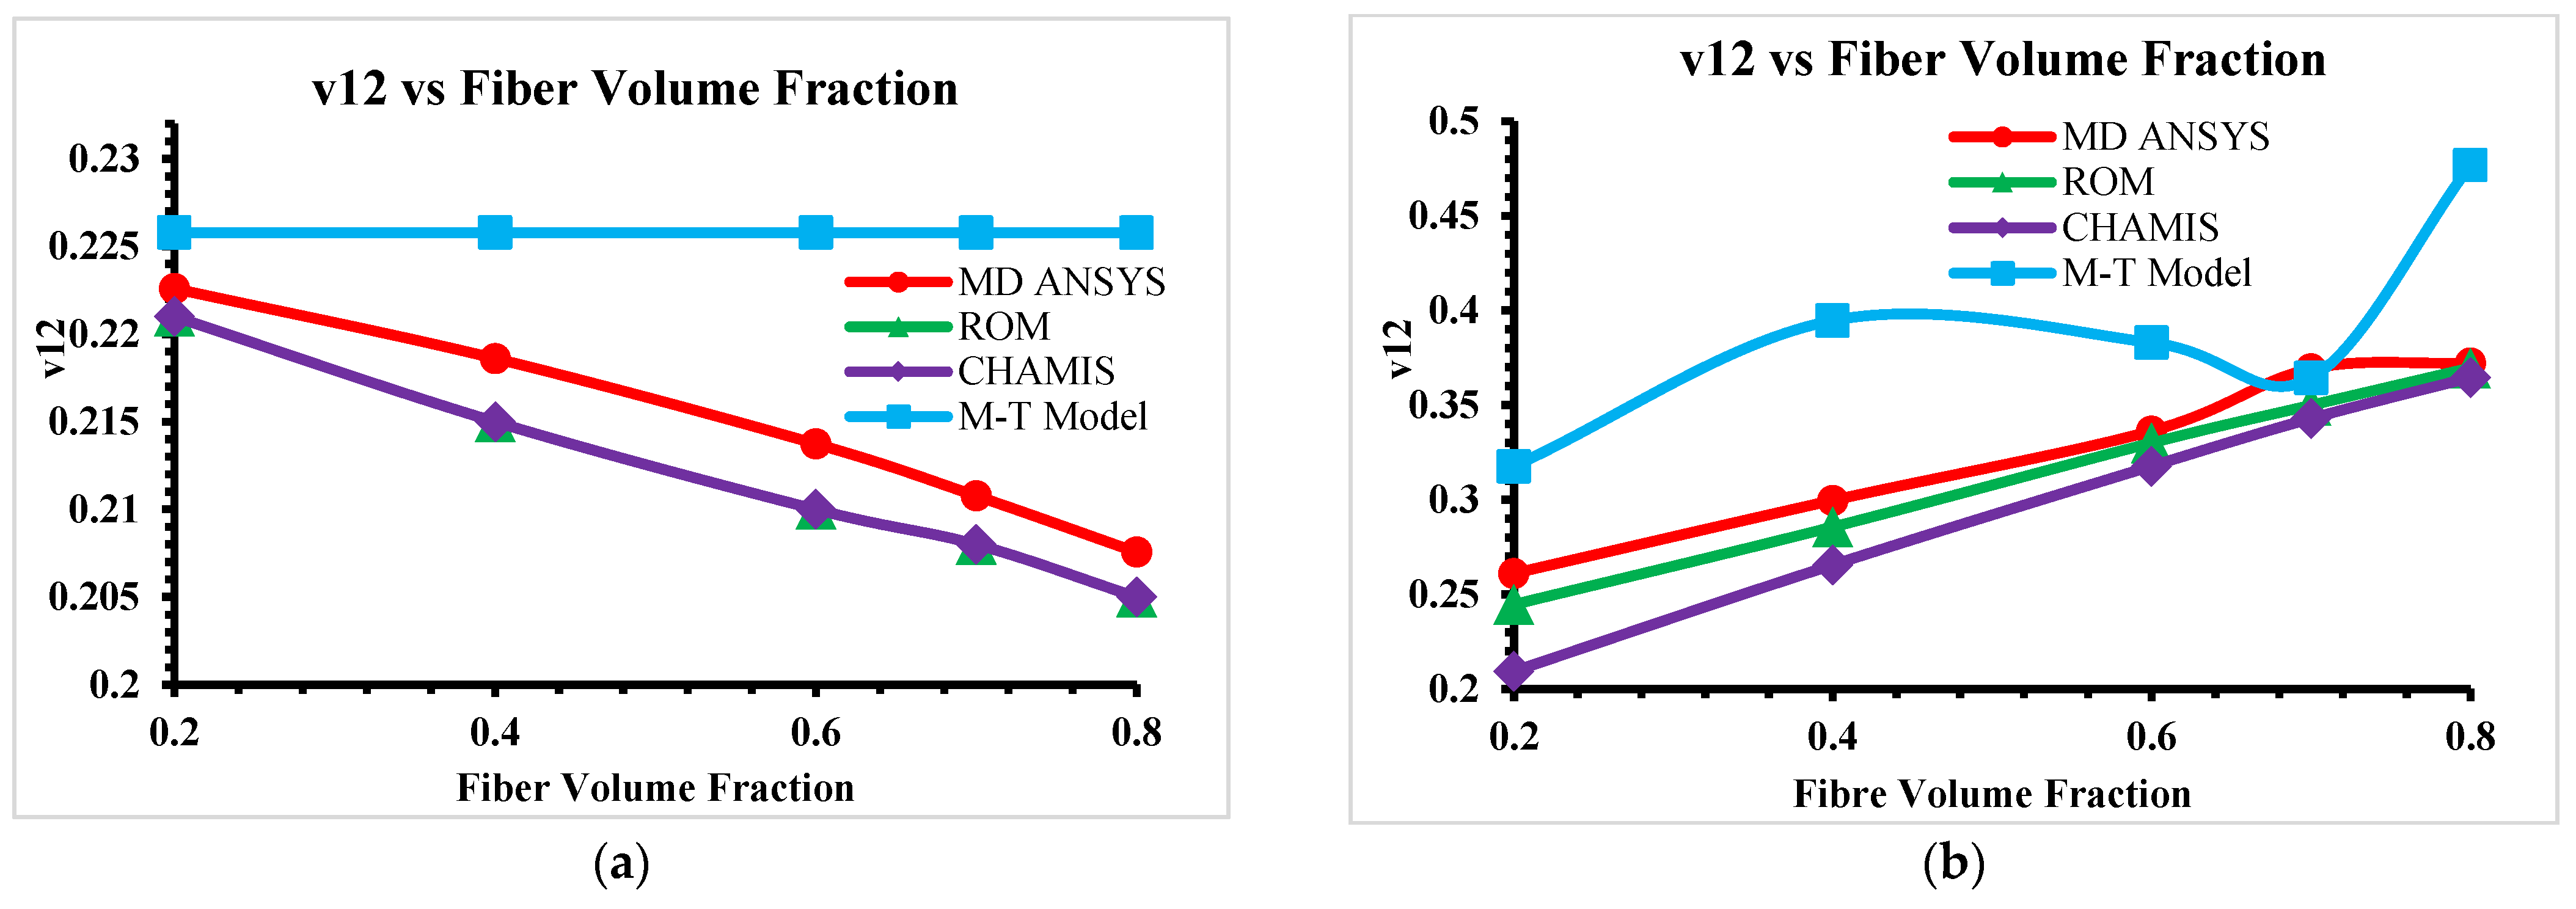
The output of the analytical and software results is quite close for the microscale model, but the M-T Model provides a constant value at each fiber volume fraction, as shown in Figure 6a and for the mesoscale model the values are again in well agreement and the M-T Model meets the other predictions at 70% of fiber volume, as depicted in Figure 6b.
Figure 6. (a) Microscale v12 vs. Vf. (b) Mesoscale v12 vs. Vf.

5.6. Fiber Volume Fraction on Out-of-Plane Poisson’s Ratio v23 and v13

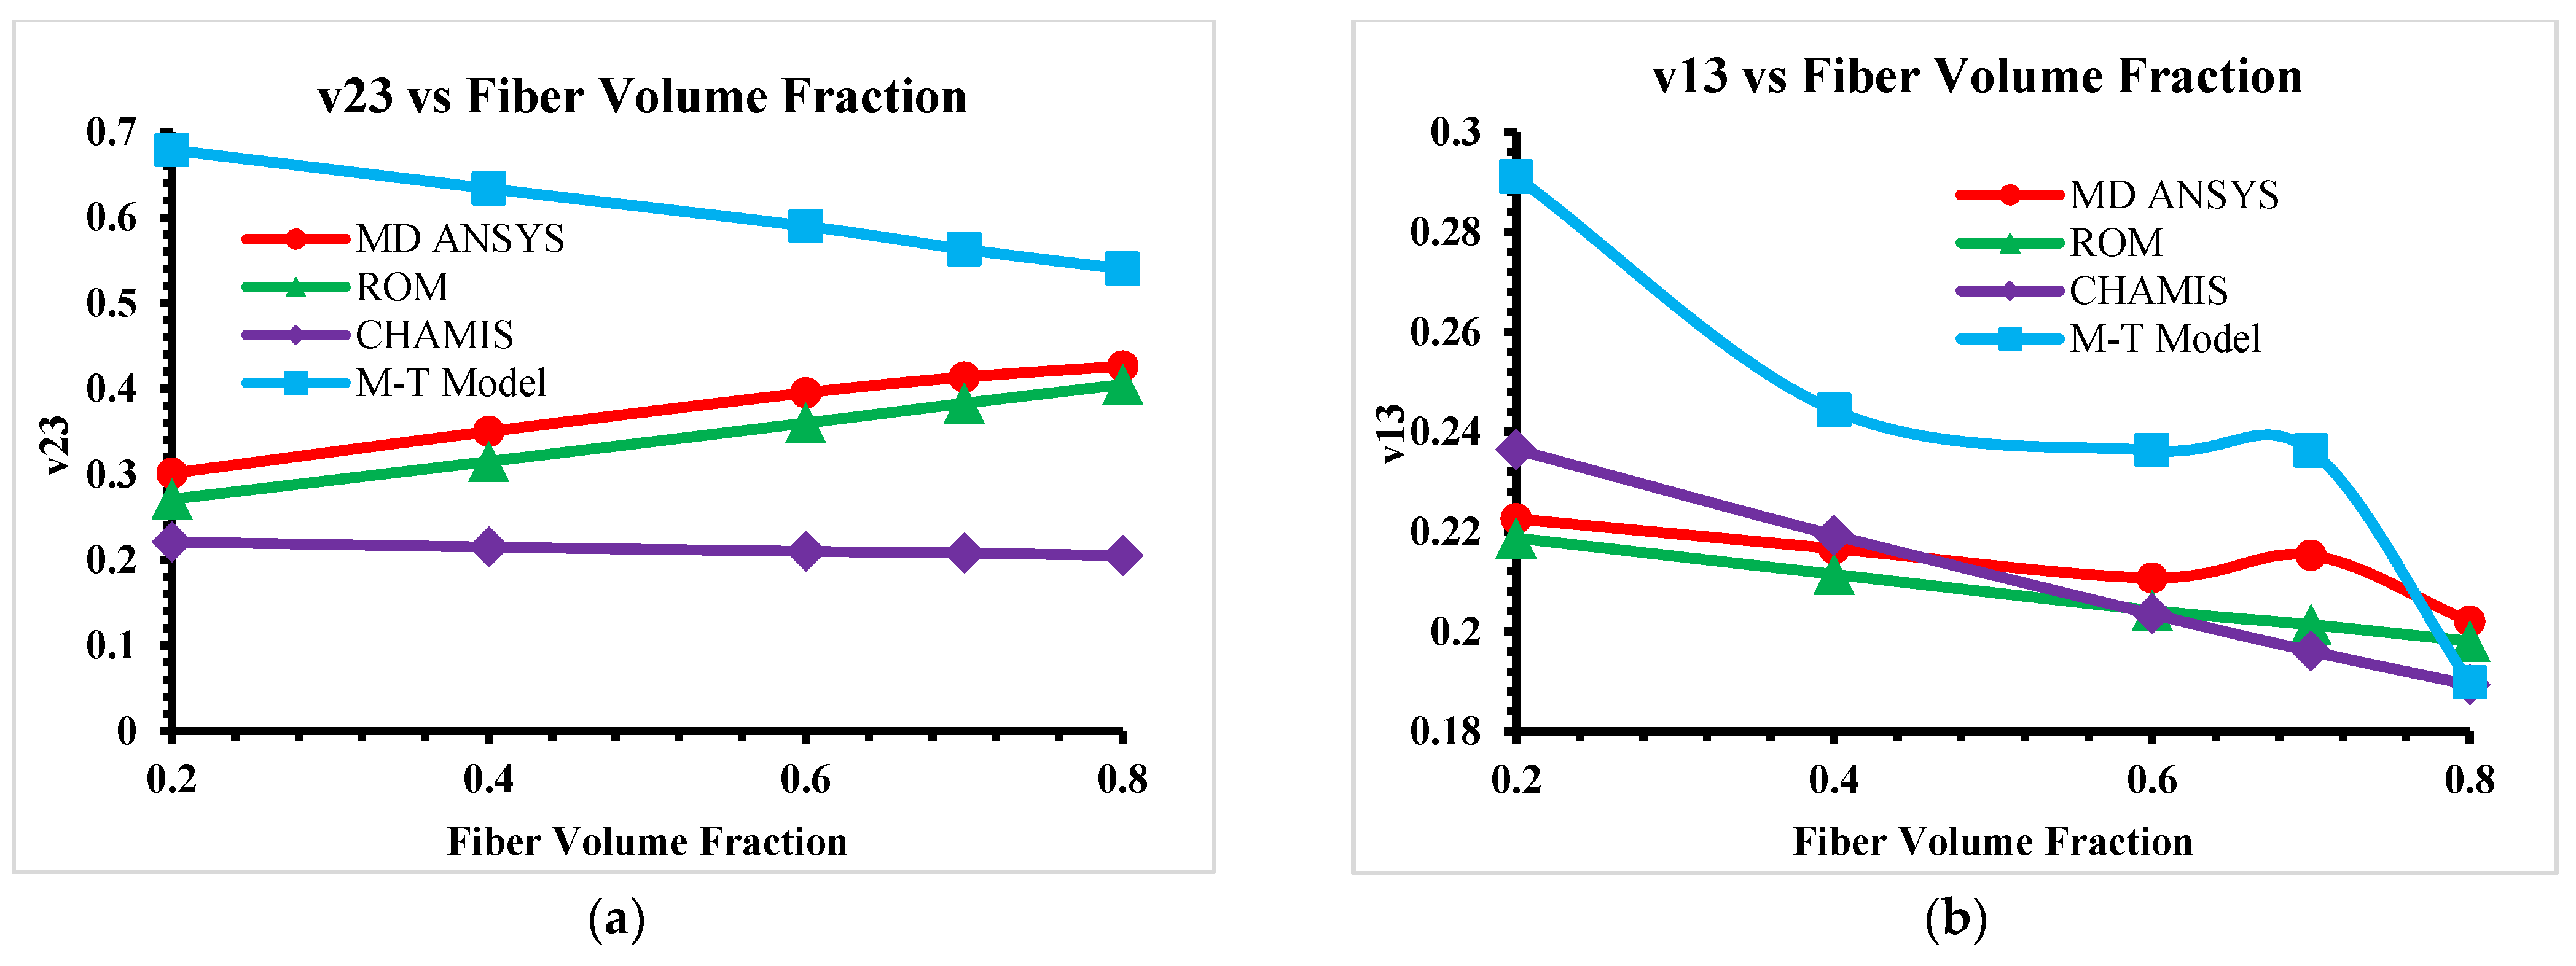
For the microscale model, the Chamis Model provides the lowest and the M-T Model produces the highest values of out-of-plane Poisson’s ratio while the ROM and software results are identical, as shown in Figure 7a. For the mesoscale model, the output of the software and analytical models is quite close but the M-T provides higher values and only meets the other predicted models at 80% of fiber volume and the material designer produces a slightly higher value of v13 at 70% of fiber volume, as represented in Figure 7b.
Figure 7. (a) Microscale v23 vs. Vf. (b) Mesoscale v13 vs. Vf.

5.7. Youngs’s Modulus Across Numerical and Analytical Models

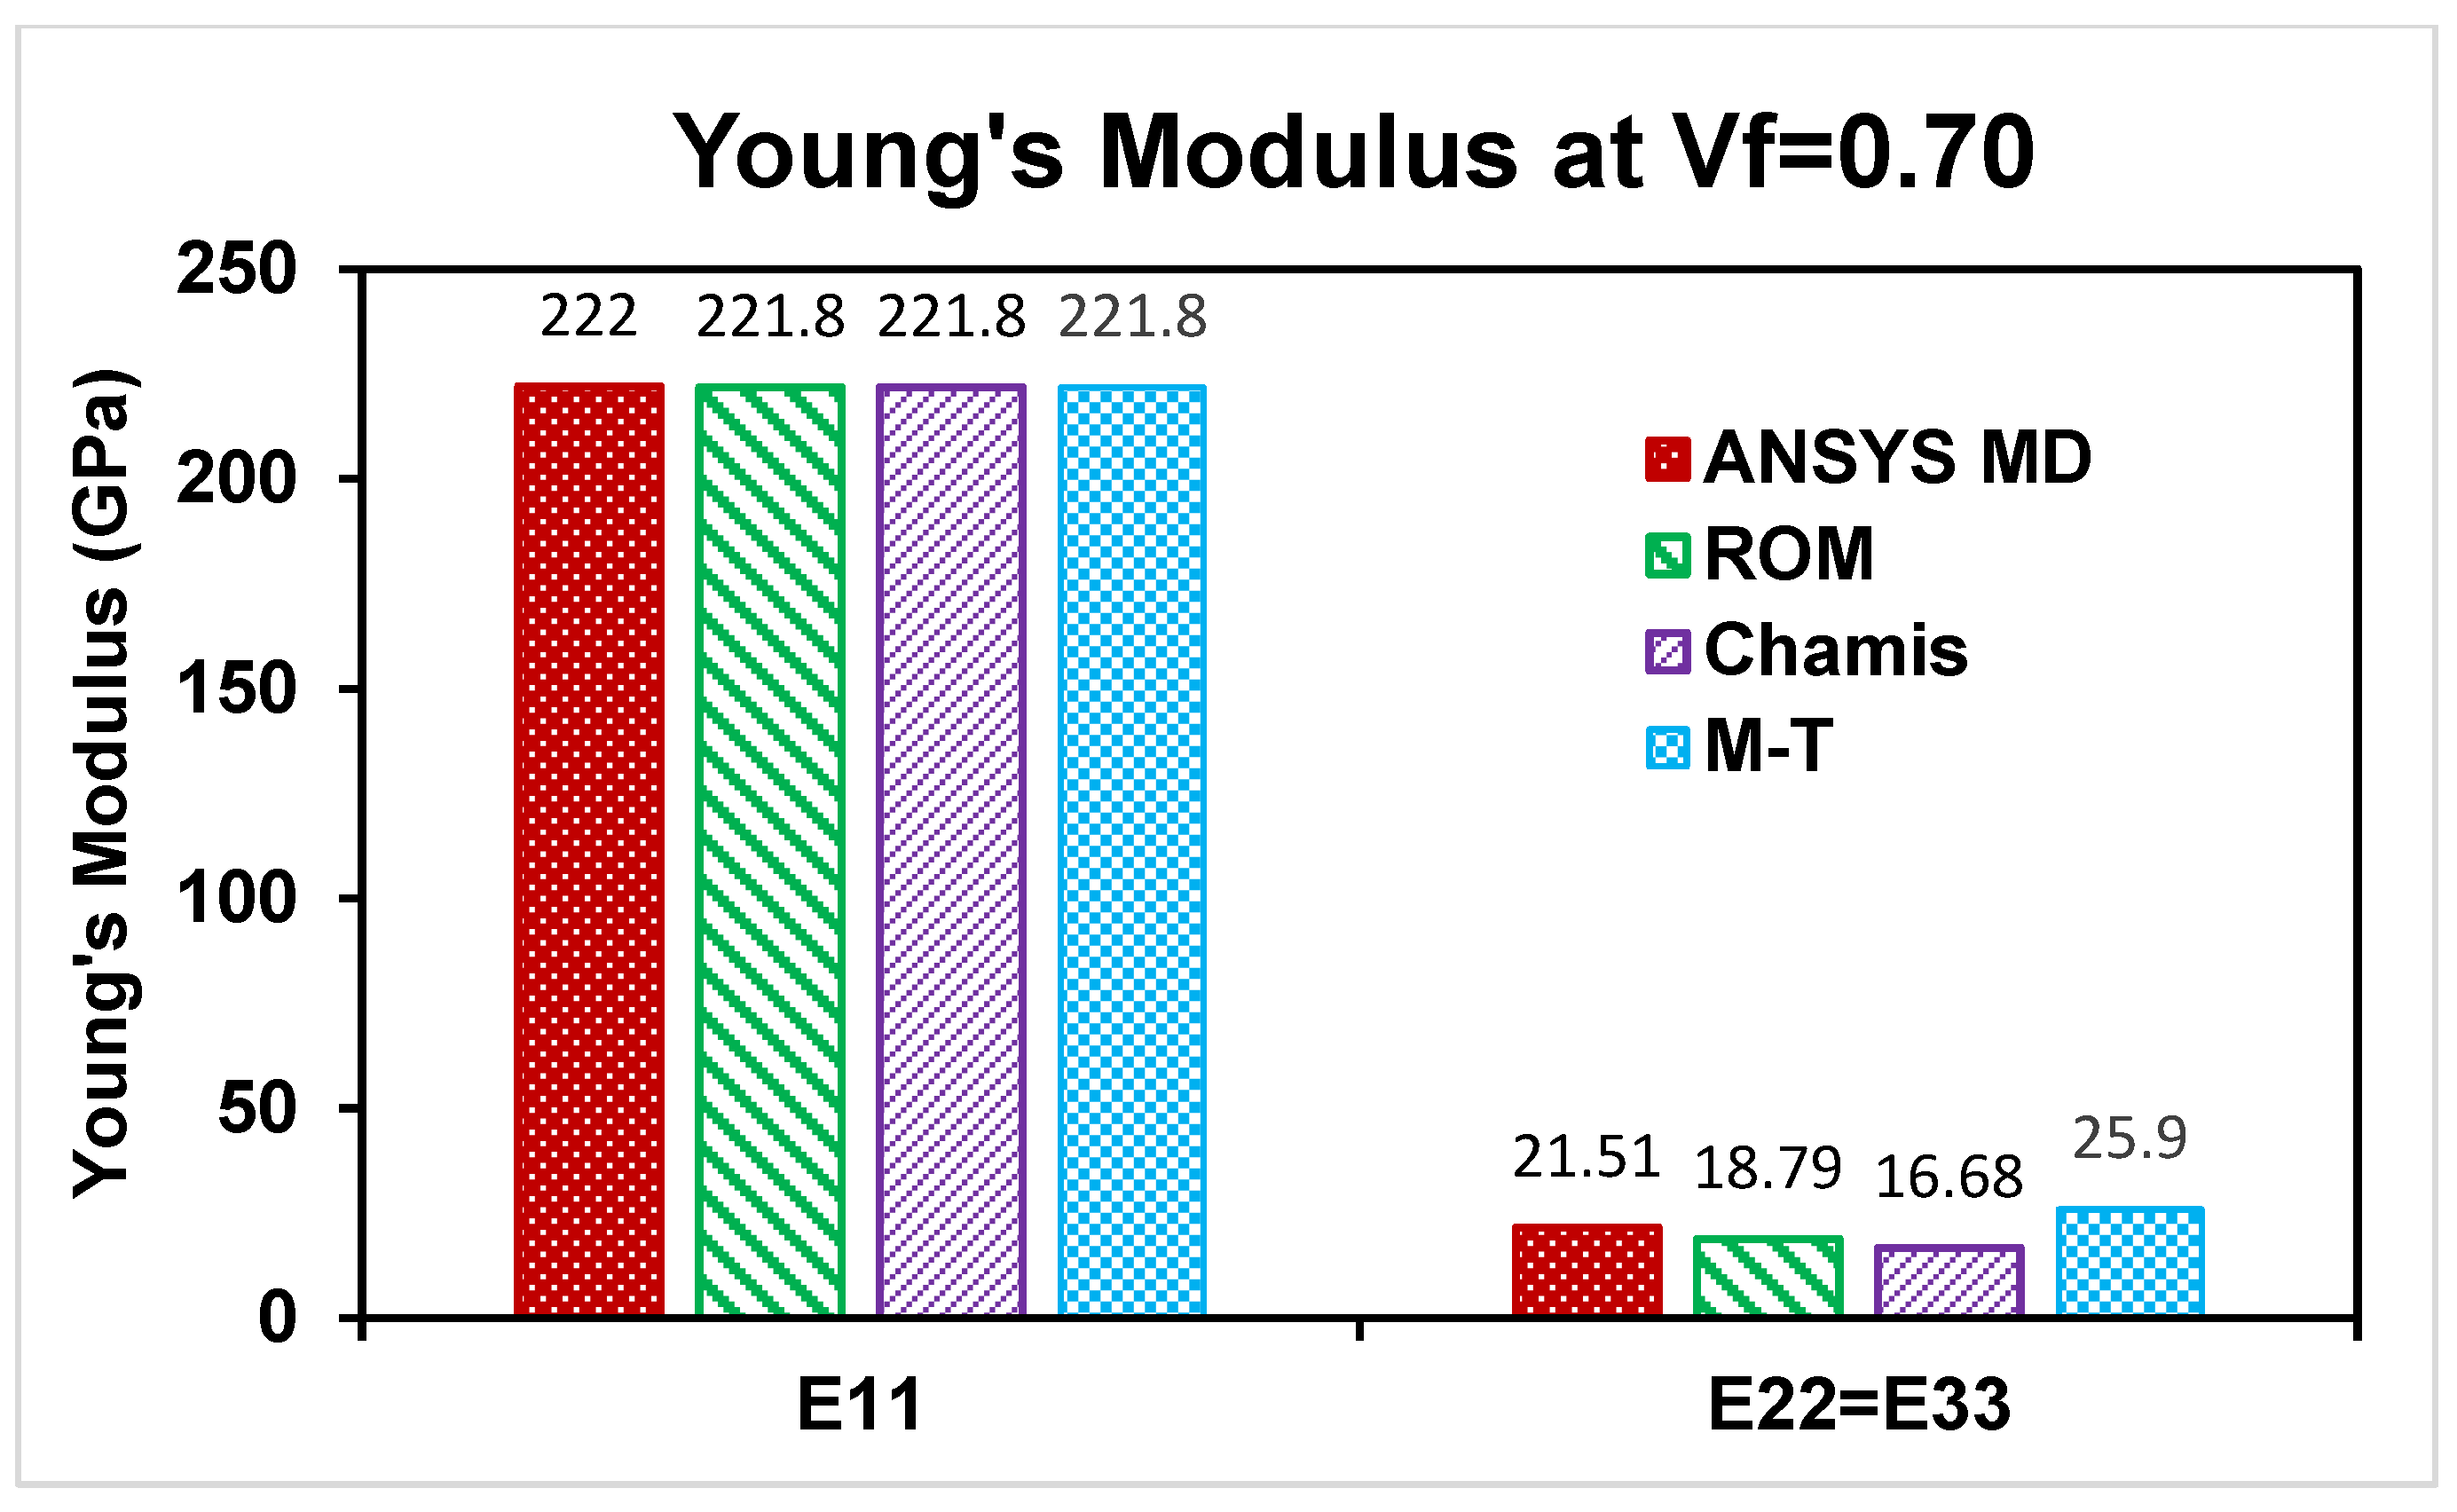
Longitudinal and transversal Young’s moduli at the microscale level at fixed fiber volume fraction Vf = 0.70 were compared with the analytical and numerical methods to see the comparative results predicted by both methods. From Figure 8, both methods accurately predict the same results for longitudinal Young’s modulus and there exists a variation in the results of transversal Young’s modulus, where Mori–Tanaka predicts the highest value while Chamis predicts the lowest values.
Figure 8. Comparison of Young’s modulus.

6. Conclusions

This paper mainly focused on FEA tools and analytical models for predicting elastic properties of CMCs at micro- and mesoscale levels. Analytical models are limited to predicting unidirectional (UD) material properties only at microscale level; however, predicted microscale elastic properties can be used to develop a mesoscale-woven RVE model in simulation software. The ANSYS material designer provides the facilities to develop and predict orthogonal elastic properties of UD Hexagonal RVEs (microscale) and then transfer these microscale properties to develop and predict orthogonal-woven RVEs (mesoscale). In-plane woven composites properties are well aligned for analytical models and numerical models; however, out-of-plane properties show a variation, as the Mori–Tanaka Model predicts higher values at various fiber volume fractions. The Mori–Tanaka Model captures matrix constraints on carbon fiber more rigorously, particularly at high fiber volume fraction, where stress interactions become non-linear as it is highly sensitive to matrix stiffness and interaction assumptions. On other hand, the Rule of Mixtures and Chamis models rely on oversimplified assumptions about fiber–matrix interactions and fail to account for three-dimensional stress transfers or microstructural geometry, they frequently underpredict transverse and shear properties (such as E22, G12 and G23). GENOA software is used as a reference software for the analysis of elastic properties of the composite. In addition to the ANSYS material designer, there are some other FEA tools like Digimat (Nastran and Patran), Altair multiscale designer (ABAQUS) and SwiftComp™ code using TexGen4SC for geometrical modeling, to better compute the best FEA tool to predict the elastic behavior of woven composites.
Author Contributions

Conceptualization and framework, G.S. and R.N.; methodology, software and draft preparation, S.U.; supervision and project administration, R.N., G.S., A.D.F. and M.D.S.F. All authors have read and agreed to the published version of the manuscript.

Funding

Authors are highly thankful to CIRA (Italian Aerospace Research Centre) for funding, support and composite materials sample providence and the PNRR (National Resilience and Recovery Program) for the grant under Ministerial Decree No. 117.

Institutional Review Board Statement

Not applicable.

Data Availability Statement

Data will be available on request.

Acknowledgments

Authors acknowledged the support from the University of Salento and the CIRA (Italian Aerospace Research Centre).

Conflicts of Interest

Angelo De Fenza and Mario De Stefano Fumo were employed by the Centro Italiano Ricerche Aerospaziali (CIRA) Corporate. The remaining authors declare that the research was conducted in the absence of any commercial or financial relationships that could be construed as a potential conflict of interest.

References

  1. Binner, J.; Porter, M.; Baker, B.; Zou, J.; Venkatachalam, V.; Diaz, V.R.; D’ANgio, A.; Ramanujam, P.; Zhang, T.; Murthy, T.S.R.C. Selection, processing, properties and applications of ultra-high temperature ceramic matrix composites, UHTCMCs—A review. Int. Mater. Rev. 2020, 65, 389–444. [Google Scholar] [CrossRef]
  2. Krenkel, W. Carbon fibre reinforced silicon carbide composites (C/SiC, C/C-SiC). In Handbook of Ceramic Composites; Springer: Boston, MA, USA, 2005; pp. 117–148. [Google Scholar]
  3. Fagiano, C.; Genet, M.; Baranger, E.; Ladevèze, P. Computational geometrical and mechanical modeling of woven ceramic composites at the mesoscale. Compos. Struct. 2014, 112, 146–156. [Google Scholar] [CrossRef]
  4. Chen, M.; Liu, Q. Multi-scale modelling of progressive damage and failure behaviour of 2D woven SiC/SiC composites. Ceram. Int. 2021, 47, 28821–28836. [Google Scholar] [CrossRef]
  5. Múgica, J.I.; Lopes, C.S.; Naya, F.; Herráez, M.; Martínez, V.; González, C. Multiscale modelling of thermoplastic woven fabric composites: From micromechanics to mesomechanics. Compos. Struct. 2019, 228, 111340. [Google Scholar] [CrossRef]
  6. Onodera, S.; Tsuyuki, J.; Okabe, T. Micromechanical modeling for the in-plane mechanical behavior of orthogonal three-dimensional woven ceramic matrix composites with transverse and matrix cracking. Int. J. Damage Mech. 2022, 31, 165–189. [Google Scholar] [CrossRef]
  7. Kirane, K.; Salviato, M.; Bazant, Z.P. Microplane-Triad Model for Elastic and Fracturing Behavior of Woven Composites. J. Appl. Mech. Trans. ASME 2016, 83, 041006. [Google Scholar] [CrossRef]
  8. Mali, R.; Pise, U. Modeling elastic properties of biocomposites using various analytical models and ansys material designer. Mater. Today Proc. 2023, 72, 1372–1378. [Google Scholar] [CrossRef]
  9. Wang, M.; Zhang, P.; Fei, Q.; Guo, F. Modified micro-mechanics based multiscale model for progressive failure prediction of 2D twill woven composites. Chin. J. Aeronaut. 2020, 33, 2070–2087. [Google Scholar] [CrossRef]
  10. Liu, X.; Rouf, K.; Peng, B.; Yu, W. Two-step homogenization of textile composites using mechanics of structure genome. Compos. Struct. 2017, 171, 252–262. [Google Scholar] [CrossRef]
  11. Rayhan, S.B.; Rahman, M.M. Modeling elastic properties of unidirectional composite materials using ansys material designer. Procedia Struct. Integrity 2020, 28, 1892–1900. [Google Scholar] [CrossRef]
  12. Shojaei, A.; Li, G.; Fish, J.; Tan, P.J. Multi-scale constitutive modeling of Ceramic Matrix Composites by Continuum Damage Mechanics. Int. J. Solids Struct. 2014, 51, 4068–4081. [Google Scholar] [CrossRef]
  13. Kou, G.; Zhang, W.; Chen, J.; Chen, J.; Yang, Z. An improved rule of mixture model based on deformation coordination in predicting engineering constants of unidirectional fiber reinforced composites. Mater. Today Commun. 2023, 34, 105072. [Google Scholar] [CrossRef]
  14. ANSYS Inc. Material Designer User’s Guide. 2023. Available online: http://www.ansys.com (accessed on 1 January 2024).
  15. Rayhan, S.B.; Rahman, M.M. Effect of micromechanical properties on the critical buckling load of woven composite plate: A multiscale analysis. Procedia Struct. Integr. 2020, 28, 1901–1908. [Google Scholar] [CrossRef]
  16. Bacarreza, O.; Wen, P.; Aliabadi, M. Woven Composites: Computational and Experimental Methods in Structures; Imperial College Press: London, UK, 2015; Volume 6, pp. 1–74. [Google Scholar]
Disclaimer/Publisher’s Note: The statements, opinions and data contained in all publications are solely those of the individual author(s) and contributor(s) and not of MDPI and/or the editor(s). MDPI and/or the editor(s) disclaim responsibility for any injury to people or property resulting from any ideas, methods, instructions or products referred to in the content.

Article Metrics

Citations

Article Access Statistics

Multiple requests from the same IP address are counted as one view.