Abstract
Project monitoring is an important element in project management that aims to ensure project implementation in accordance with the plan, schedule, budget, and objectives that have been set. The ineffectiveness of project monitoring can cause various problems, such as delays, cost overruns, inappropriate quality of results, and poor communication between stakeholders. To address these issues, technological advances such as YOLO (You Only Look Once) and Reinforcement Learning (RL) offer innovative solutions through real-time visual detection and data-driven automated decision making. This research aims to develop a web-based project monitoring system that integrates YOLO to detect activities in the field, such as workers and heavy equipment, and RL to provide optimal recommendations for resource management. The implementation of the system is expected to increase efficiency, reduce risk, and support more accurate decision making. Based on previous research, the adoption of AI technology in project monitoring is proven to reduce operational costs and increase productivity. This web-based system is designed to provide flexibility and accessibility, allowing users to monitor projects in real-time through an interactive interface. The expected outcome of this research is the creation of an effective technological solution to improving the efficiency of construction project management, as supported by the findings of previous research that shows the great potential of AI in the construction sector.
1. Introduction
Project monitoring is an important process in project management that aims to ensure that the implementation of the project runs according to the plan, schedule, budget, and objectives that have been set. In practice, project monitoring involves collecting, analyzing, and reporting project data on an ongoing basis to identify potential problems and take corrective action if needed. Problems that often arise due to the absence of project monitoring are difficulties in accurate estimation of project time and cost, delays in identifying the risk of project delays, complexity in the formation and management of effective teams, lack of real-time visibility of team productivity, and difficulty in optimizing resource allocation and budget. Digital project management faces complex challenges in ensuring a balance between productivity, budget, and deadlines. Project supervisors need to make quick and informed decisions regarding resource allocation but often lack accurate real-time data for decision making. Technological advances have presented various tools to support efficient project monitoring, one of which is the implementation of YOLO and RL technologies for project monitoring to provide innovative solutions to overcome challenges in project management, such as risk detection and resource optimization. Previous research shows that the adoption of AI technology in the construction industry can reduce operational costs and increase productivity [1]. The integration of YOLO and RL can result in a system capable of detecting visual conditions in real time and performing automated decision making. For example, YOLO can be used to monitor worker and machine activities at the project site, while RL can provide optimal recommendations based on real-time data analysis. Studies such as the one conducted by Chen show the effectiveness of this combination in smart surveillance systems [2]. The expected solution was to create a web-based application to offer flexibility and accessibility to monitor and manage projects efficiently. This technology allows users to access real-time project data through an interactive interface. Web-based systems supported by AI technology can improve the efficiency of supervision and decision making in construction projects [3].
2. Materials and Methods
A research methodology that can be used for the implementation of YOLO technology and Reinforcement Learning for web-based project monitoring is followed. As shown in Figure 1, the research stages consist of problem identification, project initialization, methodology, conclusions, and system implementation.
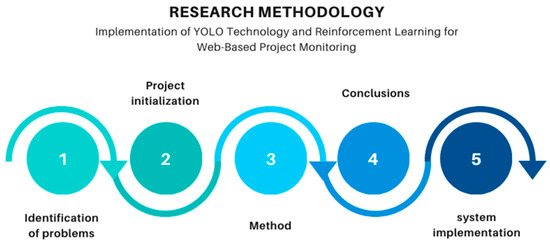
Figure 1.
Research stages.
2.1. Problem Identification
Problem identification is carried out on data assumptions in one of the IT projects. Problems that often arise in the absence of project monitoring are difficulties in accurate estimation of project time and cost, delays in identifying the risk of project delays, complexity in the formation and management of effective teams, lack of real-time visibility of team productivity, and difficulty in optimizing resource allocation and budget.
2.2. Project Initialization
Project initiation is the initial stage in project management where the project idea or need is defined, evaluated, and approved to proceed. This stage involves identifying the objectives, scope, stakeholders, and required resources. Project initiation aims to ensure that the project is feasible and in line with organizational goals before resources are allocated. At project initiation, data are collected for risk analysis, project progress tracking, and performance evaluation [4]. Data collection includes budget prediction and optimization, estimation of project completion time, and team performance evaluation.
2.3. Project Monitoring Methods
Project monitoring is an integrated system that uses modern web technologies to monitor, analyze, and manage projects in real-time, with a focus on digital collaboration and data-driven decision making [5]. In other words, modern project monitoring uses web technology to integrate project management tools, data analysis, and team collaboration in one centralized system [6]. The project monitoring method uses two methods, as follows.
2.3.1. Yolo Method
YOLO as an algorithm uses a single convolutional network to simultaneously predict multiple bounding boxes and class probabilities, making it very fast compared to two-stage detector methods [7]. YOLO as a detector that optimizes speed and accuracy simultaneously by using one neural network to predict objects [8]. The YOLO method includes the calculation of bounding box prediction, intersection over union (IoU), and loss function.
2.3.2. Reinforcement Learning (RF) Method
Reinforcement Learning is a machine learning paradigm in which an agent learns through interaction with the environment, takes actions based on current conditions, and receives rewards as feedback to optimize its decision-making policy [9]. In this case, this method is used for decision-making policies in a project application. The reinforcement learning (RF) method includes the calculation of the Time Formula (days_simulated), Calculation of Steps for Time Calculation, Budget Formula, and Calculation for Each User.
2.4. Project Conclusion
The project conclusion is the final part of the project report or evaluation that summarizes the results, achievements, and overall evaluation of the project. This conclusion consists of goal achievement, team performance evaluation, and project budget.
2.5. System Implementation
The system implementation stage is part of the end of this research, which aims to prove that the YOLO and Reinforcement Learning methods are successfully used in project monitoring. The system implementation stage is the creation of a website-based system using the php programming language and mysql database. System builders include Requirement Analysis, System Design, Implementation, Testing, Deployment, and Maintenance [10].
3. Results and Discussion
The following are the steps in discussing the YOLO and Reinforcement Learning methods in project monitoring along with the implementation results in the form of systems, characteristics and elements, and the role of information systems.
3.1. Project Initialization
Project initiation is an important foundation for overall project success. Without this stage, the project risks problems such as waste of resources, misalignment of goals, or failure to achieve the desired results. In the data project, initialization is performed on data assumptions in one of the IT projects.
3.1.1. Subsubsection
The importance of financial statement analysis is evident in the budget forecasting process, which can be used to identify financial trends, forecast future funding requirements, and manage financial risks more effectively. With a good understanding of financial statements, project managers can optimize resource allocation and improve efficiency in project implementation [11]. The following data on the prediction of budget optimization were used in the study:
- ●
- Total project budget.
- ●
- Cost per team or per hour.
- ●
- Completed assignments and their costs.
- ●
- Estimated time remaining for the active task.
The project details, including the assumed project identity as shown in Table 1 and the cost per member as shown in Table 2, are outlined in the study for effective budget forecasting and resource allocation.

Table 1.
Assumed project identity.
Table 2.
Cost per member.
3.1.2. Estimated Project Completion Time
The project is divided into several main stages, and each stage is given time and cost estimates based on labor, software, and infrastructure requirements. The results showed that careful planning in the early stages of the project can reduce the risk of delays and cost overruns [12]. The following are data assumptions in the time estimation stage of project completion:
- ●
- Number of tasks.
- ●
- Average duration of task completion per team member.
- ●
- Time already spent on specific tasks.
- ●
- Time allocated at the beginning of the project.
The estimated project completion time, as outlined in Table 3, is based on these assumptions.
Table 3.
Estimated project completion time.
3.1.3. Team Performance Evaluation
Project team performance is not only influenced by the achievement of financial targets but also by operational efficiency, client satisfaction, and the capabilities and productivity of human resources in the team [13]. The following are the results of the team performance evaluation research stages:
- ●
- Number of tasks completed by each team member.
- ●
- Average task completion time per member.
- ●
- Attendance rate or uptime (can be obtained from monitoring tools).
The team performance evaluation results, as shown in Table 4, summarize these key metrics.
Table 4.
Team performance evaluation.
3.2. Project Monitoring Methods
The next stage is the stage of applying or calculating project assumption data using the method used for monitoring, as follows.
3.2.1. Yolo Method
The steps in project monitoring using the YOLO method are bounding box prediction, intersection over union, and loss function. The following are the steps in solving using the YOLO method:
- ●
- Bounding box prediction
Each grid cell predicts a bounding box that includes the following:
where
x, y: The center coordinates of the bounding box relative to the grid cell.
w, h: The width and height of the bounding box relative to the image size.
C: Confidence score representing the certainty that the box contains an object, calculates as:
- ●
- Intersection over union (IoU)
Measuring the quality of bounding box prediction with
Area of Overlap: The area of overlap between the prediction box and the ground truth.
Area of Union: The combined area of the two boxes.
- ●
- Loss Function
YOLO optimizes detection using the following loss function:
Coordinate Loss:
Confidence Loss:
Class Probability Loss:
3.2.2. Reinforcement Learning (RL) Method
The steps in project monitoring using the Reinforcement Learning method, including Time Formula (days_simulated), Calculation of Steps for Time Calculation, Budget Formula, and Calculation for Each User are as follows:
- ●
- Time Formula (days_simulated)
Time is calculated as the number of iterations required to reach the done state (done = True) in the RL environment. The done state occurs when the (state) approaches or reaches 99%:
where
- action: A discrete value (0 to 9) chosen by the PPO model, representing a 1% to 10% increase in work effectiveness.
- days_simulated: Total iterations (days) required until
- ●
- Calculation Steps for Time Calculation
Initial State Initialization:
RL iteration
The state is updated using the following formula:
If , the simulation is complete.
Final Results
It takes 7 iterations (days) to achieve a ≥ 99% completion rate.
Summary Formula for time calculation
where
- k: Number of iterations until .
- is updated every iteration based on the action selected by the PPO model.
- ●
- Budget Formula
Total Initial Cost Formula
RL Additional Cost Formula
Final Total Cost Formula
- ●
- Calculation for Each User
Based on data from the report_users.csv file, calculations are made for each user. Here are the details of the data:
- days_simulated = 7 (from RL simulation)
- Column Values: .
- Calculation of Each User:
- Employee A
- 2.
- Employee B
- 3.
- Employee C
- 4.
- Employee D
- 5.
- Employee E
- 6.
- Employee F
- 7.
- Employee G
3.3. Project Conclusion
The conclusion of the results of this project with a total cost of Rp. 338,929,500 with an estimated workmanship of 7 days and 7 employees involved where the initial budget was Rp. 150,000,000, -, so there is an excess cost of Rp. 188,929,500.
3.4. System Implementation
In the Implementation of YOLO technology and Reinforcement Learning for web-based project monitoring, a web-based system has been successfully developed. The following are the results of the implementation:
3.4.1. Database Design
At the system implementation stage, a database design is needed for the data modeling process that can represent business or application needs in the form of an organized data structure. The following is the database design in the monitoring system, as shown in Figure 2.
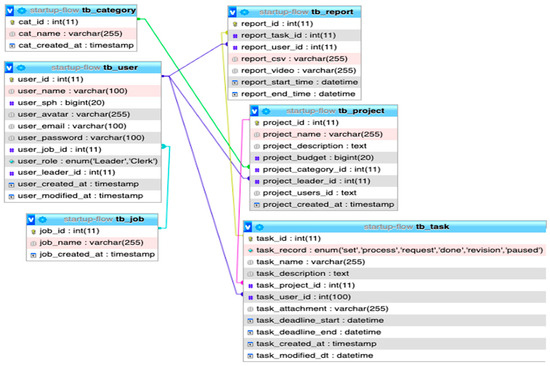
Figure 2.
Database Schema.
3.4.2. Menu Display
Furthermore, this stage will display the results of making the system, namely the menu display. A well-designed menu display will improve user experience (UX) and make the application or system easier to use. The following are some of the menu views created, as shown in Figure 3:
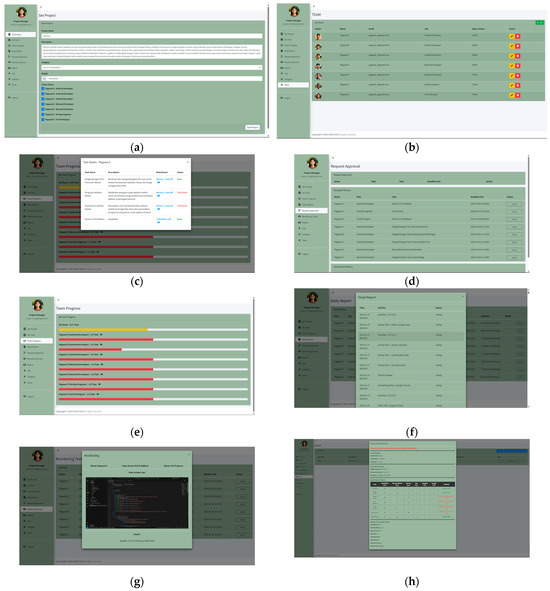
Figure 3.
(a) Project identity display; (b) Project team view; (c) Project task view; (d) Project approval; (e) Project progress; (f) Project daily report; (g) Project team monitoring; (h) Project conclusion.
4. Conclusions
This research shows that the YOLO and Reinforcement Learning methods are effective for improving project monitoring and budget optimization. With this approach, the project can be completed in a shorter time with more accurate cost estimation. Cost calculations based on team members’ working hours, additional costs due to delays, and cost calculations using RL simulation resulted in a total project cost of Rp 338,929,500 with a total over budget of Rp 188,929,500, which consumed a total of seven project days by achieving a completion rate of ≥99%. With the application of RL-based optimization, additional costs can be minimized and project efficiency increased with the reported reduction in resources of the four-person team with poor performance.
Author Contributions
Conceptualization, A.F.; methodology, A.F.; software, M.F.N.R., A.R. and M.R.A.; validation, Z.A.; formal analysis, A.F.; investigation, M.F.N.R., A.R. and M.R.A.; resources, A.F. and A.D.L.; data curation, M.F.N.R., A.R. and M.R.A.; writing—original draft preparation, A.F. and L.S.P.; writing—review and editing, L.S.P. and A.D.L.; visualization, M.F.N.R., A.R. and M.R.A.; supervision, A.F. and Z.A.; project administration, A.F.; funding acquisition, A.F. All authors have read and agreed to the published version of the manuscript.
Funding
This research received no external funding.
Institutional Review Board Statement
Not applicable.
Informed Consent Statement
Not applicable.
Data Availability Statement
The data supporting the findings of this study are available within the system developed and can be obtained from the corresponding author upon reasonable request.
Conflicts of Interest
The authors declare no conflict of interest.
References
- Kim, H.; Park, M.; Lee, H. Adopting AI in construction management: Opportunities and challenges. J. Constr. Eng. Manag. 2019, 145, 04019038. [Google Scholar]
- Chen, X.; Wang, Y.; Liu, Z. AI-based real-time surveillance system using YOLO and reinforcement learning. J. Intell. Syst. 2021, 30, 451–470. [Google Scholar]
- Zhang, L.; Zhou, J.; Huang, Q. Web-based construction monitoring system using AI technologies. Autom. Constr. 2020, 113, 103145. [Google Scholar]
- Lock, D. Project Management, 11th ed.; Gower Publishing: Farnham, UK, 2020. [Google Scholar]
- Kumar, R.; Patel, D. Web-based project monitoring in the digital age: A comprehensive framework. Int. J. Proj. Manag. Digit. 2023, 41, 112–126. [Google Scholar]
- Lee, J.; Wang, Y. Digital project monitoring: A web-based framework for construction projects. Autom. Constr. 2020, 119, 103348. [Google Scholar]
- Yang, F. An improved YOLO v3 algorithm for remote sensing image target detection. J. Phys. Conf. Ser. 2021, 2132, 012028. [Google Scholar] [CrossRef]
- Redmon, J.; Farhadi, A. YOLOv4: Optimal speed and accuracy of object detection. arXiv 2020, arXiv:2004.10934. [Google Scholar] [CrossRef]
- Lin, Y.; Liu, Y.; Lin, F.; Zou, L.; Wu, P.; Zeng, W.; Miao, C. A survey on reinforcement learning for recommender systems. arXiv 2021, arXiv:2109.10665. [Google Scholar] [CrossRef] [PubMed]
- GeeksforGeeks. Waterfall Model—Software Engineering; GeeksforGeeks: Noida, India, 2025. [Google Scholar]
- Sujarweni, V.W. Analisis Laporan Keuangan; Pustaka Baru Press: Yogyakarta, Indonesia, 2017. [Google Scholar]
- Gunawan, V.A.; Sahay, A.S.; Sahay, N.S. Estimasi biaya dan waktu dalam project plan pembuatan website dengan pendekatan information technology (IT) project management. J. Tek. Inf. 2018, 4, 11–19. [Google Scholar]
- Rahmawati, D.; Putra, H. Evaluasi kinerja tim pada proyek konstruksi menggunakan metode Balanced Scorecard. J. Tek. Sipil 2019, 15, 123–130. [Google Scholar]


Disclaimer/Publisher’s Note: The statements, opinions and data contained in all publications are solely those of the individual author(s) and contributor(s) and not of MDPI and/or the editor(s). MDPI and/or the editor(s) disclaim responsibility for any injury to people or property resulting from any ideas, methods, instructions or products referred to in the content. |
© 2025 by the authors. Licensee MDPI, Basel, Switzerland. This article is an open access article distributed under the terms and conditions of the Creative Commons Attribution (CC BY) license (https://creativecommons.org/licenses/by/4.0/).