Abstract
This study explores the impact of driving behaviors, specifically cautious and aggressive, on the performance of human-driven vehicles (HDVs) and autonomous vehicles (AVs) in traffic flow dynamics. It focuses on various metrics, including level of service (LOS), average speed, traffic volume, queue delays, carbon emissions, and fuel consumption, to assess their effects on overall performance. The findings reveal significant differences between cautious and aggressive AVs, particularly at varying market penetration rates (MPRs). Aggressive autonomous vehicles demonstrate greater traffic efficiency compared to their cautious counterparts. They achieve higher levels of service, improving from poor performance at low MPRs to significantly better performance at higher MPRs and in fully autonomous scenarios. In contrast, cautious AVs often experience poor service ratings at low MPRs, with an improvement in performance only at higher MPRs. Regarding environmental performance, aggressive AVs outperform cautious ones in terms of reduced emissions and fuel consumption. The emissions produced by aggressive AVs are significantly lower than those from cautious AVs, and they further decrease as the MPRs increases. Additionally, aggressive AVs show a considerable reduction in fuel usage compared to cautious AVs. While cautious AVs improve slightly at higher MPRs, they continue to generate higher emissions and consume more fuel than their aggressive counterparts. In conclusion, aggressive AVs offer better traffic efficiency and environmental performance than both cautious AVs. Their ability to improve road efficiency and reduce congestion positions them as a valuable asset for sustainable transportation. Strategically incorporating aggressive AVs into transportation systems could lead to significant advancements in traffic management and environmental sustainability.
1. Introduction
Human-driven cars add unpredictability, which may affect autonomous vehicle traffic networks. For future urban planning and infrastructure development, understanding how autonomous cars affect traffic dynamics, especially human-operated vehicles, is crucial [1,2,3,4] Research has shown several outcomes throughout this transitional phase [5,6,7]. As autonomous cars become more common, their predictive driving and sensor-driven navigation systems will improve traffic flow [8,9]. Simulations show that autonomous cars might minimize traffic congestion and conflicts by improving lane-keeping and deceleration management [10,11]. However, low penetration rates cause many issues because traditional vehicles lack the predictability of autonomous vehicles, undermining the benefits of automated vehicles in a fully automated setting [12,13,14].
In 2017, the European Union launched the CoEXist effort to prepare cities for the coexistence of autonomous cars (AVs) and human-driven vehicles (HDVs) on the roads [15]. The effort aims to gather data on driver behavior and the impact of autonomous vehicles on mixed traffic scenarios. Based on the insights from the CoEXist research, VISSIM version 2022 provided three driving logics for autonomous cars to replicate their behavior in a simulated environment. There exist three categories of driving behaviors: cautious, normal, and aggressive. Each one delineates a distinct sort of conduct in both the longitudinal and lateral dimensions.
This research simulates many scenarios to examine the market penetration of autonomous cars, highlighting traffic flow and demand in relation to human-operated vehicles. This study used VISSIM version 2022, an intricate microscopic traffic simulation software, to examine the impact of aggressive and cautious behaviors of self-driving cars on traffic flow on Jakarta Harbour Tollroad. This study evaluates traffic volume, efficiency, and accident reduction in mixed traffic conditions. The model of autonomous vehicles is based on the CoExist Project, which is given by VISSIM version 2022. On the other hand, the model of human-driven vehicles is based on the actual traffic circumstances that occur on the Jakarta Harbor Toll road.
2. Literature Review
Multiple studies have forecasted the market penetration rates (MPR) of autonomous vehicles (AVs). By 2045, studies project that the MPR of driverless cars would range from 24 to 87 percent. Despite the correlation between the intrinsic advantages of autonomous cars and complete market saturation, achieving a market penetration of 100 percent remains a significant challenge [15,16,17]. Throughout the transitional phase, autonomous vehicles (AVs) will engage with human-driven vehicles (HDVs). Researchers anticipate that the intricate environment generated by these vehicles, with differing levels of autonomy, would affect driving behaviors within traffic dynamics. This study examines traffic dynamics, human driver behavior, and the integration of autonomous cars based on the CoExist Project, utilizing cautious and aggressive behaviors to understand the challenges and consequences of integrating autonomous and human-driven vehicles. We will examine human driving behaviors to guarantee safe and efficient vehicle operation on highways. We adjust the forceful driving behaviors of both autonomous and human-operated cars to correspond with their surroundings. Thereafter, we utilize VISSIM version 2022 to assess the mobility, safety, and adoption rate of these vehicles.
3. Methodology
3.1. Research Area
This study examines the Harbour Tollroad in Jakarta, Indonesia. Pedicabs and motorcyclists are barred from accessing the toll road, with only autonomous vehicles, cars, Heavy Goods Vehicle (HGV) and buses authorised for entry. A single on-ramp and a single off-ramp connect each road. Figure 1 visually illustrates the location of the research study.
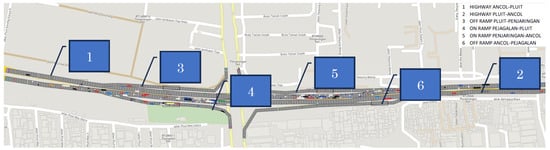
Figure 1.
The research area relevant to this study.
3.2. Research Design Model Development
This research allows modifications based on the traffic conditions we assess. This traffic composition study primarily examines autonomous vehicles (AVs) and human-operated vehicles (HOVs). Utilizing parameter values from the CoEXist study, the AV aggressive and cautious behavior classifications align with the fundamental principles of VISSIM version 2022. One may choose from several situations and market penetration rates (MPRs). The scholarly literature utilizes a similar concept by using maximum road capacity to accurately represent probable peak traffic scenarios. The scenario approach juxtaposes a dynamic examination of human-operated cars with analyses of both aggressive and cautious autonomous vehicles. Each scenario will conduct three essential simulations, specifically as follows:
- A baseline is established by this scenario, which simulates typical traffic in the absence of autonomous vehicles. This scenario is referred to as human-driven vehicle traffic.
- Market penetration rates (MPRs) for autonomous vehicles can range anywhere from 10% to 90% in increments of 10%, depending on the level of competition in the environment. Mixed traffic environments are characterized by this.
- Fully Autonomous Traffic: Autonomous vehicles constitute one hundred percent of the traffic, exemplifying a potential future scenario in which they predominate road usage.
The simulations generate various outputs regarding performance and traffic flow efficiency. We use these outputs to analyze the procedure’s results. Figure 2 illustrates the three fundamental stages previously mentioned, together with the processes associated with each level.
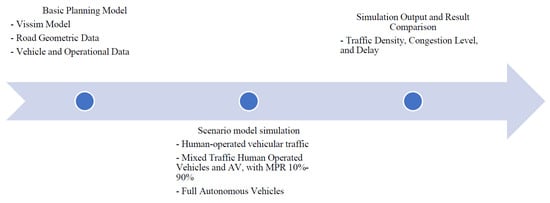
Figure 2.
Three phases of analyzing dynamic mixed traffic comprising human-driven vehicles with aggressive and cautious autonomous vehicles.
We identified the key input factors that significantly affect vehicle performance, including their minimum and maximum values. Table 1 presents the findings. We established the range values of the input variables using the minimum and maximum values derived from prior studies.

Table 1.
Parameters for human driven vehicle behavior.
4. Result and Discussion
4.1. Comparison of Dynamic Traffic Flow Between Human-Driven Vehicles and Autonomous Vehicles
A comprehensive comparison assesses the dynamic traffic flow characteristics of human-driven vehicles (FHDVs) and autonomous vehicles (AVs) under both cautious and aggressive behaviors. The metrics evaluated encompass level of service (LOS), mean speed, mean queue delay, mean queue length, mean emissions, and mean fuel consumption.
4.2. Level of Service (LOS)
Level of service (LOS) serves as a critical metric for assessing traffic flow efficiency, quantifying the extent of congestion on roadways. Aggressive autonomous vehicles (AVs) markedly improve the level of service (LOS) performance in comparison to cautious AVs and human-driven vehicles (FHDVs). At lower market penetration rates (MPRs), aggressive autonomous vehicles exhibit level of service E or 5, which indicates moderate to heavy congestion. As the MPRs increases, aggressive AVs show significant enhancement, achieving LOS C or 3 at an MPR of 90%, indicating decreased congestion and improved traffic flow.
Cautious AVs exhibit suboptimal performance at low MPRs, frequently resulting in LOS F or 6, indicative of significant congestion. The suboptimal performance is linked to conservative driving behaviors, including larger vehicle gaps and a cautious approach to acceleration. At elevated MPR, cautious AVs demonstrate improvement, achieving LOS C or 3 at an MPR of 90%; however, their performance remains markedly inferior to that of aggressive AVs. The findings highlight the advantages of aggressive autonomous vehicles in enhancing road capacity and minimizing delays, positioning them as essential elements of effective future traffic systems. Figure 3 and Figure 4 illustrate the comparative results of LOS for cautious and aggressive AV behaviors.
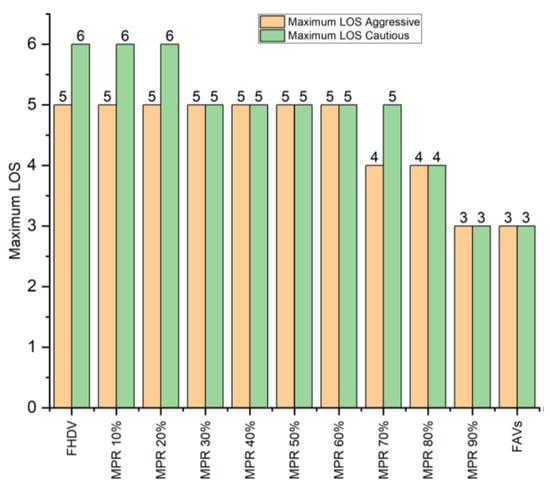
Figure 3.
Graph comparing level of service cautious and aggressive autonomous vehicles.
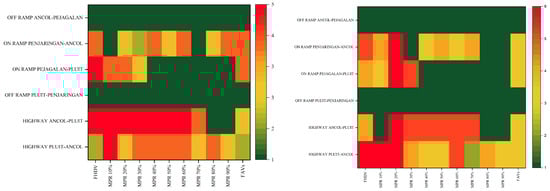
Figure 4.
Heatmaps comparing level of service for aggressive (left) and cautious (right) autonomous vehicles.
4.3. Average Speed
Average speed serves as a critical measure of the efficiency of traffic flow. Aggressive autonomous vehicles consistently demonstrate superior average speeds compared to both cautious autonomous vehicles. At an MPR of 10%, the average speed of aggressive AVs is 37 km/h, which increases consistently with rising MPRs. In scenarios involving fully autonomous vehicles (FAVs), aggressive autonomous vehicles (AVs) attain a maximum average speed of 67 km/h indicating a significant enhancement as the share of autonomous vehicles in traffic rises.
Cautious autonomous vehicles exhibit reduced speeds in comparison to aggressive autonomous vehicles. At an MPR of 20%, the average speed decreases to 32 km/h, which is slower than that of FHDVs. With an increase in the MPR, cautious autonomous vehicles demonstrate a degree of improvement, achieving speeds of 63 km/h in fully autonomous conditions. The cautious characteristics of these AVs, including slower acceleration, increased headways, and a hesitance to change lanes aggressively, constrain their speed. The reduced performance significantly impacts their overall traffic efficiency. The results show that aggressive autonomous vehicles, by staying at high speeds, improve traffic flow and shorten travel times, while cautious autonomous vehicles make traffic less efficient. Figure 5 and Figure 6 illustrate the results of comparing average speeds between cautious and aggressive AV behaviors.
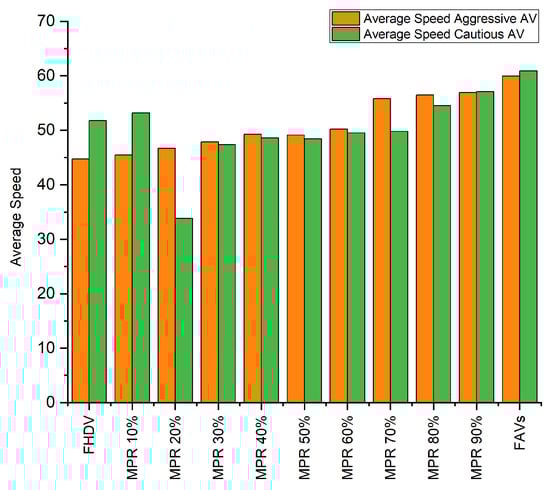
Figure 5.
Graph showing comparison of average speeds between cautious and aggressive AV.
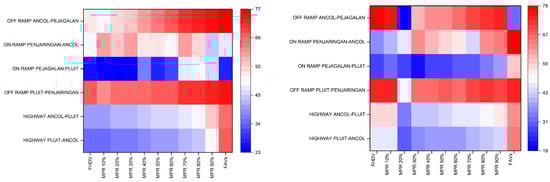
Figure 6.
Heatmap comparing average speed of aggressive (left) and cautious (right) autonomous vehicles.
4.4. Maximum Volume
Maximum volume is a crucial performance metric indicating the road’s capacity to accommodate traffic. Aggressive autonomous vehicles demonstrate superior performance in managing elevated traffic volumes relative to both cautious autonomous vehicles and fully human-driven vehicles. The maximum volume for FHDVs is 1231 vehicles per hour. Aggressive AVs exhibit a significant increase in maximum volume, achieving 6187 vehicles per hour in fully autonomous scenarios. While this is happening, cautious autonomous vehicles are experiencing an increase in MPR, but their performance is still lower than that of aggressive autonomous vehicles. At a market penetration rate of 20%, the maximum volume is 1586 vehicles per hour, which increases to 4329 vehicles per hour in fully autonomous scenarios. Cautious autonomous vehicles have increased headway and decreased movement due to cautious driving behaviours. The comparison of aggressive and cautious autonomous vehicles highlights the significance of driving behavior in optimizing traffic volume and road capacity utilization. Aggressive AVs demonstrate enhanced effectiveness in optimizing road usage, mitigating congestion, and improving overall traffic efficiency. Figure 7 and Figure 8 illustrate the comparative results of maximum- capacity traffic volumes for cautious and aggressive AV behaviors.
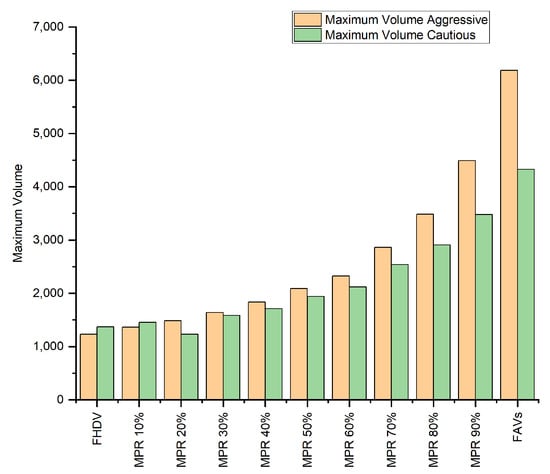
Figure 7.
Graph comparing maximum-capacity traffic volumes for cautious and aggressive behaviors.
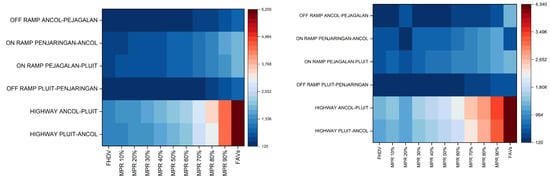
Figure 8.
Heatmaps comparing traffic volume of aggressive (left) and cautious (right) autonomous vehicles.
4.5. Queue Delay and Queue Length
Queue delay and queue length serve as critical metrics for assessing congestion. Aggressive AVs markedly decrease both metrics. At FHDV levels, the mean queue delay is 40 s, reducing to 14 s at an MPR of 90%. The queue length decreases from 26 vehicles to 19 vehicles. The enhancements are linked to the capacity of aggressive autonomous vehicles to navigate intersections effectively and mitigate bottlenecks, facilitated by their dynamic driving behaviors and quicker response times.
Cautious AVs demonstrate increased delays and extended queues, especially at lower MPR. At a market penetration rate of 20%, the average queue delay reaches a maximum of 78 s, while queue lengths attain 60 vehicles. Cautious autonomous vehicles demonstrate enhanced performance with rising MPR; however, they remain inferior to aggressive autonomous vehicles. At a maximum permissible rate of 90%, the average delay decreases to 24 s, and the queue length diminishes to 38 vehicles. The cautious behavior of autonomous vehicles, marked by yielding, increased spacing between vehicles, and conservative acceleration, results in elevated delays. This underscores the necessity of implementing more assertive AV strategies to mitigate congestion and enhance traffic flow. Figure 9, Figure 10 and Figure 11 illustrate the comparative results of queue length and delay for cautious and aggressive AV behaviors.
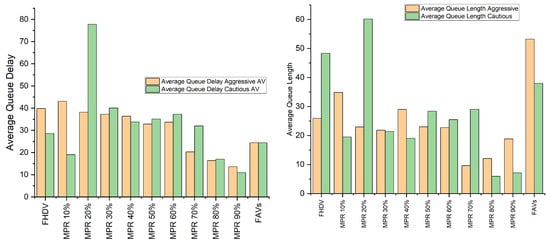
Figure 9.
Graphs comparing queue delay and queue length for cautious and aggressive autonomous vehicles.
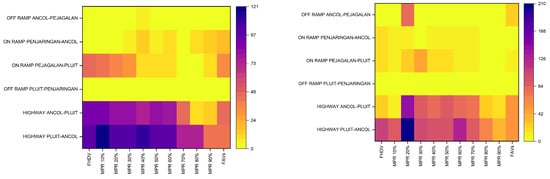
Figure 10.
Heatmaps comparing queue delay for aggressive (left) and cautious (right) autonomous vehicles.
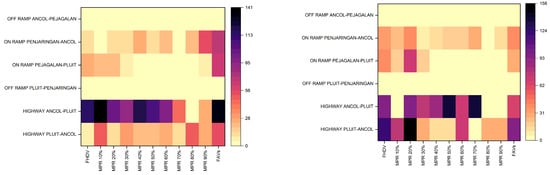
Figure 11.
Heatmaps comparing queue length for aggressive (left) and cautious (right) autonomous vehicles.
4.6. Carbon Emissions
Emissions serve as a vital environmental indicator that signifies the sustainability of transportation systems. Aggressive autonomous vehicles demonstrate substantial enhancements in emission reduction. Emissions for FHDVs begin at 4286 g CO2 and decrease to 1800 g CO2 at an MPR of 90%. The reduction is mainly attributed to improved traffic flow, decreased idling times, and increased average speeds, which are indicative of aggressive driving behaviors. The dynamic approach of aggressive autonomous vehicles contributes to reduced fuel consumption and enhanced environmental efficiency. Cautious autonomous vehicles exhibit increased emissions at reduced market penetration rates. At a marginal abatement cost of 20%, emissions reach a maximum of 6809 g of CO2. As the MPR increases, emissions decline, ultimately reaching 2613 g CO2 at an MPR of 90%. As the proportion of autonomous vehicles increases, emissions tend to improve; however, cautious autonomous vehicles still result in higher emissions than their aggressive counterparts. The comparison indicates that aggressive AVs exhibit a distinct advantage regarding environmental sustainability, leading to diminished carbon footprints and enhanced fuel efficiency. Figure 12 and Figure 13 illustrate the comparative results of carbon emissions for cautious and aggressive AV behaviors.
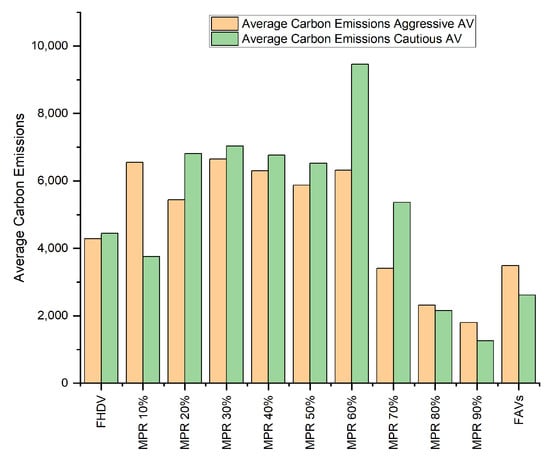
Figure 12.
Graph comparing carbon emissions of cautious and aggressive autonomous vehicles.
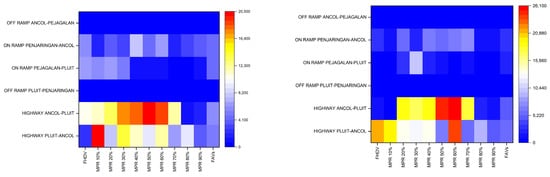
Figure 13.
Heatmaps comparing carbon emissions of aggressive (left) and cautious (right) autonomous vehicles.
4.7. Fuel Consumption
Fuel consumption, strongly linked to emissions, demonstrates a notable reduction in aggressive autonomous vehicles. As depicted in Figure 14 and Figure 15, under the full human-driven vehicles (FHDVs) condition, the fuel consumption of cautious autonomous vehicles is approximately 64 liquid gallons, which is only slightly higher than that of aggressive autonomous vehicles at 61 liquid gallons. However, upon achieving a market penetration rate of fully autonomous vehicles, aggressive autonomous vehicles exhibit a lower consumption rate of 38 liquid gallons compared to cautious autonomous vehicles. This reduction is attributable to a more gradual acceleration pattern, lower idling duration, and enhanced traffic flow efficiency. The assertive driving style of aggressive autonomous vehicles enhances fuel economy, thereby minimizing fuel waste. The elevated fuel consumption of cautious autonomous vehicles is due to frequent stops, reduced acceleration rates, and suboptimal lane management. The comparison highlights that aggressive AVs exhibit greater fuel efficiency, especially at elevated MPR, thereby serving as a crucial element of sustainable transportation systems. Figure 14 and Figure 15 illustrate the comparative fuel consumption results for cautious and aggressive AV behaviors.
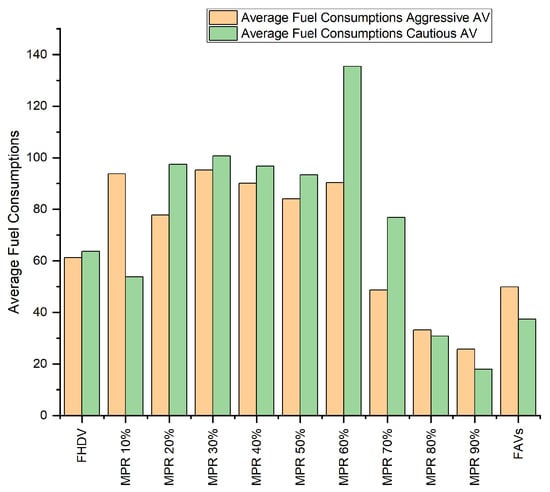
Figure 14.
Graph comparing fuel consumption of cautious and aggressive autonomous vehicles.
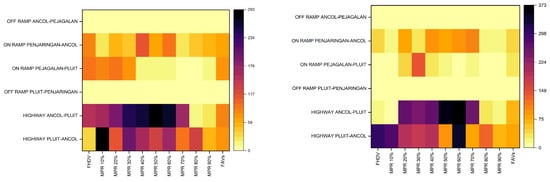
Figure 15.
Graph comparing the fuel consumption of aggressive (left) and cautious (right) autonomous vehicles.
5. Conclusions
This study highlights the transformative potential of autonomous vehicles (AVs) in optimizing traffic flow and reducing environmental impacts. Aggressive AVs consistently outperform cautious AVs across key metrics such as level of service (LOS), average speed, traffic volume, queue delays, emissions, and fuel consumption. Their ability to maintain smaller headways and manage traffic dynamically results in reduced congestion and improved roadway efficiency, particularly at higher market penetration rates (MPRs). Cautious AVs, while improving traffic safety, exhibit limitations in efficiency at lower MPR due to conservative driving behaviors. These vehicles struggle with higher queue delays, longer queue lengths, and increased emissions, especially in mixed traffic conditions. However, their performance improves significantly as the MPR increases, demonstrating their optional behaviour to implementation of autonomous vehicles. This comparative analysis highlights that aggressive driving behaviors surpass cautious ones in achieving optimal traffic flow.
In conclusion, the adoption of aggressive AVs offers significant advantages in improving traffic systems and reducing environmental impacts. However, the transition to fully autonomous systems requires strategic planning, particularly in mixed traffic scenarios with varying MPR. Policymakers, engineers, and urban planners must collaborate to ensure the successful integration of AVs into existing traffic systems, leveraging their strengths to create sustainable, efficient, and safe transportation networks.
Author Contributions
Conceptualization, M.A.; methodology, M.A.; software, M.A.; validation, D.Y.; formal analysis, M.A. and D.Y.; data curation, M.A. and D.Y.; visualization, M.A.; supervision, D.Y. All authors have read and agreed to the published version of the manuscript.
Funding
The research process was conducted by authors funded by the Indonesian Endowment Fund for Education Agency (LPDP) and University of Science & Technology (UST), KICT School.
Institutional Review Board Statement
Not Applicable.
Informed Consent Statement
Not Applicable.
Data Availability Statement
All or some data will be provided upon reasonable request to corresponding author.
Conflicts of Interest
The authors declare no conflicts of interest.
References
- Wu, C.; Bayen, A.M.; Mehta, A. Stabilizing traffic with autonomous vehicles. In Proceedings of the 2018 IEEE International Conference on Robotics and Automation (ICRA), Brisbane, Australia, 21–25 May 2018; pp. 6012–6018. [Google Scholar]
- Azam, M.; Hassan, S.A.; Che Puan, O. Autonomous vehicles in mixed traffic conditions—A bibliometric analysis. Sustainability 2022, 14, 10743. [Google Scholar] [CrossRef]
- Liu, Y.; Guo, J.; Taplin, J.; Wang, Y. Characteristic analysis of mixed traffic flow of regular and autonomous vehicles using cellular automata. J. Adv. Transp. 2017, 1, 8142074. [Google Scholar] [CrossRef]
- Miqdady, T.; de Oña, R.; de Oña, J. Traffic Safety Sensitivity Analysis of Parameters Used for Connected and Autonomous Vehicle Calibration. Sustainability 2023, 15, 9990. [Google Scholar] [CrossRef]
- Hu, X.; Huang, M.; Guo, J. Feature Analysis on Mixed Traffic Flow of Manually Driven and Autonomous Vehicles Based on Cellular Automata. Math. Probl. Eng. 2020, 1, 7210547. [Google Scholar] [CrossRef]
- Ko, W.; Park, S.; So, J.; Yun, I. Analysis of Effects of Autonomous Vehicle Market Share Changes on Expressway Traffic Flow Using IDM. J. Korea Inst. Intell. Transp. Syst. 2021, 20, 13–27. [Google Scholar] [CrossRef]
- Morando, M.M.; Truong, L.T.; Vu, H.L. Investigating safety impacts of autonomous vehicles using traffic micro-simulation. In Proceedings of the Australasian Transport Research Forum 2017 Proceedings, Auckland, New Zealand, 27–29 November 2017; pp. 1–6. [Google Scholar]
- Cheng, Y.; Liu, Z.; Gao, L.; Zhao, Y.; Gao, T. Traffic Risk Environment Impact Analysis and Complexity Assessment of Autonomous Vehicles Based on the Potential Field Method. Int. J. Environ. Res. Public Health 2022, 19, 10337. [Google Scholar] [CrossRef] [PubMed]
- Park, S.; Kim, J.; Lee, S.; Hwang, K. Experimental Analysis on control constraints for connected vehicles using Vissim. Transp. Res. Procedia 2017, 21, 269–280. [Google Scholar] [CrossRef]
- Aria, E.; Olstam, J.; Schwietering, C. Investigation of Automated Vehicle Effects on Driver’s Behavior and Traffic Performance. Transp. Res. Procedia 2016, 15, 761–770. [Google Scholar] [CrossRef]
- Petrović, Đ.; Mijailović, R.; Pešić, D. Traffic Accidents with Autonomous Vehicles: Type of Collisions, Manoeuvres and Errors of Conventional Vehicles’ Drivers. Transp. Res. Procedia 2020, 45, 161–168. [Google Scholar] [CrossRef]
- Abdel-Aty, M.; Ding, S. A matched case-control analysis of autonomous vs human-driven vehicle accidents. Nat. Commun. 2024, 15, 4931. [Google Scholar] [CrossRef] [PubMed]
- Talebpour, A.; Mahmassani, H.S. Influence of connected and autonomous vehicles on traffic flow stability and throughput. Transp. Res. Part C Emerg. Technol. 2016, 71, 143–163. [Google Scholar] [CrossRef]
- Zeidler, V.; Buck, H.S.; Kautzsch, L.; Vortisch, P.; Weyland, C.M. Simulation of autonomous vehicles based on Wiedemann’s car following model in PTV vissim. In Proceedings of the 98th Annual Meeting of the Transportation Research Board (TRB), Washington, DC, USA, 13–17 January 2019; pp. 13–17. [Google Scholar]
- Azam, M.; Hassan, S.A.; Puan, O.C.; Azhari, S.F.; Faiz, R.U. Performance of autonomous vehicles in mixed traffic under different demand conditions. Int. J. Automot. Mech. Eng. 2022, 19, 10050–10062. [Google Scholar] [CrossRef]
- Shin, S.; Cho, Y.; Lee, S.; Park, J. Assessing Traffic-Flow Safety at Various Levels of Autonomous-Vehicle Market Penetration. Appl. Sci. 2024, 14, 5453. [Google Scholar] [CrossRef]
- Ye, W.; Wang, C.; Chen, F.; Yan, S.; Li, L. Approaching autonomous driving with cautious optimism: Analysis of road traffic injuries involving autonomous vehicles based on field test data. Inj. Prev. 2021, 27, 42–47. [Google Scholar] [CrossRef] [PubMed]
- Park, B.; Qi, H. Microscopic simulation model calibration and validation for freeway work zone network—A case study of VISSIM. In Proceedings of the IEEE Intelligent Transportation Systems Conference, Toronto, ON, Canada, 17–20 September 2006. [Google Scholar]
- He, Y. Calibration of Car Following Model with Genetic Algorithm and Particle Swarm Optimization methods. Bachelor’s Thesis, Technical University of Munich, München, Germany, 2022. [Google Scholar]
Disclaimer/Publisher’s Note: The statements, opinions and data contained in all publications are solely those of the individual author(s) and contributor(s) and not of MDPI and/or the editor(s). MDPI and/or the editor(s) disclaim responsibility for any injury to people or property resulting from any ideas, methods, instructions or products referred to in the content. |
© 2025 by the authors. Licensee MDPI, Basel, Switzerland. This article is an open access article distributed under the terms and conditions of the Creative Commons Attribution (CC BY) license (https://creativecommons.org/licenses/by/4.0/).