Abstract
Volatile organic compounds (VOCs) emitted from human skin are promising biomarkers for non-invasive health assessment and disease diagnosis. However, efficient collection and sensitive analytical methods for skin VOCs remain challenging. We developed a method for measuring ethanol, acetaldehyde, and acetone from palmar skin using glass cup aqueous sampling followed by headspace solid-phase microextraction (HS-SPME) coupled with gas chromatography-mass spectrometry (GC-MS). Compounds were extracted using a carboxen/polydimethylsiloxane fiber by HS-SPME and separated using a DB-1 capillary column within 5 min. The HS-SPME/GC-MS method showed linearity (5–1000 ng/mL, r ≥ 0.990) with detection limits of 0.56, 1.01, and 0.15 ng/mL for ethanol, acetaldehyde, and acetone, respectively. Intra-day and inter-day precision were ≤9.3% and ≤9.7%, with accuracy ranged of 94–110%. Five-minute palm contact with water caused VOC release to increase linearly, and samples remained stable for 24 h at −20 °C. Following ingestion of a 500 mL alcoholic beverage (5% ethanol), ethanol and acetaldehyde emissions peaked at 95 and 24 ng/cm2/min after 1 h, while acetone gradually increased to 1.3 ng/cm2/min after 6 h. This simple, rapid method enables practical assessment of skin VOCs for health monitoring and environmental exposure evaluation.
1. Introduction
A wide variety of volatile organic compounds (VOCs) generated by various metabolic processes or entering the body through inhalation or oral intake from the environment or food are subsequently excreted from the body via breath, saliva, sweat, skin, urine, feces, vaginal secretions, and other routes [1,2,3,4,5,6,7,8,9,10]. The skin, in particular, possesses the largest surface area in the human body, and various VOCs are continuously emitted from its surface [1,4,7,10,11,12,13,14]. Recent reports have identified 822 types of skin VOCs [7], and their emission levels are expected to be useful for disease screening [3,5,9]. For example, changes in skin VOC concentrations have attracted attention due to their associations with diseases, including liver disease, diabetes, cancer, infectious diseases, menstrual disorders, and Parkinson’s disease [4,8,14,15]. However, identification and variability of skin VOC markers for specific diseases involves not only in vivo metabolism but lifestyle and environmental exposure factors. These markers may be influenced by various factors including skin type, personal hygiene, health status, stress, exercise, diet, alcohol consumption, smoking, temperature, and humidity [1,3,7,8,9]. Due to such confounding variables, the consistency of skin VOC profiles collected at different times has not been adequately evaluated. Consequently, associations between specific skin VOC profiles and target diseases, as well as their clinical utility, remain unclear [2,3,7,8,16].
Among VOCs produced in vivo, low-molecular-weight compounds such as ethanol, acetaldehyde, and acetone are easily volatilized from the skin’s surface; however, few studies have examined their relationship to disease. Ethanol in the body is mainly derived from exogenous sources such as alcohol consumption, though trace amounts are also produced through fermentation by intestinal and oral bacteria [17]. Most ethanol is metabolized to acetaldehyde in the liver, then rapidly decomposed into acetic acid. The decomposition capacity for ethanol and acetaldehyde varies among individuals due to genetic polymorphisms, and the amounts of these VOCs emitted from skin can serve as indicators of alcohol tolerance and metabolic capacity. This information can be applied to assessing the risk of alcohol-induced headaches and flushing reactions and for diagnosing liver disease in patients with alcohol metabolism disorders [17,18,19]. Acetaldehyde, a potentially carcinogenic toxic substance, is also emitted from automobile exhaust, tobacco smoke, and building materials, raising concerns about environmental exposure effects [20]. Acetone, a ketone body metabolite related to glucose and lipid metabolism, increases due to enhanced lipid breakdown in the liver during conditions such as low blood glucose, fasting, and diabetes. Acetone is produced when acetoacetic acid, generated during intracellular fatty acid breakdown, undergoes decarboxylation. Consequently, acetone is considered a potential diagnostic marker for lipid and glucose metabolism disorders [21]. In particular, acetone, the most volatile ketone body, is emitted from the skin’s surface via the bloodstream, making it a potential biomarker for ketoacidosis and diabetes [22].
Analysis of VOCs emitted from the skin is expected to serve as a simple and rapid diagnostic tool for early disease detection and follow-up, as it is non-invasive, requires no blood sampling, and little patient burden [5,8]. Skin VOC concentrations reflect metabolic activity and blood concentrations [23], allowing for repeated sample collection and monitoring over time. However, since skin VOCs are often present at extremely low concentrations, appropriate sampling and preconcentration pretreatment is necessary to concentrate target components within the detection range of analytical systems. Moreover, variations in sample collection, storage, and analytical methods, such as the materials and pretreatment conditions used to collect skin VOCs, can affect the reproducibility and interpretation of results. These factors contribute to significant differences in skin VOC measurements between laboratories [7,8,24]. It is essential to establish robust, reliable methods for collecting and concentrating skin VOCs, as well as specific and sensitive analytical methods that account for various external factors, such as environmental conditions and analytical parameters [1,7,8].
Typically, skin VOCs are collected using non-contact or contact sampling methods [1,5,7,8,9], followed by extraction and concentration using solid-phase microextraction (SPME) [5,24,25,26,27,28] or by adsorption onto solid sorbents followed by thermal desorption (TD) [4,5,29,30,31,32,33,34,35,36,37]. Subsequent identification and quantification are performed using high-sensitivity instruments such as UV-detection high-performance liquid chromatography (HPLC-UV) [38], gas chromatography with flame ionization detection (GC-FID) [4,22], gas chromatography-mass spectrometry (GC-MS) [4,8,13,14,25,26,27,28,35,36,37,39], comprehensive two-dimensional gas chromatography-time-of-flight mass spectrometry (GC × GC-TOF-MS) [32,33,37,40], or gas chromatography-ion mobility spectrometry (GC-IMS) [41]. GC-MS is the most widely used method for skin VOC analysis [4,5,7,8] because it can detect polar and nonpolar low-molecular-weight compounds with high sensitivity and specificity, and extensive commercial mass spectral libraries such as NIST and WILEY are available.
Non-contact sampling methods passively capture VOC emissions from the skin’s surface using various types of adsorbents in sampling bags [13,21] or enclosed chambers [36,40,41] containing a patient’s whole body or body part. This equilibration process may take 30 min to 4 h. Passive sampling methods using whole-body plethysmography chambers [9,41] require large-scale equipment. Skin VOCs have also been collected using polydimethylsiloxane (PDMS)-based anklets and bracelets, wearable silicone rubber bands [8,9,15,33], gas collection bags wrapped around the arm [8,24], and SPME fibers held close to the skin’s surface [8,13,25,26]. In particular, headspace (HS)-SPME is widely used as a simple extraction and concentration method for skin VOCs due to its direct solvent-free sampling capability, ease of use, and automation potential [5,28,42]. While these methods minimize sample matrix interference, they require patients be present throughout the sampling process, and long collection times limit extraction efficiency [7,8]. Other methods, such as passive flux samplers (PFS), which use a silica monolithic collector (MonoTrap® DCC18 disk, GL Sciences Inc., Tokyo, Japan) fixed 1 cm above the skin’s surface with medical tape [4,14,21,39], can reduce collection times and physical burden on patients but require predetermined VOC flux rates for effective operation, and the procedure is tedious [4].
In contrast, contact sampling methods include swab methods [9,28,43,44], which involve directly wiping the skin’s surface with absorbent swabs made of medical-grade cotton or rayon, and skin patch methods [4,5,29,30,32,34,35,37], which involve actively trapping VOCs by placing fiber pads (e.g., cotton, gauze, wool, or polyester), glass beads, hydrogel sheets, or absorbent films (e.g., Tenax TA or PDMS membranes) on the skin. These methods can be combined with solvent extraction, HS-SPME, and thermal desorption (TD) techniques. These approaches are simple, allow for self-collection, have relatively short sampling times, and can capture many volatile and semi-volatile VOCs, making them suitable for population sampling [7,8]. However, the swab method suffers from VOC contamination from environmental air and inherent non-uniformity of swab materials [8,42,44]. Similarly, skin patch methods face external contamination problems and require biocompatible materials to prevent allergies or inflammation [4]. Moreover, skin patch methods require wearing collection materials for periods ranging from several hours to several weeks, posing risks of accidental detachment, discomfort, skin irritation, and potential metabolite degradation [30]. Agarose hydrogel sheets are non-irritating and have been used in micro patch methods [29,30]. PDMS membranes are widely used as optimal materials for skin sampling patches due to their excellent biocompatibility, non-exudative nature during sampling, and outstanding thermal and chemical stability [4,30,45]. Furthermore, PDMS membranes, as liquid-phase coating devices, allow for easy metabolite diffusion and have been used for thin-film microextraction (TFME) for skin VOC sampling. Compared to conventional SPME fibers, TFME can efficiently extract and concentrate a larger number of metabolites [4]. However, in most sampling methods, attention must be paid not only to VOC contamination from the environment but to carryover of semi-volatile VOCs and loss of highly volatile compounds during sampling [13].
This study targeted ethanol, acetaldehyde, and acetone, which are highly polar, low-molecular-weight VOCs particularly challenging to handle among skin VOCs. The objective was to develop efficient sampling techniques and highly sensitive quantitative methods using HS-SPME/GC-MS. Considering the aforementioned challenges in skin VOC sampling, we focused on the high water solubility of these target VOCs and developed a glass cup aqueous sampling method that directly absorbs and traps them in water. A unique feature of this study is that the samples were collected in a sealed container for direct HS-SPME/GC-MS analysis, thereby avoiding the risk of external contamination and compound loss. In this study, we applied the developed method to the analysis of skin VOCs after alcohol ingestion and verified its effectiveness.
2. Materials and Methods
2.1. Reagents, Standard Solutions and Equipment
Ethanol (purity 99.5%), acetaldehyde (purity 99.5%), and acetone (purity 99.7%) were purchased from Nacalai Tesque (Kyoto, Japan). LC-MS-grade distilled water (Kanto Chemical, Tokyo, Japan) was used. Each compound was diluted with distilled water to prepare a 10 mg/mL solution, which were then tightly capped and stored at −20 °C. These stock solutions were diluted with distilled water to the required concentration before use to prepare standard mixtures of ethanol, acetaldehyde and acetone. Sodium chloride (purity 99.5%) was purchased from Nacalai Tesque and dried at 100 °C before use. Pyrex cylindrical glass cup (2 cm inner diameter, 4 cm height) was used for sampling of skin VOC. To eliminate external VOC contamination, glass cups and glassware used for collection of skin VOC were washed, then passed through distilled water and heated and dried at 100 °C. Paper towels were washed with methanol and thoroughly dried by heating before use.
SPME fiber assemblies were purchased from Supelco (Supelco Japan, Tokyo, Japan). Polydimethylsiloxane (PDMS, 100 μm film thickness), carboxen (CAR)/PDMS (75 μm film thickness), StableFlex™ divinylbenzene (DVB)/CAR/PDMS (50/30 μm film thickness), StableFlex™ PDMS/DVB (65 μm film thickness), polyacrylate (85 μm film thickness), and Carbowax (CW)/DVB (65 μm film thickness) were used to compare extraction efficiencies.
2.2. GC–MS Analysis
GC-MS analysis was performed using a Shimadzu QP-2010 gas chromatograph-mass spectrometer and the GC-MS Solution Ver. 2 workstation (Shimadzu, Kyoto, Japan). A fused silica capillary column (cross-linked DB-1, J&W, Folsom, CA, USA: 60 m × 0.25 mm ID, 1.0 μm film thickness) was used for GC separation under the following conditions: injector/detector temperature, 200 °C; column temperature, 80 °C held for 2 min, then ramped to 160 °C at 10 °C/min; helium carrier gas flow, 1.43 mL/min (maintained by electronic pressure controller); split ratio, 10:1. Electron impact (EI)-MS conditions were: ion source temperature, 260 °C; ionization voltage, 70 eV. Selected ion monitoring (SIM) mode detection of target analytes was performed at m/z = 31 and 45 (ethanol), m/z = 44 (acetaldehyde), and m/z = 58 (acetone). Two ions were selected for ethanol to eliminate the influence of contaminants. Each compound was quantified by peak height (or the sum of the selected ion peak heights in the case of ethanol).
2.3. HS-SPME
The optimized HS-SPME procedure is as follows: First, 2 mL of sample, 0.75 g of sodium chloride, and a PTFE-coated magnetic stir bar (2 × 7 mm) were placed in a 4 mL screw-cap vial with a PTFE septum and sealed tightly. The vial was placed on a magnetic hot stirrer attached to an SPME sampling stand (Supelco), and the sample solution was stirred at 1000 rpm for 5 min at 60 °C to equilibrate. Subsequently, the SPME unit equipped with a CAR/PDMS fiber was attached to the sampling stand, the SPME needle was inserted into the vial through the septum, and the fiber was exposed to the headspace above the sample for 20 min at 60 °C to adsorb the vaporized compounds. After extraction, the fiber was retracted into the needle, and the needle was withdrawn from the septum and inserted directly into the GC injection port of the GC-MS instrument. The fiber was then exposed and compounds were thermally desorbed according to the GC-MS temperature program to initiate analysis. The fiber remained in the GC injection port during analysis. After analysis, it was retracted into the needle, removed from the GC injection port, and used for HS-SPME of the next sample. One fiber can be reused at least 100 times.
The absolute extraction rate of each compound onto the fiber by HS-SPME under optimal conditions was calculated using the following formula:
A: Peak area count of the compound obtained by direct GC-MS analysis of 1 µL of a 1 µg/mL standard solution. B: Peak area count of the compound obtained by HS-SPME GC-MS analysis of 2 mL of a 1 µg/mL standard solution.
2.4. Method Validation Study
The linearity, limit of detection (LOD), limit of quantification (LOQ), precision, and accuracy of the developed analytical method were evaluated. Linearity for ethanol, acetaldehyde, and acetone was assessed based on the correlation coefficients of calibration curves constructed by triplicate analysis of standard mixtures over eight concentration ranges (5, 10, 20, 50, 100, 200, 500, and 1000 ng/mL). The LOD was calculated as the concentration at which the signal-to-noise ratio (S/N) was 3. The LOQ was expressed as the amount of each compound emitted per skin surface area over 5 min, based on the detection concentration at an S/N of 10 to determine the limit of quantifiable VOC emissions from the skin’s surface. For skin VOC measurements, results were expressed as the emission amount per skin surface area. Accuracy and precision validation analyses were performed using standard mixtures at low concentration (10 ng/mL), medium concentration (100 ng/mL), and high concentration (500 ng/mL). Intra-day precision, based on six independent analyses on the same day, and inter-day precision, based on six analyses over six days, were expressed as relative standard deviations (RSDs, %). Intra-day and inter-day accuracies were expressed as percentages based on deviations from the calibration curve.
2.5. Sampling and Preparation of Skin VOC
The experimental protocol was approved by Shujitsu University Ethics Committee (approval number: 126). Three healthy volunteers (21−36 years old, one male and two females) who were not using any medications or cosmetics were included in the study, informed consent was obtained from all participants. To avoid dietary influences, the subject completed meals at least 2 h before the experiment began, thoroughly washed their hands with unscented soap and tap water and refrained from eating, drinking, or urinating until the end of the experiment. Ten minutes before the experiment, the palms of their left hands were wiped with a paper towel moistened with distilled water in a clean room at 23–25 °C, then left to rest and air-dry. Skin VOCs emitted from the palm of the hand were collected using the glass cup liquid sampling method shown in Figure 1.
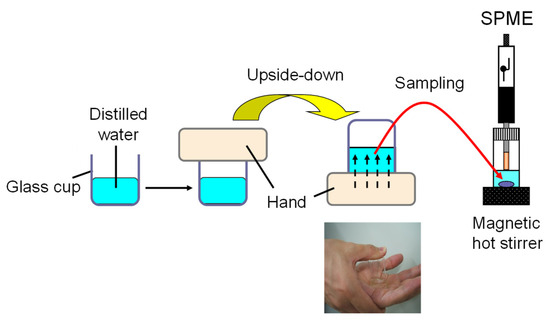
Figure 1.
Schematic diagram of the glass cup aqueous sampling method for collecting skin VOCs.
Briefly, 2 mL of distilled water was placed in a Pyrex cylindrical glass cup (3.14 cm2 inner area). The center of the left palm was placed on the cup, and the right hand was used to press the bottom of the cup against the palm, turning the cup upside down to bring the palm into contact with the water. VOCs emitted from the skin’s surface were absorbed into the water. After 5 min, the palm was returned to the top of the cup, and moisture on the palm was wiped off along the rim of the cup to recover the solution almost completely. The collected sample solution was either immediately applied to HS-SPME/GC-MS analysis after sodium chloride saturation or transferred to a screw-cap glass vial with a PTFE septum, tightly capped, and stored at −20 °C until analysis.
As a pilot study to investigate the effects of alcohol consumption, skin VOCs from the palms were collected using the above method and analyzed by HS-SPME GC-MS. The experiment began at 7:00 PM. One male volunteer consumed 500 mL of a 5% alcoholic beverage over 10 min, and skin VOC emissions were measured at various time points before and after alcohol consumption. Sampling was performed immediately before drinking at 7:00 PM, and after drinking at 8:00 PM, 9:00 PM, 11:00 PM, 1:00 AM, and 7:00 AM. Subjects did not eat or drink anything from the start to the end of the experiment, and slept from 1:00 AM to 7:00 AM.
3. Results and Discussion
3.1. GC–MS Analysis of Ethanol, Acetaldehyde and Acetone
Full-scan mass spectrometry revealed that ethanol, acetaldehyde, and acetone all exhibited strong signal ions, either molecular ions or fragment ions. For ethanol, acetaldehyde, and acetone, m/z = 31 and 45, m/z = 44, and m/z = 58 were selected, respectively, and good sensitivity was obtained in SIM mode detection. The GC column temperature program was carried out for 10 min, with the first 5 min being the MS detection time and the subsequent 5 min being the column heating time to remove higher boiling components eluting from the fiber. Using split injection with a DB-1 capillary column, no interfering peaks were detected from the water blank, and the three compounds were separated from each other and detected as distinct peaks (Figure 2). Although ethanol is more polar than acetaldehyde and acetone and has weaker retention, acetaldehyde has the lowest boiling point. Therefore, the elution order was acetaldehyde (3.38 ± 0.01 min), ethanol (3.52 ± 0.01 min), and acetone (3.66 ± 0.01 min).
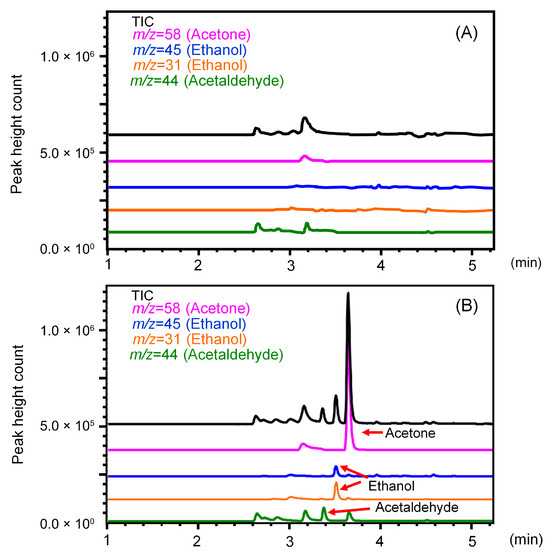
Figure 2.
Total ion and selected ion monitoring (SIM) chromatograms obtained by direct injection of (A) water and (B) standard mixture of ethanol, acetaldehyde, and acetone.
3.2. Optimization of HS-SPME and Desorption of Ethanol, Acetaldehyde and Acetone
To optimize the extraction of ethanol, acetaldehyde, and acetone by HS-SPME, parameters such as fiber coating (PDMS, CAR/PDMS, DVB/CAR/PDMS, PDMS/DVB, polyacrylate, CW/DVB), addition of sodium chloride, stirring speed (500–1500 rpm), extraction temperature (30–80 °C) and time (5–60 min), and sample pH (pH 3–8) were investigated using 2 mL of a 1 μg/mL standard mixture solution. The adsorption amounts of the three compounds onto the fiber depended on the polarity and thickness of the stationary phase coating. Among the six commercially available fibers tested, the CAR/PDMS fiber demonstrated superior extraction efficiency compared to the other fibers (Figure 3A). The analytes were hardly retained on liquid-phase-type PDMS fibers but were well retained on fibers containing carbon-based adsorbent-type CAR. Adding salt to a sample solution increases the ionic strength and decreases the solubility of the analytes, thereby increasing their vapor pressure. When a standard mixture solution saturated with sodium chloride was extracted using HS-SPME with a CAR/PDMS fiber at 60 °C for 20 min, the extraction yield of the target analytes increased 1.2-fold due to the salting-out effect. Optimization of the extraction temperature and time for ethanol, acetaldehyde, and acetone using HS-SPME with a CAR/PDMS fiber under sodium chloride saturation revealed that 60 °C and 20 min provided the most efficient extraction (Figure 3B,C). To examine the effect of sample pH, the standard mixture solution was adjusted to pH 3–8 with buffer solutions and extracted using a CAR/PDMS fiber by HS-SPME at 60 °C for 20 min. The extraction efficiency of each compound was low at low pH but nearly constant at pH 6–8 (Figure 3D).
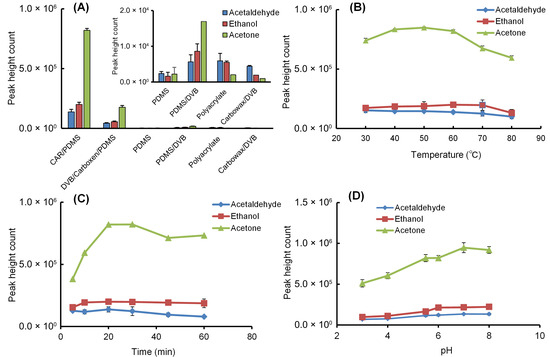
Figure 3.
Effects of (A) fiber coating type at 60 °C for 20 min, (B) extraction temperature for 20 min using CAR/PDMS fiber, (C) extraction time at 60 °C using CAR/PDMS fiber, and (D) solution pH at 60 °C for 20 min using CAR/PDMS fiber on the HS-SPME extraction efficiency of ethanol, acetaldehyde, and acetone from aqueous solution. When examining the pH of the solution, citrate-phosphate buffer (pH 3–5) or phosphate buffer (pH 6–8) was added to achieve a 50 mM concentration. Optimization conditions were evaluated by performing three replicate analyses using 2 mL of a 1 µg/mL standard mixed solution saturated with sodium chloride. Each data point is presented as the mean ± standard deviation.
Therefore, the solution was used directly without pH adjustment. Furthermore, since the stirring speed showed little effect between 500 and 1500 rpm, 1000 rpm was selected. Meanwhile, compounds adsorbed to the SPME fiber were easily desorbed by simply exposing the fiber in the GC injection port at 260 °C, and no carryover was observed. Under optimal conditions, the absolute extraction rates from 2 mL of a 1 µg/mL standard mixed solution to the CAR/DVB fiber were 0.73% (7.3 pg) for ethanol, 0.71% (7.1 pg) for acetaldehyde, and 4.30% (43.0 pg) for acetone, with acetone showing the highest extraction rate.
3.3. Detection Limits, Linearity and Precisions of Ethanol, Acetaldehyde and Acetone
Under optimal conditions, the LODs for ethanol, acetaldehyde, and acetone by HS-SPME/GC-MS with SIM mode detection were 0.56, 1.01, and 0.15 ng/mL (S/N = 3), respectively (Table 1). Compared to direct injection of 1 μL of a 1 μg/mL standard mixture solution, the detection sensitivity for ethanol, acetaldehyde, and acetone using HS-SPME method with the same concentration solution increased 13, 15, and 89 times, respectively, confirming the effectiveness of HS-SPME method. The linearity for the three analytes was validated by triplicate analyses of standard mixtures in eight concentration ranges. All analytes demonstrated linearity in the range of 5 to 1000 ng/mL, with correlation coefficients of 0.990 or higher (Table 1). Intra-day and inter-day precision (CV%, n = 6) was verified using standard mixture solutions at low (10 ng/mL), medium (100 ng/mL), and high (500 ng/mL) concentrations, with all values below 10% (Table 2). Similarly, intra-day and inter-day accuracy was verified, with all values ranging from 94 to 110% (Table 2).

Table 1.
Linearity and sensitivity of the HS-SPME/GC-MS method for ethanol, acetaldehyde and acetone.
Table 2.
Precision and accuracy of the HS-SPME/GC-MS method for ethanol, acetaldehyde and acetone.
3.4. Examination of Skin VOC Sampling Conditions
In skin VOC analysis, it is necessary to eliminate external VOC contamination from the environment and suppress VOC volatilization during sampling. In this study, considering these issues, we investigated the palm as a sampling site for skin VOCs, as it allows for easy self-collection. In the glass cup aqueous sampling method, 97% or more of the sample solution was recovered by wiping moisture adhering to the palm along the rim of the cup. To efficiently collect skin VOC samples from the palms, we investigated the collection time and storage conditions of samples after collection in subjects who had consumed alcohol. Using 2 mL of water, the collection time for ethanol, acetaldehyde, and acetone emitted from the palms of participants after drinking alcohol was examined from 0 to 10 min. Since the amount released increased almost linearly up to 5 min, the collection amount of each compound obtained after 5 min of collection was converted to the emission rate per unit skin surface area per minute. Furthermore, 2 mL of a 1 μg/mL standard mixture solution was stored in a sealed container at room temperature, 4 °C, and −20 °C for 0 to 24 h. The compounds were stable for up to 6 h at room temperature and 4 °C but remained stable for 24 h at −20 °C (Figure 4). Based on these results, it was determined that HS-SPME/GC-MS analysis should be performed immediately after 5 min of sampling, or the sample should be transferred to a screw-cap vial, tightly capped, and stored at −20 °C.
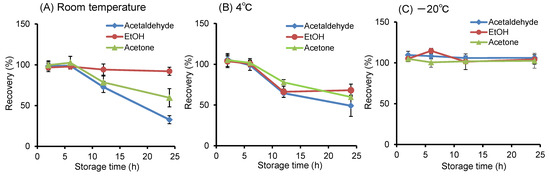
Figure 4.
Stability of ethanol, acetaldehyde, and acetone in aqueous solution stored at various temperatures. The recovery rate indicates the percentage of analyte concentration at each time point relative to the initial concentration before storage.
3.5. Application to the Skin VOC Analysis
The limits of quantification for ethanol, acetaldehyde, and acetone when applying this method to skin VOC analysis were 0.12, 0.21, and 0.03 ng/cm2/min (S/N = 10), respectively, expressed as skin surface area-specific emission rates (Table 1). When skin VOCs were measured in three healthy participants using this method, the skin’s surface area-specific emission rates for ethanol, acetaldehyde, and acetone were 2.8 ± 0.3, ND (not detected), and 0.5 ± 0.3 ng/cm2/min (n = 3), respectively. To verify the usefulness of this method, skin VOC measurements over time were performed in one male volunteer who consumed 500mL of a 5% alcohol beverage as a pilot study. Figure 5 shows the total ion and SIM chromatograms of skin VOCs obtained from a participant before and after alcohol consumption. The retention times of the three compounds were slightly different compared to the standard solution (Figure 2), but it is thought that acetaldehyde, which has a low boiling point, was eluted slightly earlier due to its weaker retention on the column caused by impurities in the sample solution. Each compound detected in the sample solution was identified from their mass spectra. The peaks for ethanol and its metabolite, acetaldehyde, are clearly elevated. Figure 6 shows the time course of VOCs emitted from the skin after alcohol consumption. The amounts of ethanol and acetaldehyde emitted from the skin reached their peaks 1 h after drinking, while the amount of acetone slightly increased 6 to 10 h later. The maximum emission amounts for ethanol, acetaldehyde, and acetone per skin area were 475, 120, and 6.5 ng/cm2, respectively. Prior to sampling, it was confirmed that ethanol, acetaldehyde, and acetone were not present due to external contamination. While alcohol consumption continuously released ethanol from the skin, acetaldehyde, which is normally barely detectable, transiently increased in emission and then almost completely disappeared after 12 h. In contrast, since acetone is involved in lipid and carbohydrate metabolism, drinking had little effect on its release.
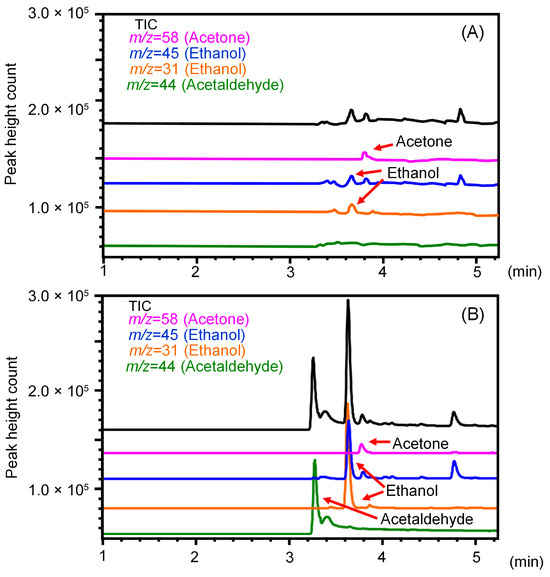
Figure 5.
Total ion and selected ion monitoring (SIM) chromatograms of ethanol, acetaldehyde, and acetone emitted from the skin (A) before and (B) after alcohol consumption.
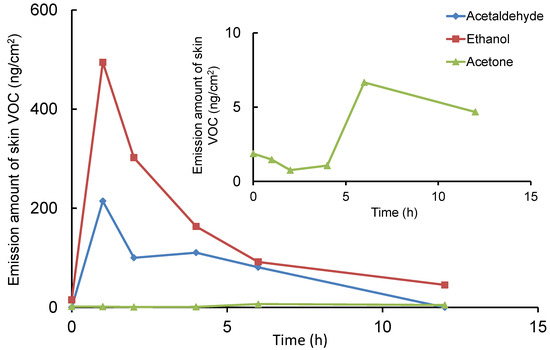
Figure 6.
Changes in the emission amounts of ethanol, acetaldehyde, and acetone from skin after alcohol consumption. Each measurement data point plots the average value from two experiments, representing the amount of each compound emitted per 5 min at each measurement time, converted per unit skin surface area.
3.6. Comparison with Previously Reported GC−MS Methods for Skin VOC Analysis
Among the various VOCs emitted from the skin, few reports have measured ethanol, acetaldehyde, and acetone simultaneously or individually. Recent reports on sampling and analytical methods for these low-molecular-weight skin VOCs are summarized in Table 3. While bag-based sampling methods [22,25] allow for relatively short sampling times, caution is required to prevent contamination from the environment and sample loss. Passive flux sampling methods [38,39] require 1 h for adsorption onto the adsorbent, with the collected amount dependent on the VOC emission rate, and necessitate specialized collection equipment. Furthermore, whole-body collection methods [40,41] require large-scale equipment and lengthy collection times. The method proposed in this study, combining glass cup aqueous sampling with HS-SPME, allows for sampling by a single person in a short time and generally exhibited good sensitivity. It also requires no special equipment, uses simple apparatus and water, is cost-effective, and offers excellent sample stability during storage. The detection levels of ethanol, acetaldehyde, and acetone emitted from the skin cannot be directly compared due to differing measurement units, but they are all generally in the nanogram range. However, toxic acetaldehyde was not detected in any of the subjects in this study. The small number of subjects is a major factor, but other factors may also be due to the subjects being non-smokers who did not normally consume alcohol, and being controlled by abstaining from food and drink before the experiment. However, since the detection sensitivity of this method is comparable to other methods, the lack of acetaldehyde detection in our data in Table 3 is limited and not absolute. Therefore, since acetaldehyde can be detected due to environmental exposures such as drinking or smoking, this method is effective in assessing their effects.
Table 3.
Analytical methods for the determination of ethanol, acetaldehyde and acetone emitted from skin.
4. Conclusions
The method developed in this study allows for the simple and rapid collection of low-molecular-weight VOCs (ethanol, acetaldehyde, and acetone) emitted from the skin using a glass cup aqueous sampling method, followed by selective and highly sensitive analysis using HS-SPME/GC-MS. This method requires simple equipment, is not labor-intensive, is inexpensive, and allows for non-invasive collection of VOCs, which can be directly subjected to HS-SPME/GC-MS analysis. Thorough cleaning and heat-drying the equipment eliminates external VOC contamination, and collection is performed in a sealed environment, suppressing external VOC contamination and volatilization of the target VOCs during sampling while allowing for stable storage. These features avoid the issues inherent in existing methods, such as VOC contamination from ambient air and skin-contact materials and loss due to on-site volatilization from adsorbents. However, it has the limitation of relatively low extraction efficiency in HS-SPME due to the high polarity of low-molecular-weight VOCs. Nevertheless, this technique offers sufficient sensitivity, precision, and accuracy for analyzing ethanol, acetaldehyde, and acetone emitted from the skin. Consequently, its application is anticipated in disease diagnosis, health management, and environmental exposure assessment of hazardous substances, with potential extension to the analysis of other water-soluble volatile and semi-volatile skin VOCs.
Author Contributions
Conceptualization, H.K.; methodology, K.S. and H.K.; software, K.S. and H.K.; validation, K.S. and H.K.; formal analysis, K.S. and Y.T.; investigation, K.S. and H.K.; resources, K.S. and H.K.; data curation, K.S. and H.K.; writing and original draft preparation, K.S. and H.K.; writing—review and editing, H.K.; visualization, K.S. and H.K.; supervision, H.K.; project administration, H.K.; funding acquisition, H.K. All authors have read and agreed to the published version of the manuscript.
Funding
This research received no external funding.
Institutional Review Board Statement
The study was conducted according to the guidelines of the Declaration of Helsinki and approved by the ethics committee of Shujitsu University (approval code 125, 31 August 2015).
Informed Consent Statement
Informed consent was obtained from all participants involved in the study.
Data Availability Statement
For privacy protection, data presented in this study are available upon reasonable request from the corresponding author.
Acknowledgments
The authors acknowledge the anonymous volunteers that agreed to participate in this study.
Conflicts of Interest
The authors declare no conflicts of interest.
References
- De Lacy Costello, B.; Amann, A.; Al-Kateb, H.; Flynn, C.; Filipiak, W.; Khalid, T.; Osborne, D.; Ratcliffe, N.M. A review of the volatiles from the healthy human body. J. Breath Res. 2014, 8, 014001. [Google Scholar] [CrossRef]
- Drabińska, N.; Flynn, C.; Ratcliffe, N.; Belluomo, I.; Myridakis, A.; Gould, O.; Fois, M.; Smart, A.; Devine, T.; Costello, B.L. A literature survey of all volatiles from healthy human breath and bodily fluids: The human volatilome. J. Breath Res. 2021, 15, 034001. [Google Scholar] [CrossRef]
- Hu, W.; Wu, W.; Jian, Y.; Haick, H.; Zhang, G.; Qian, Y.; Yuan, M.; Yao, M. Volatolomics in healthcare and its advanced detection technology. Nano Res. 2022, 15, 8185–8213. [Google Scholar] [CrossRef]
- Keerthana, S.; Saquib, M.; Poojary, H.; Illanad, G.; Valavan, D.; Selvakumar, M.; Nayak, R.; Mazumder, N.; Ghosh, C. Skin emitted volatiles analysis for noninvasive diagnosis: The current advances in sample preparation techniques for biomedical application. RSC Adv. 2024, 14, 12009–12020. [Google Scholar] [CrossRef] [PubMed]
- Kataoka, H.; Saito, K.; Kato, H.; Masuda, K. Noninvasive analysis of volatile biomarkers in human emanations for health and early disease diagnosis. Bioanalysis 2013, 5, 1443–1459. [Google Scholar] [CrossRef]
- Amann, A.; Costello, B.L.; Miekisch, W.; Schubert, J.; Buszewski, B.; Pleil, J.; Ratcliffe, N.; Risby, T. The human volatilome: Volatile organic compounds (VOCs) in exhaled breath, skin emanations, urine, feces and saliva. J. Breath Res. 2014, 8, 034001. [Google Scholar] [CrossRef]
- Mitra, A.; Choi, S.; Boshier, P.R.; Razumovskaya-Hough, A.; Belluomo, I.; Spanel, P.; Hanna, G.B. The Human Skin Volatolome: A Systematic Review of Untargeted Mass Spectrometry Analysis. Metabolites 2022, 12, 824. [Google Scholar] [CrossRef]
- Zhang, J.D.; Le, M.N.; Hill, K.J.; Cooper, A.A.; Stuetz, R.M.; Donald, W.A. Identifying robust and reliable volatile organic compounds in human sebum for biomarker discovery. Anal. Chim. Acta. 2022, 1233, 340506. [Google Scholar] [CrossRef] [PubMed]
- Palmisani, J.; Aresta, A.M.; Vergaro, V.; Mancini, G.; Mazzola, M.C.; Nisi, M.R.; Pastore, L.; Pizzillo, V.; De Vietro, N.; Boncristiani, C.; et al. Volatile Organic Compounds (VOCs) in Neurodegenerative Diseases (NDDs): Diagnostic Potential and Analytical Approaches. Molecules 2025, 30, 4028. [Google Scholar] [CrossRef] [PubMed]
- Finnegan, M.; Bolikava, V.; Walsh, N.; Morrin, A. Skin-derived volatile organic compounds trigger redox signalling pathways in human keratinocytes via gas-phase interaction. RSC Adv. 2025, 15, 32768–32777. [Google Scholar] [CrossRef]
- Adam, M.E.; Fehervari, M.; Boshier, P.R.; Chin, S.-T.; Lin, G.-P.; Romano, A.; Kumar, S.; Hanna, G.B. Mass-Spectrometry Analysis of Mixed-Breath, Isolated-Bronchial-Breath, and Gastric-Endoluminal-Air Volatile Fatty Acids in Esophagogastric Cancer. Anal. Chem. 2019, 91, 3740–3746. [Google Scholar] [CrossRef]
- Duffy, E.; Morrin, A. Endogenous and microbial volatile organic compounds in cutaneous health and disease. TrAC Trends Anal. Chem. 2018, 111, 163–172. [Google Scholar] [CrossRef]
- Mochalski, P.; King, J.; Unterkofler, K.; Hinterhuber, H.; Amann, A. Emission rates of selected volatile organic compounds from skin of healthy volunteers. J. Chromatogr. B Analyt. Technol. Biomed. Life Sci. 2014, 959, 62–70. [Google Scholar] [CrossRef] [PubMed]
- Fujii, T.; Matsuura, N.; Morita, Y.; Morimoto, K. Volatile organic compounds from human skin as biomarkers of menstruation phase and severity of premenstrual syndrome: An exploratory pilot study. Heliyon 2023, 9, e19627. [Google Scholar] [CrossRef] [PubMed]
- Makhubela, P.C.K.; Rohwer, E.R.; Naudé, Y. Detection of tuberculosis-associated compounds from human skin by GCxGC-TOFMS. J. Chromatogr. B Analyt. Technol. Biomed. Life Sci. 2023, 1231, 123937. [Google Scholar] [CrossRef]
- Shirasu, M.; Touhara, K. The scent of disease: Volatile organic compounds of the human body related to disease and disorder. J. Biochem. 2011, 150, 257–266. [Google Scholar] [CrossRef]
- Le Daré, B.; Lagente, V.; Gicquel, T. Ethanol and its metabolites: Update on toxicity, benefits, and focus on immunomodulatory effects. Drug Metab. Rev. 2019, 51, 545–561. [Google Scholar] [CrossRef] [PubMed]
- Osna, N.A.; Rasineni, K.; Ganesan, M.; Donohue, T.M., Jr.; Kharbanda, K.K. Pathogenesis of Alcohol-Associated Liver Disease. J. Clin. Exp. Hepatol. 2022, 12, 1492–1513. [Google Scholar] [CrossRef]
- Rumgay, H.; Murphy, N.; Ferrari, P.; Soerjomataram, I. Alcohol and Cancer: Epidemiology and Biological Mechanisms. Nutrients 2021, 13, 3173. [Google Scholar] [CrossRef]
- Arima, Y. The Impact of Ketone Body Metabolism on Mitochondrial Function and Cardiovascular Diseases. J. Atheroscler. Thromb. 2023, 30, 1751–1758. [Google Scholar] [CrossRef]
- Yamane, N.; Tsuda, T.; Nose, K.; Yamamoto, A.; Ishiguro, H.; Kondo, T. Relationship between skin acetone and blood β-hydroxybutyrate concentrations in diabetes. Clin. Chim. Acta 2006, 365, 325–329. [Google Scholar] [CrossRef]
- Yu, J.; Fairbairn, C.E.; Gurrieri, L.; Caumiant, E.P. Validating transdermal alcohol biosensors: A meta-analysis of associations between blood/breath-based measures and transdermal alcohol sensor output. Addiction 2022, 117, 2805–2815. [Google Scholar] [CrossRef]
- Dormont, L.; Bessière, J.M.; Cohuet, A. Human skin volatiles: A review. J. Chem. Ecol. 2013, 39, 569–578. [Google Scholar] [CrossRef]
- Grabowska-Polanowska, B.; Miarka, P.; Skowron, M.; Sułowicz, J.; Wojtyna, K.; Moskal, K.; Śliwka, I. Development of Sampling Method and Chromatographic Analysis of Volatile Organic Compounds Emitted from Human Skin. Bioanalysis 2017, 9, 1465–1475. [Google Scholar] [CrossRef] [PubMed]
- Chang, Z.; Cai, J.; Ruan, G.; Li, G. The study of fingerprint characteristics of the emanations from human arm skin using the original sampling system by SPME-GC/MS. J. Chromatogr. B 2005, 822, 244–252. [Google Scholar] [CrossRef]
- Gallagher, M.; Wysocki, C.J.; Leyden, J.J.; Spielman, A.I.; Sun, X.; Preti, G. Analyses of volatile organic compounds from human skin. Br. J. Dermatol. 2008, 159, 780–791. [Google Scholar] [CrossRef]
- Abaffy, T.; Duncan, R.; Riemer, D.D.; Tietje, O.; Elgart, G.; Milikowski, C.; DeFazio, R.A. Differential volatile signatures from skin, naevi and melanoma: A novel approach to detect a pathological process. PLoS ONE 2010, 5, e13813. [Google Scholar] [CrossRef]
- Saito, K.; Tokorodani, Y.; Sakamoto, C.; Kataoka, H. Headspace Solid-Phase Microextraction/Gas Chromatography-Mass Spectrometry for the Determination of 2-Nonenal and Its Application to Body Odor Analysis. Molecules 2021, 26, 5739. [Google Scholar] [CrossRef] [PubMed]
- Jiang, R.; Cudjoe, E.; Bojko, B.; Abaffy, T.; Pawliszyn, J. A non-invasive method for in vivo skin volatile compounds sampling. Anal. Chim. Acta 2013, 804, 111–119. [Google Scholar] [CrossRef] [PubMed]
- Dutkiewicz, E.P.; Lin, J.D.; Tseng, T.W.; Wang, Y.S.; Urban, P.L. Hydrogel Micropatches for Sampling and Profiling Skin Metabolites Click to copy article link. Anal. Chem. 2014, 86, 2337–2344. [Google Scholar] [CrossRef] [PubMed]
- Kimura, K.; Sekine, Y.; Furukawa, S.; Takahashi, M.; Oikawa, D. Measurement of 2-nonenal and diacetyl emanating from human skin surface employing passive flux sampler—GCMS system. J. Chromatogr. B 2016, 1028, 181–185. [Google Scholar] [CrossRef]
- Doležal, P.; Kyjaková, P.; Valterová, I.; Urban, Š. Qualitative analyses of less-volatile organic molecules from female skin scents by comprehensive two dimensional gas chromatography-time of flight mass spectrometry. J. Chromatogr. A 2017, 1505, 77–86. [Google Scholar] [CrossRef]
- Roodt, A.P.; Naudé, Y.; Stoltz, A.; Rohwer, E. Human skin volatiles: Passive sampling and GC × GC-ToFMS analysis as a tool to investigate the skin microbiome and interactions with anthropophilic mosquito disease vectors. J. Chromatogr. B 2018, 1097, 83–93. [Google Scholar] [CrossRef]
- Samant, P.P.; Prausnitz, M.R. Mechanisms of sampling interstitial fluid from skin using a microneedle patch. Proc. Natl. Acad. Sci. USA 2018, 115, 4583–4588. [Google Scholar] [CrossRef]
- Rankin-Turner, S.; McMeniman, C.J. A headspace collection chamber for whole body volatilomics. Analyst 2022, 147, 5210–5222. [Google Scholar] [CrossRef]
- Lucchi, G.; Crépin, M.; Chambaron, S.; Peltier, C.; Gilbert, L.; Guéré, C.; Vié, K. Effects of psychological stress on the emission of volatile organic compounds from the skin. Sci. Rep. 2024, 14, 7238. [Google Scholar] [CrossRef]
- Hervé, F.M.; Borras, E.; Gibson, P.; McCartney, M.M.; Kenyon, N.J.; Davis, C.E. A device for volatile organic compound (VOC) analysis from skin using heated dynamic headspace sampling. J. Breath Res. 2025, 19, 036004. [Google Scholar] [CrossRef]
- Sekine, Y.; Toyooka, S.; Watts, S.F. Determination of acetaldehyde and acetone emanating from human skin using a passive flux sampler—HPLC system. J. Chromatogr. B. 2007, 859, 201–207. [Google Scholar] [CrossRef] [PubMed]
- Sekine, Y.; Oikawa, D.; Todaka, M. Human skin gas profile of individuals with the people allergic to me phenomenon. Sci. Rep. 2023, 13, 9471. [Google Scholar] [CrossRef] [PubMed]
- Wang, N.; Ernle, L.; Bekö, G.; Wargocki, P.; Williams, J. Emission Rates of Volatile Organic Compounds from Humans. Environ. Sci. Technol. 2022, 56, 4838–4848. [Google Scholar] [CrossRef] [PubMed]
- Mochalski, P.; Wiesenhofer, H.; Allers, M.; Zimmermann, S.; Güntner, A.T.; Pineau, N.J.; Lederer, W.; Agapiou, A.; Mayhew, C.A.; Ruzsanyi, V. Monitoring of selected skin- and breath-borne volatile organic compounds emitted from the human body using gas chromatography ion mobility spectrometry (GC-IMS). J. Chromatogr. B Analyt. Technol. Biomed. Life Sci. 2018, 1076, 29–34. [Google Scholar] [CrossRef]
- Saito, K.; Okamura, K.; Kataoka, H. Determination of musty odorants, 2-methylisoborneol and geosmin, in environmental water by headspace solid-phase microextraction and gas chromatography-mass spectrometry. J. Chromatogr. A 2008, 1186, 434–437. [Google Scholar] [CrossRef] [PubMed]
- Trivedi, D.K.; Sinclair, E.; Xu, Y.; Sarkar, D.; Walton-Doyle, C.; Liscio, C.; Banks, P.; Milne, J.; Silverdale, M.; Kunath, T.; et al. Discovery of volatile biomarkers of Parkinson’s disease from sebum. ACS Cent. Sci. 2019, 5, 599–606. [Google Scholar] [CrossRef] [PubMed]
- Sinclair, E.; Walton-Doyle, C.; Sarkar, D.; Hollywood, K.A.; Milne, J.; Lim, S.H.; Kunath, T.; Rijs, A.M.; de Bie, R.M.A.; Silverdale, M.; et al. Validating differential volatilome profiles in Parkinson’s disease. ACS Cent. Sci. 2021, 7, 300–306. [Google Scholar] [CrossRef] [PubMed]
- Jiang, R.; Pawliszyn, J. Thin-film microextraction offers another geometry for solid-phase microextraction. TrAC Trends Anal. Chem. 2012, 39, 245–253. [Google Scholar] [CrossRef]
Disclaimer/Publisher’s Note: The statements, opinions and data contained in all publications are solely those of the individual author(s) and contributor(s) and not of MDPI and/or the editor(s). MDPI and/or the editor(s) disclaim responsibility for any injury to people or property resulting from any ideas, methods, instructions or products referred to in the content. |
© 2025 by the authors. Licensee MDPI, Basel, Switzerland. This article is an open access article distributed under the terms and conditions of the Creative Commons Attribution (CC BY) license (https://creativecommons.org/licenses/by/4.0/).