Abstract
Paper-based analytical devices (PADs) were developed as low-cost tools for detecting chemical and biological compounds, commonly fabricated from cellulose derived from plant biomass. Bamboo, a fast-growing and abundant plant with high cellulose content (40–50%), was investigated as a substrate source. In this study, the selection of bamboo was based on its rapid growth cycle and the abundance of parenchyma cells that facilitated nanofibrillation compared to cellulose fibers from softwood or hardwood. Cellulose fibers were extracted from black bamboo (30 and 60 mesh) using mechanical and acid hydrolysis methods. The mechanical method employed ultrasonication to obtain nanocellulose, while the acid hydrolysis method used strong acids, i.e., H2SO4. The resulting nanocellulose papers exhibited variations in contact angle, porosity, and transmittance that directly affected their permeability and fluid flow behavior. The results indicated that the mechanical method, which extracted nanocellulose from parenchyma cells, yielded more consistent thermophysical and mechanical properties suitable for paper-based biosensors. The fabricated nanocellulose papers were tested as PADs for colorimetric detection of dopamine and hydrogen peroxide. Based on the literature comparison, their sensing performance, including sensitivity, linearity, limit of detection (LOD), and limit of quantification (LOQ), was comparable to other nanocellulose-based papers, indicating the potential of bamboo-derived nanocellulose as a sustainable substrate for PADs.
Keywords:
colorimetry; nanocellulose paper; mechanical; acid hydrolysis; PAD; dopamine; hydrogen peroxide 1. Introduction
Paper-based analytical devices (PADs) have been developed as platforms for detecting specific chemical or biological compounds. PADs are typically used for various applications, including disease diagnosis, drug analysis, environmental monitoring, and food safety. The advantages of PADs include cost-effectiveness, ease of fabrication, capillary action principles, eco-friendliness, user-friendliness, and the requirement for only small sample volumes [1]. The use of paper as an analytical detection medium allows for the microporous structure of cellulose to serve as a channel where reagents react with samples to produce color, fluorescence, or electrochemical gradients. Quantification can also be performed to detect the concentration of analytes within the sample [2]. PADs create hydrophobic zones to restrict fluid flow within the channels and hydrophilic zones to facilitate fluid movement [3].
Various methods exist for creating hydrophobic and hydrophilic zones in PADs, including wax printing [4], photolithography [3], and laserjet printing [5]. The operation of PADs is based on the interaction between the analyte and the reagent, leading to observable changes in physical–chemical properties, one of which is a color change [6]. This color change can be analyzed using colorimetric methods. Typically, this method utilizes simple optical technologies, such as digital cameras, smartphone cameras, or scanners, combined with image processing software to measure color, hue, and intensity. The quantification results of the color change, represented as intensities in RGB, Grayscale, or HSV color spaces, allow for the creation of calibration curves to determine the concentration of the analyte in the sample [7]. The advantages of this colorimetric method include high accuracy, ease of implementation, rapid detection, high sensitivity, and stability, as well as the ability to obtain readings that can be viewed directly or further analyzed with the aid of simple devices [8]. In most colorimetric paper-based biosensors, biopolymer cellulose materials, such as filter paper, chromatography paper, or blotting paper substrate [9], are used. These cellulose-based papers require certain physicochemical, optical, and mechanical properties depending on the sensing techniques utilized for analytical means.
The analytical performance of PADs is closely related to the physicochemical characteristics of the substrate. Parameters such as contact angle, porosity, and optical transmittance determine how fluids migrate through microchannels and how colorimetric reactions develop on the surface. A lower contact angle reflects higher hydrophilicity, enabling efficient capillary flow and uniform distribution of reagents, whereas excessive wetting may cause uncontrolled spreading and poor color resolution [10]. Porosity and pore size influence permeability and sample absorption rates, affecting the detection limit and repeatability of the assay [11,12,13]. Likewise, optical transmittance impacts light scattering within the cellulose network, where moderate transparency enhances color contrast and measurement accuracy [12]. Optimizing these interrelated parameters is therefore critical for achieving reproducible and sensitive PAD responses [14].
To enhance its surface area, mechanical strength, and functionalization capacity, improving the sensitivity of colorimetric detection in PADs, it is common to modify the cellulose into a nanostructure, i.e., nanocellulose with crystallite size ranging from 1 to 100 nm. Nanocellulose has been recognized to show excellent mechanical properties, flexibility, transparency, and biodegradability [15]. Extraction nanocellulose can be derived from biomass, e.g., plants, certain marine animals, and microorganisms [16], and typically utilized mechanical, chemical, and biological methods. Mechanical methods include ultrasonic treatment, homogenization, grinding, or cryo-crushing, while the chemical method degrades cellulose using strong acid solutions. The biological method decomposes cellulose into nanocellulose with the assistance of enzymes or microorganisms [17]. The utilization of plant biomass as a nanocellulose source has emerged recently since it is renewable and biodegradable, making it suitable for sustainable material development. Among them, bamboo has gained increasing attention due to its abundance and eco-friendly nature.
Bamboo is a commonly used source of cellulose fibers due to its rapid growth cycle and abundant availability in tropical climate regions. Bamboo-derived nanocellulose also presents distinct advantages compared with cellulose obtained from softwood or hardwood. It possesses abundant parenchyma cells with thin walls and high cellulose accessibility, which facilitate nanofibrillation more effectively than the dense fibers in wood [18]. Its short maturation period (3–5 years) supports rapid and sustainable production cycles [19,20], while its cellulose fraction (40–50%) and relatively low lignin content improve the efficiency of extraction [21,22]. Bamboo has high porosity, tensile strength, transparency, and permeability due to many well-arranged vertical channels within the material [23]. Previous research has focused on the characterization of nanocellulose paper for PADs using two types of bamboo, i.e., black bamboo with a cellulose content of 43.27%, and Apus bamboo at 42.45% [24]. The results indicated that black bamboo paper exhibited the highest cellulose content. Furthermore, nanocellulose obtained from bamboo exhibits favorable mechanical strength, high porosity, and stable thermal behavior, making it suitable for biosensor substrates [24,25,26,27]. These unique physicochemical properties allow bamboo to be modified into low-cost materials and show considerable potential for colorimetry detection.
In this work, we further explore the tunability of nanocellulose paper derived from black bamboo. In particular, nanocellulose extraction methods were varied using mechanical and acid hydrolysis for fabricating nanocellulose paper with different meshed sizes and nanocellulose concentrations. Physicochemical, optical, thermal, and mechanical properties were probed to determine the optimal nanocellulose paper composition. Previous studies on bamboo nanocellulose mainly focused on structural applications, such as mechanical reinforcement [18] or food packaging [21]. However, none have explored its potential as a substrate for colorimetric detection. Finally, the performance of black bamboo derived nanocellulose paper will be compared to that of commercially available nanocellulose paper for colorimetric detection of chemical substances using dopamine and H2O2.
2. Materials and Methods
2.1. Fabrication of Nanocellulose Paper Using Mechanical Method
Extraction of cellulose using a mechanical method stems from the cellulose contained in bamboo parenchyma cells. Parenchyma cells were obtained from black bamboo (Gigantochloa atroviolacea). The inner part of the bamboo was cut, shredded, and sieved to obtain bamboo particles sized between 30 and 60 mesh. The fine bamboo particles were soaked in distilled water to facilitate the separation of parenchyma cells from fibers. The parenchyma cells were then immersed in a NaClO2 and citric acid (CTA) mixture (20:1, v/v) for 1 h at 75 °C aiming to remove lignin. Subsequently, the separated parenchyma cells were washed with distilled water six times to ensure that the parenchyma cells contained holocellulose fibers. Afterward, the parenchyma cells were immersed in 2 wt% KOH for 2 h at 90 °C to eliminate hemicellulose. The treated cells were again soaked into a mixture of NaClO2 and CTA for 1 h at 75 °C, followed by immersion in 5 wt% KOH for 2 h at 90 °C. The parenchyma cells were neutralized using 1 wt% HCl, for 2 h at 80 °C, and washed with distilled water. Before the paper fabrication process, the parenchyma cells were soaked in water to prevent the regeneration of hydrogen bonds amongst the cellulose suspension.
Nanocellulose paper fabrication was prepared using nanocellulose suspensions at concentrations of 2.5%, 5%, and 10% in distilled water and stirred for 10 min at 1000 rpm. The suspensions were then ultrasonicated using an ultrasonic generator for 50 min at a frequency of 40 kHz and followed by stirring for 1 h at 1000 rpm. The suspensions were poured into 60 × 15 mm polystyrene Petri dishes and dried in an oven for 16–20 h at 50 °C until all solvents were evaporated. The resulting paper was stored at room temperature (25 °C) with 60% relative humidity [21].
The mechanical route was conducted through chemical pretreatments with NaClO2 for delignification and KOH for hemicellulose removal. No strong acid was employed in this process. The term mechanical denoted that nanofibrillation was primarily driven by ultrasonic energy, whereas the chemical pretreatments were intended only for fiber purification. Six variations of nanocellulose paper were fabricated, including 30 mesh with 2.5% concentration (30/2.5%), 30 mesh with 5% concentration (30/5%), 30 mesh with 10% concentration (30/10%), 60 mesh with 2.5% concentration (60/2.5%), 60 mesh with 5% concentration (60/5%), and 60 mesh with 10% concentration (60/10%).
2.2. Fabrication of Nanocellulose Paper Using Acid Hydrolysis Method
Bamboo particles sized 30 mesh and 60 mesh were immersed in distilled water overnight. Extraction of nanocellulose was carried out by soaking the bamboo powder in a 20%, 30%, and 45% H2SO4 solution at a ratio of 1:8 (w/w) and heating at 45 °C for 2 h for optimization. Upon experimental screening (pre-fabrication), the optimized concentration of H2SO4, i.e., 45%, for acid hydrolysis was used further for subsequent processes. Subsequently, the mixture was filtered and rinsed with distilled water until neutral. The process continued to the bleaching stage, where the bamboo was treated with a solution containing 12% NaClO2 and 2.4% CH3COOH with a volume ratio of 1:10 (w/w) and heated at 80 °C for 1 h. The bleaching process was carried out twice. Afterward, the mixture was filtered and rinsed with distilled water until neutral [25]. The nanocellulose suspensions with various concentrations similar to that in the mechanical method were then stirred at 1000 rpm for 1 h. The procedure for the fabrication of nanocellulose paper was also identical to that explained in Section 2.1 [25]. Overall, the nanocellulose extraction and fabrication processes using both mechanical and acid hydrolysis methods are schematically depicted in Figure 1.
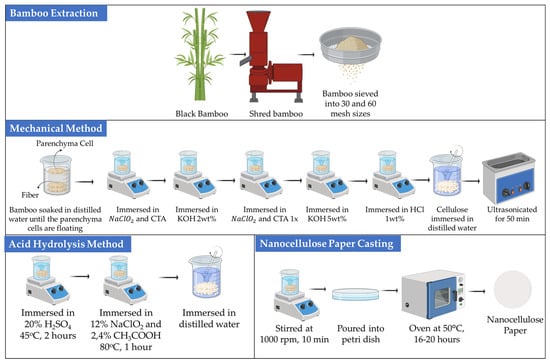
Figure 1.
Fabrication of nanocellulose paper using mechanical and acid hydrolysis methods.
2.3. Characterization of Nanocellulose Paper
X-ray diffraction (XRD) characterization was carried out using PANalytical X-pert MPD with Cu K-alpha radiation (λ = 1.0.154056 nm). The diffraction intensity specified for the cellulose field was the intensity measured at the crystalline peak 2θ = 16°, 22°, and 34° [28]. XRD was also used to calculate the size of the crystallites with the following Scherrer formulation. Fourier transform infrared spectra (FTIR) of the parenchyma cells were recorded on a Fourier transform infrared spectrometer (Nicolet iS10 Thermo Scientific, Waltham, MA, USA) at the wavenumber range of 4000–400 cm−1. Scanning Electron Microscope (SEM) FEI Inspect S50 was used to determine the microstructure and morphology of the sample. The hydrophobicity of the nanocellulose paper surface was probed using an Ossila Contact Angle Goniometer, and the contact angle was determined using an open-source image processing tool (ImageJ 1.54d) and each measurement was repeated three times (n = 3). UV–vis spectroscopy was used to determine the transmittance of nanocellulose paper according to Beer–Lambert’s law using the Thermo Scientific Genesys 10 UV–Visible Spectrophotometer. Thermogravimetric analysis (TGA) was performed with the Mettler Toledo TGA/DSC 1 instrument. The sample was heated at 40–600 °C under a N2 atmosphere with a heating rate of 10 °C/minutes, where weight loss was recorded for each increase in temperature. Mechanical properties of the paper were tested using the Sauter TVO Stepper Motor Powered Test Stand with a constant elongation rate (20 mm/min) according to ISO 1924-3:2008. The sample with a size of 1 × 5 cm was tested by applying a load to the sample and subjecting it to stress until the sample fractures. The permeability test was carried out to evaluate the fluid flow characteristics. The nanocellulose paper was fabricated with hydrophilic and hydrophobic areas using the laserjet printing method. A channel pattern 4 mm in diameter, 2 mm in width, and 40 mm in length was printed, and heated in an oven at 160 °C for 10 min. The patterned paper was attached to a glass slide (25.4 × 76.2 mm) and the permeability test was carried out by dropping 7 µL of red-colored distilled water in the hydrophilic zone and the temporal water propagation within the channel was recorded. To ensure repeatability, the measurement was conducted three times.
2.4. Design and Fabrication of PAD
The design of the PAD paper consisted of a detection zone with a diameter of 3 mm, fluid flow channels measuring 2 mm in width and 4 mm in length, and a sample zone with a diameter of 5 mm [14]. The PAD was fabricated on bamboo nanocellulose paper by laserjet printing (HP P1102) to define hydrophilic and hydrophobic zones, followed by heating at 160 °C for 10 min to form stable hydrophobic barriers. As shown in Figure 2, the device consisted of a central sample zone connected to four detection zones through hydrophilic channels, while the surrounding regions were made hydrophobic to restrict fluid spreading. The nanocellulose paper was tested for H2O2 detection and the sample test indicated a brownish color in the detection zones, indicating successful fluid transport and reaction within the defined areas.
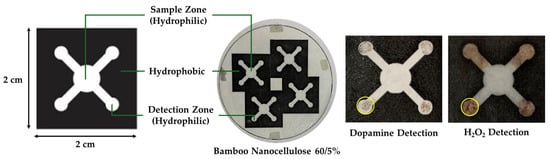
Figure 2.
Design and fabrication of PAD, and example results of utilization of bamboo nanocellulose paper as PAD substrate for dopamine and H2O2 detection. The yellow circles highlight the color change formed in the detection zones after analyte exposure.
2.5. Preparation and Colorimetric Detection of Neurotransmitter by PAD
The fabricated PAD paper was then tested by depositing 10 µL of dopamine solution (1–8 mM) onto the sample zone. Once the sample reached the detection zone, a reagent composed of 1 µL of 2,4-Dinitrophenylhydrazine (DNP) at 0.8 mM, 1 µL of Potassium Periodate (PPI) at 10 mM, and 1 µL of NaOH at 10 mM was added [29]. After a few seconds, a color change occurred due to the chemical reaction in the dopamine assay, which involves the oxidation of DNP by PPI to form a diazonium ion under acidic conditions. The acidic medium was subsequently neutralized by the addition of NaOH. Thereafter, the interaction between the diazonium ion and dopamine led to the formation of an azo compound exhibiting a yellowish-brown coloration. The results of the color change were then captured using a smartphone (Samsung Galaxy A54, Samsung Electronics, Suwon, Republic of Korea). Camera settings were optimized, specifically, f/1.8, ISO values 40, and shutter speeds 1/200s. The camera settings were kept constant throughout the experiments to eliminate variations caused by lighting or exposure. The background color was maintained uniformly with a white background to prevent unwanted color reflections. After that, the RGB measurement feature in ImageJ software was used to quantify intensity in the Grayscale color spaces. Each measurement was repeated four times (n = 4) to confirm the reproducibility of the colorimetric response, and the results were presented as mean values with standard deviations [14].
2.6. Preparation and Colorimetric Detection of H2O2 by PAD
Hydrogen peroxide (H2O2) at a concentration of 1–8 mM, glycerol, potassium iodide (KI), and soluble starch were used for the colorimetric test. Saturated 1.6 M KI solution was prepared by dissolving KI in boiling distilled water, and then 1 µL of the KI solution was deposited onto the detection zone. An amount of 10 µL of H2O2 was dissolved in glycerol and deposited onto the sample zone. Starch solution was prepared at a concentration of 1.0% (w/v) and 1 µL was deposited onto the detection zone. The detection method is based on the reaction between H2O2 and KI, resulting in the formation of iodine molecules (I2). The amount of iodine produced is subsequently detected through its interaction with starch, forming an iodine–starch complex on the paper substrate [30]. The intensity of the resulting color is proportional to the H2O2 measured as a peroxide value (PV), which serves as a key indicator of lipid oxidation and food quality [31,32].
3. Results and Discussions
3.1. Physicochemical Properties of Bamboo Nanocellulose
The X-ray diffraction (XRD) pattern indicates the crystal structure of bamboo nanocellulose extracted using both mechanical and acid hydrolysis methods. The XRD pattern for the mechanical method, as shown in Figure 3a, reveals maxima at 2θ of 16.13°, 22.30°, and 34.90°, while the acid hydrolysis method, depicted in Figure 3b, exhibits diffraction peaks at 2θ of 15.73°, 22.72°, and 35.27°. Both diffraction patterns correspond to JCPDS No. 00-050-22411, identified as the crystalline structure of cellulose type I [33]. This indicates that the differences in the extraction methods of bamboo nanocellulose do not alter its crystal structure [22]. Cellulose I has two polymorphic structures: triclinic (Iα) and monoclinic (Iβ). Cellulose Iα possesses Miller indices of (100), (010), (110), and (14), whereas cellulose Iβ has Miller indices of (10), (110), (200), and (004) [34]. In this study, the bamboo nanocellulose exhibited Miller indices of (110), (200), and (004), indicating a dominance of cellulose Iβ.
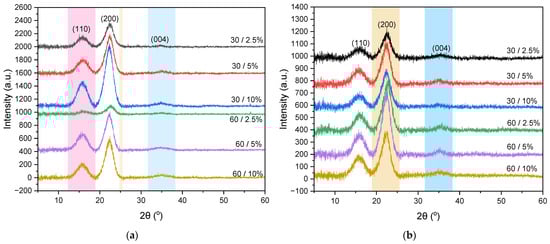
Figure 3.
XRD pattern of nanocellulose extracted using (a) mechanical method and (b) acid hydrolysis method.
The highest crystallinity index () obtained from the mechanical method is found to be 64.10% for a 30/10% ratio, whereas the acid hydrolysis method yields a crystallinity of 57.32% at a 30/5% ratio. The nanocellulose paper with a 30-mesh variation exhibits a higher compared to the 60-mesh variation, attributed to its longer fibers and larger particles, resulting in a more organized and robust crystalline structure. In contrast, the 60-mesh paper contains shorter fibers and finer particles, leading to a more amorphous structure. Furthermore, the of nanocellulose paper produced by the acid hydrolysis method is lower than that of the mechanical method. In this case, the mechanical method breaks down cellulose fibers through ultrasonic processes or physical separation, thereby preserving the original crystalline structure of cellulose and preventing significant degradation of the crystalline structure. In contrast, the acid hydrolysis method degrades cellulose fibers using strong acids, such as H2SO4, which remove the amorphous regions of cellulose while simultaneously causing partial degradation of the crystalline structure [22].
The broadening of diffraction peaks, expressed as full width at half maximum (FWHM), is analyzed to estimate the crystallite size and lattice strain of the samples. Based on previous studies [35], the corresponding hkl planes are identified for each diffraction peak. The crystallite size () and lattice strain (ε) are then determined using Equations (1) and (2).
where denotes crystallite size (nm), represents shape parameter (0.94), is X-ray wavelength (0.1542 nm), is the Bragg angle (), FWHM refers to the full width at half maximum of the diffraction peak, and is the FWHM in radians. Using the Scherrer equation for nanocrystalline structures, the crystallite size was calculated and is shown in Table S1. The crystallite sizes () of the samples ranged from 3.70 to 4.07 nm with between 40.48% and 64.10% for mechanical methods. Paper using acid hydrolysis has a crystallite size range from 3.61 to 4.42 nm with a between 42.98% to 57.32%. These crystallite sizes are comparable to a previous report that obtained a crystallite size of 4.18 nm [13], and crystallite size of 1.3–1.6 nm with a of 38.9–42.2% [36]. These results indicate that both materials can be classified as nanocellulose, as their crystal sizes are below 100 nm. In this work, values using mechanical (40.48–64.10%) and acid hydrolysis (42.98–57.32%) overlap with the bamboo literature, e.g., 56.9% [37]; 57.1–64.8% [21]; and 55.7% [38], and are lower than typical softwood (71.8%) and hardwood (69.6%) nanopapers processed via TEMPO [26]. The difference in crystallinity between nanocellulose paper prepared using mechanical methods and acid hydrolysis roots from the cellulose source, where the mechanical method extracts nanocellulose mainly from parenchyma cells which are rich in cellulose content. Meanwhile, the acid hydrolysis method proceeds with both bamboo fiber and parenchyma cells, which in turn yield relatively lower cellulose content. Nanocellulose paper prepared by the mechanical method containing higher fractions of nanocellulose exhibited increased crystallinity despite having a slightly smaller crystallite size, indicating more organized arrangement of cellulose chains [38].
FTIR characterization aims to identify the functional groups which are present in the nanocellulose structure. The FTIR spectrum graphs for nanocellulose 30/5% extracted via mechanical and acid hydrolysis methods in the wavenumber range of 500–4000 cm−1 are shown in Figure 4. The corresponding FTIR data for other samples are presented in Figure S1. All stretching of the hydroxyl (O-H) groups indicated in 3570–3200 cm−1 shows the presence of moisture. The absorption peak in the range of 2900–2880 cm−1 corresponds to C-H stretching, which results from the formation of cellulose chains. The IR bands in 1160–1048 cm−1 indicate stretching of C-O-C and C-O bonds within the cellulose chain. Additionally, the peak in the range of 1680–1620 cm−1 corresponds to the stretching of the functional group C=C [39]. The distinct IR absorption band at 1727 cm−1 indicates C=O stretching, which is observed only for the acid-hydrolyzed sample. This C=O band represents a small amount of hemicellulose that contains C=O bonds at a higher range of 1765–1715 cm−1 [40]. The peak at 1429 cm−1 indicates the occurrence of -CH2 bending [41]. The peak at a wavenumber of 1318 cm−1 indicates OH bending vibrations, which typically occur in the wavenumber range of 1300–1320 cm−1 due to the perpendicular movement of the O-H bond axis [42].
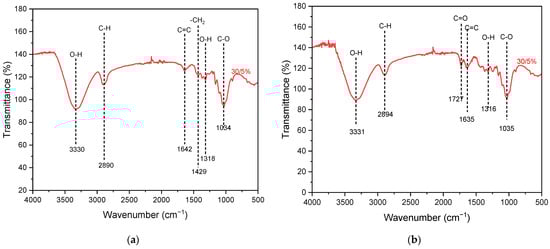
Figure 4.
Results of FTIR characterization of nanocellulose paper 30/5% using (a) mechanical and (b) acid hydrolysis methods.
To examine the surface morphology of the nanocellulose paper, SEM characterization were performed. Figure 5 illustrates the morphology of nanocellulose 30/5% extracted from the (a) mechanical and (b) hydrolysis methods. The morphology of nanocellulose extracted from the mechanical method is characterized by long, cylindrical fibers that are separated from one another. In contrast, the nanocellulose extracted by acid hydrolysis using 45% H2SO4 shows a morphology similar to that obtained from the mechanical method and does not exhibit fiber agglomeration, unlike the sample treated with 20% H2SO4, as shown in Figure S2 [43].
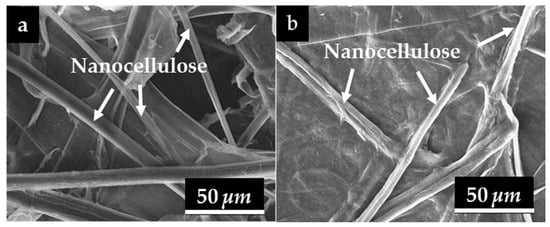
Figure 5.
Results of SEM testing on the surface structure of nanocellulose paper 30/5% using (a) mechanical method and (b) hydrolysis method of 45% H2SO4.
SEM images were further analyzed using an image processing tool (ImageJ) to obtain the porosity and pore diameters of each variation that later correlates with the permeability characteristics of nanocellulose paper. These physical parameters are summarized in Table 1. The highest pore diameter obtained from the mechanical method was 0.19 μm for the 30/2.5% variation, while the acid hydrolysis method yielded a pore diameter of 0.14 μm for the 60/2.5% variation. The lowest fiber pore diameter from the mechanical and acid hydrolysis methods were observed in the 60/10% variation. Table 1 shows that the highest porosity level from both methods is the 30/2.5% variation, while the lowest porosity level is obtained for the 60/10% variation. The 30/2.5% variation exhibits the highest porosity, as the larger mesh size and lower nanocellulose concentration led to a looser structure with more space between the fibers. Conversely, the 60/10% variation displays the lowest porosity, where the larger mesh size and higher nanocellulose concentration tend to decrease porosity due to a denser structure with less space between the fibers [22].

Table 1.
Porosity and pore diameter of the surface of nanocellulose paper using mechanical and acid hydrolysis methods.
3.2. Thermophysical and Mechanical Properties of Nanocellulose Paper
The physical properties of nanocellulose paper’s surface are important for controlling the mixing of flow within the microchannel. The contact angle (CA) indicates the degree of hydrophilicity and hydrophobicity of the nanocellulose paper, which is derived from the droplet image formed when fluid is deposited on its surface. The fabrication of hydrophobic areas on the PAD paper using laserjet printing was conducted to prevent fluid permeation outside the sample zone, detection zone, or channels, while the hydrophilic area directs the sample toward the detection zone [44]. A CA of less than 90° indicates that the surface can absorb water (hydrophilic), whereas a contact angle greater than 90° signifies that the surface is hydrophobic or does not absorb water.
Figure 6a shows that as the concentration of nanocellulose in the paper increases, the paper tends to become more hydrophilic, as this is affected by the concentration of hydroxyl (O-H) groups. A higher concentration of nanocellulose leads to an increased number of hydroxyl groups on the surface of the paper. The polar hydroxyl groups interact with polar water molecules through hydrogen bonding. An increase in hydroxyl groups results in more hydrogen bonds with water molecules, effectively attracting water molecules, thus resulting in a lower CA and a more hydrophilic paper [45]. Figure 6b illustrates that the surfaces of each variation of nanocellulose paper exhibit hydrophilic properties, as the average CA values are less than 90°. Among all variations, the most hydrophilic sample in the mechanical method and hydrolysis method is 60/10%.
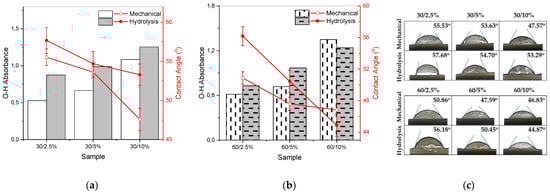
Figure 6.
Correlation between the increase in hydroxyl groups (bar chart) and the contact angle (line plot) value of nanocellulose paper (a) 30 mesh and (b) 60 mesh; error bars represent the standard deviations of repetitive experiments (n = 3); (c) mean results of contact angle testing of nanocellulose paper using mechanical method and acid hydrolysis method.
The optical properties of nanocellulose paper are reflected by the transmittance spectra in the visible range. Figure 7 shows the transmittance of paper substrate 30/5% from the mechanical method and hydrolysis method using a 45% concentration of H2SO4. Figure S3c shows the highest transmittance of ~30% for the nanocellulose paper 30/2.5% prepared using mechanical method, while the acid hydrolysis method yielded the highest transmittance of ~19% for the 60/2.5% variation. The lowest transmittance in the mechanical method is found for the 60/10% variation, while the lowest in the acid hydrolysis method is for the 30/10% variation. In general, increasing the concentration of nanocellulose lowers the transmittance of the paper. This phenomenon is due to the increased concentration of nanocellulose or the thickness of the nanocellulose paper, resulting in a longer path length for light as it passes through the sample, leading to more light scattering and absorption, thereby reducing the amount of light that can be transmitted [10].
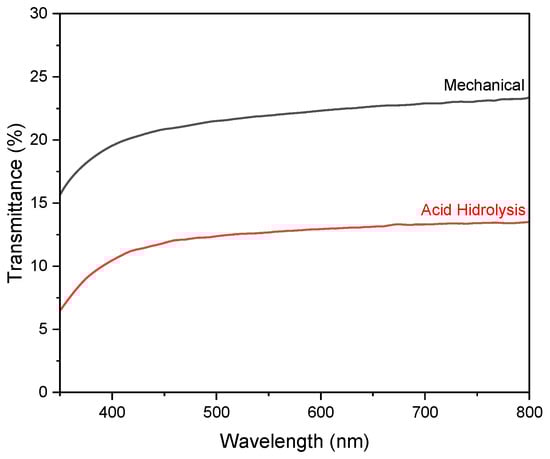
Figure 7.
UV–vis transmission spectra of nanocellulose paper 30/5% using mechanical method and acid hydrolysis method with 45% H2SO4.
The mechanical properties of nanocellulose paper 30/5% are indicated by the stress–strain curve presented in Figure 8, which characterizes the material’s deformation behavior under applied tensile strength. Figure S4a,b show that the increase in nanocellulose content enhanced both tensile strength and elongation, indicating a denser paper structure, stronger interfibrillar bonding, and improved mechanical properties. Figure S4c,d show that as the nanocellulose content increases, the porosity of the substrate decreases, exposing more hydroxyl groups on its surface, as in Figure 6a,b. The mechanical test indicates that the porosity of nanocellulose paper decreases as the nanocellulose content increases, regardless of the preparation method. This trend is attributed to the ability of nanocellulose fibrils to fill pores between fibers. These additional hydroxyl groups form more hydrogen bonds, which in turn enhance the tensile strength of the material [11,12].
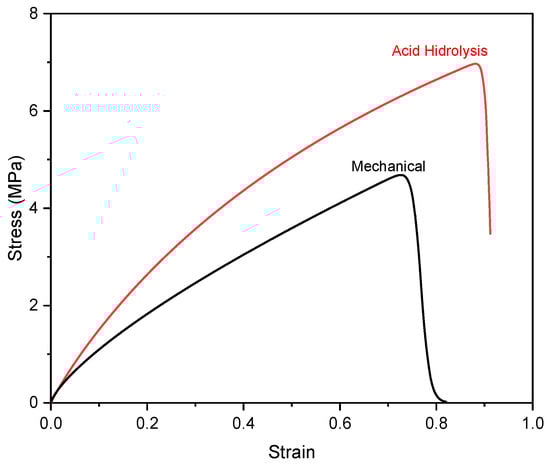
Figure 8.
Stress–strain of nanocellulose paper 30/5% using mechanical method and acid hydrolysis method with 45% H2SO4.
Table 2 summarizes the mechanical properties of the resultant nanocellulose paper at various variations. The tensile strength indicates the maximum stress allowable to be applied on materials before it breaks. The Young’s modulus indicates the ability of a material to return to its original shape after being subjected to an elastic deformation force, while the elongation (%) indicates the maximum change in length that occurs in the material when it reaches fracture. The result shows that the mechanical properties of nanocellulose paper are strongly affected by its porosity. For paper fabricated from mechanically extracted nanocellulose, a decrease in porosity from 41.54% to 8.79% leads to an increase in tensile strength from 2.5 MPa to 13.2 MPa and the elongation increases from 3.9% to 7.9%. A similar trend occurs in the acid hydrolysis nanocellulose paper, where decreasing porosity from 22.38% to 8.94% yields an increasing tensile strength from 1.9 MPa to 15.2 MPa and elongation reaches 8.3%. The Young’s modulus increases as the porosity of nanocellulose paper decreases. However, the 60-mesh nanocellulose paper prepared using the mechanical method shows an inverse trend, where decreasing porosity leads to a lower Young’s modulus. This finding suggests that, in addition to porosity, fibril conformation and distribution resulting from the extraction method play a crucial role in determining stiffness. Overall, decreasing the porosity of nanocellulose paper contributes to improved tensile strength [12] and elongation, while the effect on the modulus depends on the extraction method and fibril organization.
Table 2.
Tensile strength, Young’s modulus, and elongation of nanocellulose papers prepared using mechanical and acid hydrolysis methods. The numbers 30 and 60 indicate the mesh sizes used to sieve bamboo powder, while the percentages (2.5–10%) denote the concentration of cellulose.
The correlation among porosity, hydroxyl groups, and hydrophilicity is visualized in Figure S5 (Supplementary Information). As the nanocellulose concentration increases, the paper structure becomes denser and less porous [22]. However, the surface exposure of –OH groups and the enhanced hydrogen bonding promote stronger water affinity, resulting in lower CA and higher hydrophilicity [45]. Simultaneously, the increased concentration of nanocellulose reduces the pore size and leads to lower light transmittance [10]. This observation is in agreement with the earlier discussion on optical characteristics, where higher nanocellulose concentrations result in a longer path length for light as it passes through the sample, leading to greater light scattering and absorption, and, consequently, lower transmittance.
The TGA characterization in Figure 9 aims to analyze the thermal stability of the paper since the fabrication of PADs requires heating at 160 °C for 10 min. In this regard, the thermal stability of the nanocellulose paper is tested over a temperature range of 40 to 600 °C. The results of the TGA testing of nanocellulose paper reveal three stages of weight loss. The first stage occurs in the temperature range of 40–100 °C and is attributed to the evaporation of water due to the hydrophilic nature of the paper [46]. This is consistent with the FTIR results, which show a peak in the wavelength range of 3570–3200 cm−1, indicating the presence of water. The second stage occurs in the temperature range of 180–360 °C, involving the degradation of organic components such as hemicellulose, lignin, and cellulose. The acid hydrolysis method tends to degrade at lower temperatures compared to the mechanical method. The third stage, above 360 °C, corresponds to the degradation of carbon residue and the remaining organic material. The acid hydrolysis method produces a higher residue compared to the mechanical method [27]. Additional sample variations are provided in the Supplementary Information Figure S6.
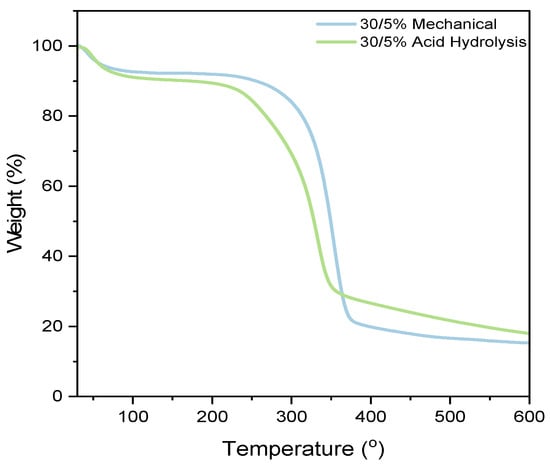
Figure 9.
Thermogravimetric analysis of nanocellulose paper 30/5% prepared using mechanical and acid hydrolysis method.
The 30/5% mechanically processed nanocellulose paper exhibits the smallest weight loss at 7.77%, while the 30/5% acid hydrolysis paper shows the highest weight loss at 9.71%. One parameter that might affect thermal stability is the crystallinity index. Table S1 indicates that as the crystallinity index of nanocellulose increases, its resistance to thermal decomposition also increases, enhancing thermal stability. This phenomenon is attributed to the orderly and dense crystalline structure, which is more resistant to bond breakage or structural changes at high temperatures. Conversely, a lower crystalline index or a predominantly amorphous structure results in a less stable crystalline framework, which can accelerate the degradation process [47].
3.3. Evaluation of Fluid Flow Performance
To determine the permeability of nanocellulose paper, water flow rate testing was conducted. Fluid flow is classified into wet-out flow and fully wetted flow. Wet-out flow occurs when fluid contacts a dry porous medium, described by the Lucas–Washburn equation:
where represents the fluid travel distance (m), denotes the time (s), refers to the average pore radius of the paper (m), represents the surface tension (mN·m−1), denotes the viscosity of the fluid (kg·m−1·s−1), and refers to the contact angle of the fluid on the paper surface () [1]. Fully wetted flow is fluid flow in a wetted porous medium, modeled by Darcy’s law:
where denotes the fluid flow rate (m3s−1, represents the permeability of the paper (m2, indicates the paper area (m2), refers to the fluid viscosity (kg·m−1·s−1), signifies the paper length (m), and denotes the surface pressure on the paper (Pa) [1]. The experimental results of fluid transport behavior are presented in Figure 10.
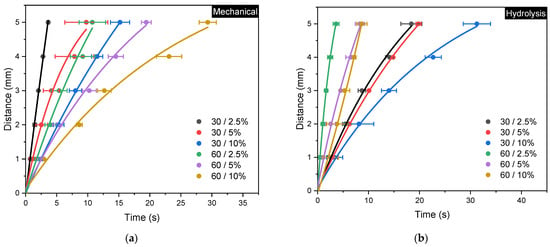
Figure 10.
Fluid flow rate curves for (a) mechanical and (b) acid hydrolysis methods; error bars represent the standard deviations of repetitive experiments (n = 3).
The experimental results show that both the mechanical method with 30/2.5% variation and the acid hydrolysis method with 60/2.5% variation require the shortest time of 3.6 s to reach the full distance. These results are consistent with their corresponding physical properties, where both show higher porosity and pore diameters compared to other variations. Complete evaluation of paper permeability according to Darcy’s Law and the Lucas–Washburn equation is summarized in Table 3 [1]. The highest permeability in the mechanical method is found to be 4.55 × 10⁻⁷ m2, whereas the acid hydrolysis method exhibits the highest permeability of 1.28 × 10⁻⁷ m2.
Table 3.
Permeability coefficient (k) of nanocellulose papers fabricated from black bamboo using mechanical and acid hydrolysis methods. The permeability values (k, in m2) represent the fluid transport capability of the paper substrates, calculated from Darcy’s law based on the flow rate.
3.4. Colorimetry Test to Detect Neurotransmitter and H2O2
Colorimetric testing was carried out to examine the performance of nanocellulose paper as a PAD substrate. The nanocellulose paper used for the colorimetric test was 30/5% for both the mechanical method and acid hydrolysis method, as both show lower porosity for reducing diffuse optical scattering, while maintaining relatively high permeability for efficient mixing between the reagent and analyte. The colorimetric test was undertaken to create calibration curve of dopamine and H2O2 measurements. For example, the colorimetric images of H2O2 sensing that were used for image processing are depicted in Figure S7 (Supplementary Information). For each concentration, measurements are collected in quadruplicate (n = 4), and the error bars show the standard deviation across replicates. Figure 11a,b illustrate the colorimetric calibration curve, where the Grayscale intensity is plot vs. dopamine and vs. H2O2 concentration, respectively. The static characteristics of the PAD for dopamine and H2O2 detection are assessed based on a linear regression model to obtain the sensitivity (slope), linearity (R2), limit of detection (LOD), and limit of quantification (LOQ). The LOD and LOQ are calculated as given in Equations (5) and (6), where is the standard deviation of the y-residuals and y-intercept from the linear regression line, and is the slope of the calibration curve. All static characteristics of colorimetric sensing are summarized in Table 4.
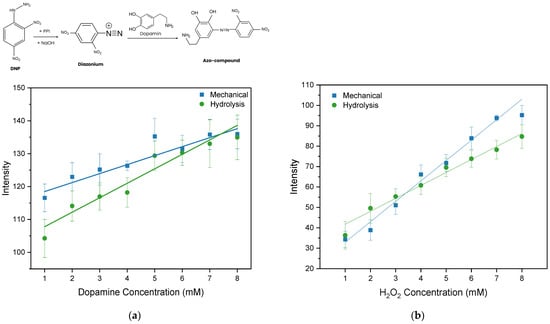
Figure 11.
Calibration curve for (a) dopamine and (b) H2O2 testing on nanocellulose PAD using the mechanical and hydrolysis paper substrates with gray intensity scales. Error bars represent the standard deviations of repetitive experiments (n = 4).
Table 4.
Data for the calibration curve of dopamine and peroxide testing on nanocellulose PAD.
The highest R2 (0.93) indicating the highest linearity is observed for colorimetric detection using the nanocellulose paper prepared from the method. Further, the PAD using acid hydrolysis nanocellulose paper indicates a low LOD and LOQ of 1.79 mM and 5.42 mM, respectively. These results are comparable with previously reported dopamine paper-based sensors using commercial filter paper, which showed an LOD ranging from 0.56 to 5.58 mM. The nanocellulose paper demonstrates performance comparable to that of commercial filter paper [14]. For H2O2 detection, the static characteristics of a PAD using mechanically prepared nanocellulose paper shows better linearity and sensitivity than that of a PAD using acid hydrolysis nanocellulose paper.
3.5. Comparison with Other Nanocellulose Paper Substrates
Table 5 highlights the comparison of the physical, optical, and thermomechanical properties of bamboo-derived nanocellulose paper with other nanocellulose paper substrates. This work demonstrates that the characteristics of nanocellulose derived from black bamboo are comparable to that of commercial-grade papers commonly used as sensor substrates. The properties are also consistent with those reported for other nanocellulose-based papers, exhibiting favorable values. Hence, black bamboo has strong potential as a sustainable paper-based sensor substrate. Moreover, no previous studies have reported the use of bamboo paper as a sensor substrate for the detection of bio-substances, e.g., H2O2 or dopamine, highlighting the significant contribution of this research.
Table 5.
Characteristics comparison with other paper substrates.
4. Conclusions
A comparative study of nanocellulose paper fabrication using the mechanical method and acid hydrolysis method has been carried out. The nanocellulose paper fabricated using the mechanical method involves the extraction of parenchyma cells, purification, ultrasonication, dilution, and drying, which yields average characteristics of 50.34° contact angle, 54.05% crystallinity, porosity of 24.54%, and a transmittance range of 4–30%. On the other hand, the fabrication of nanocellulose paper via the acid hydrolysis method includes strong acid hydrolysis, bleaching, dilution, and drying, which yields nanocellulose paper with average characteristics of 52.86° contact angle, 49.71% crystallinity, porosity of 15.75%, and a transmittance range of 5–19%. The utilization of bamboo-derived nanocellulose paper allows for colorimetric detection of dopamine and H2O2, with an LOD ranging from 1.79 mM to 20.03 mM and 0.94 mM to 1.04 mM, respectively. Overall, the current results show promising application of nanocellulose paper extracted from black bamboo as a paper sensor substrate. Particularly, the mechanical method using the extraction of parenchyma cells yields the most consistent thermophysical and mechanical properties suitable for a paper-based biosensor. Nonetheless, there remains room for further optimization of nanocellulose paper characteristics, particularly optical and mechanical properties.
Supplementary Materials
The following supporting information can be downloaded at: https://www.mdpi.com/article/10.3390/polysaccharides7010014/s1.
Author Contributions
Methodology, F.R. and F.N.A.; software, F.R. and F.N.A.; validation, R.A.W. and A.M.H.; writing—original draft preparation, F.R. and F.N.A.; writing—review and editing, F.R., R.A.W. and A.M.H.; visualization, F.R. and R.A.W.; supervision, R.A.W. and A.M.H.; funding acquisition, A.M.H. All authors have read and agreed to the published version of the manuscript.
Funding
This research was funded by the Ministry of Higher Education, Science, and Technology under scheme of Doctoral Dissertation Research Grant, contract number 112/E5/PG.02.00.PL/2023 and number 017/C3/DT.05.00/PL/2025.
Data Availability Statement
The original contributions presented in this study are included in the article/Supplementary Material. Further inquiries can be directed to the corresponding authors.
Acknowledgments
The author expresses sincere gratitude to the Ministry of Higher Education, Science, and Technology and Institut Teknologi Sepuluh Nopember for their invaluable support in funding and facilitating this research. This research was supported by Institut Teknologi Sepuluh Nopember under research grant No. 1892/PKS/ITS/2023 and No. 1181/PKS/ITS/2025.
Conflicts of Interest
The authors declare no conflicts of interest.
References
- Lim, H.; Jafry, A.T.; Lee, J. Fabrication, Flow Control, and Applications of Microfluidic Paper-Based Analytical Devices. Molecules 2019, 24, 2869. [Google Scholar] [CrossRef]
- Das, S.; Gagandeep; Bhatia, R. Paper-Based Microfluidic Devices: Fabrication, Detection, and Significant Applications in Various Fields. Rev. Anal. Chem. 2022, 41, 112–136. [Google Scholar] [CrossRef]
- Nishat, S.; Jafry, A.T.; Martinez, A.W.; Awan, F.R. Paper-Based Microfluidics: Simplified Fabrication and Assay Methods. Sens. Actuators B Chem. 2021, 336, 129681. [Google Scholar] [CrossRef]
- Ma, J.; Yan, S.; Miao, C.; Li, L.; Shi, W.; Liu, X.; Luo, Y.; Liu, T.; Lin, B.; Wu, W.; et al. Paper Microfluidics for Cell Analysis. Adv. Healthc. Mater. 2019, 8, 1801084. [Google Scholar] [CrossRef]
- Ghosh, R.; Gopalakrishnan, S.; Savitha, R.; Renganathan, T.; Pushpavanam, S. Fabrication of Laser Printed Microfluidic Paper-Based Analytical Devices (LP-ΜPADs) for Point-of-Care Applications. Sci. Rep. 2019, 9, 7896. [Google Scholar] [CrossRef]
- Kuswandi, B.; Hidayat, M.A.; Noviana, E. Paper-Based Sensors for Rapid Important Biomarkers Detection. Biosens. Bioelectron. X 2022, 12, 100246. [Google Scholar] [CrossRef]
- Teengam, P.; Siangproh, W.; Tuantranont, A.; Vilaivan, T.; Chailapakul, O.; Henry, C.S. Multiplex Paper-Based Colorimetric DNA Sensor Using Pyrrolidinyl Peptide Nucleic Acid-Induced AgNPs Aggregation for Detecting MERS-CoV, MTB, and HPV Oligonucleotides. Anal. Chem. 2017, 89, 5428–5435. [Google Scholar] [CrossRef]
- Kuswandi, B.; Ensafi, A.A. Perspective—Paper-Based Biosensors: Trending Topic in Clinical Diagnostics Developments and Commercialization. J. Electrochem. Soc. 2020, 167, 037509. [Google Scholar] [CrossRef]
- Bhattarai, R.K.; Pudasaini, S.; Sah, M.; Neupane, B.B.; Giri, B. Handmade Paper as a Paper Analytical Device for Determining the Quality of an Antidiabetic Drug. ACS Omega 2022, 7, 14074–14081. [Google Scholar] [CrossRef] [PubMed]
- Li, X.; Zhang, W.; Li, J.; Li, X.; Li, N.; Zhang, Z.; Zhang, D.; Rao, F.; Chen, Y. Optically Transparent Bamboo: Preparation, Properties, and Applications. Polymers 2022, 14, 3234. [Google Scholar] [CrossRef]
- González, I.; Alcalà, M.; Chinga-Carrasco, G.; Vilaseca, F.; Boufi, S.; Mutjé, P. From Paper to Nanopaper: Evolution of Mechanical and Physical Properties. Cellulose 2014, 21, 2599–2609. [Google Scholar] [CrossRef]
- Tanpichai, S.; Witayakran, S.; Srimarut, Y.; Woraprayote, W.; Malila, Y. Porosity, Density and Mechanical Properties of the Paper of Steam Exploded Bamboo Microfibers Controlled by Nanofibrillated Cellulose. J. Mater. Res. Technol. 2019, 8, 3612–3622. [Google Scholar] [CrossRef]
- Ibrahim, N.I.; Sultan, M.T.H.; Łukaszewicz, A.; Shah, A.U.M.; Shahar, F.S.; Józwik, J.; Najeeb, M.I.; Grzejda, R. Characterization and Isolation Method of Gigantochloa Scortechinii (Buluh Semantan) Cellulose Nanocrystals. Int J Biol Macromol 2024, 272. [Google Scholar] [CrossRef] [PubMed]
- Putra, A.F.; Ningrum, A.S.; Suyanto, S.; Pratiwi, V.M.; Widianto, M.Y.H.; Irkham, I.; Wahyuni, W.T.; Rahmawati, I.; Wang, F.-M.; Huang, C.-H.; et al. Monolayer Graphene/Platinum-Modified 3D Origami Microfluidic Paper-Based Biosensor for Smartphone-Assisted Biomarkers Detection. ADMET DMPK 2025, 13, 2833. [Google Scholar] [CrossRef]
- Balea, A.; Fuente, E.; Monte, M.C.; Merayo, N.; Campano, C.; Negro, C.; Blanco, A. Industrial Application of Nanocelluloses in Papermaking: A Review of Challenges, Technical Solutions, and Market Perspectives. Molecules 2020, 25, 526. [Google Scholar] [CrossRef] [PubMed]
- Danafar, F. Recent Development and Challenges in Synthesis of Cellulosic Nanostructures and Their Application in Developing Paper-Based Energy Devices. Cellul. Chem. Technol. 2020, 54, 327–346. [Google Scholar] [CrossRef]
- Peter, S.; Lyczko, N.; Gopakumar, D.; Maria, H.J.; Nzihou, A.; Thomas, S. Nanocellulose and Its Derivative Materials for Energy and Environmental Applications. J. Mater. Sci. 2022, 57, 6835–6880. [Google Scholar] [CrossRef]
- Zhang, X.; Huang, H.; Qing, Y.; Wang, H.; Li, X. A Comparison Study on the Characteristics of Nanofibrils Isolated from Fibers and Parenchyma Cells in Bamboo. Materials 2020, 13, 237. [Google Scholar] [CrossRef]
- Emamverdian, A.; Ding, Y.; Ranaei, F.; Ahmad, Z. Application of Bamboo Plants in Nine Aspects. Sci. World J. 2020, 2020, 7284203. [Google Scholar] [CrossRef]
- Rasheed, M.; Jawaid, M.; Parveez, B.; Zuriyati, A.; Khan, A. Morphological, Chemical and Thermal Analysis of Cellulose Nanocrystals Extracted from Bamboo Fibre. Int. J. Biol. Macromol. 2020, 160, 183–191. [Google Scholar] [CrossRef]
- Ren, D.; Wang, Y.; Wang, H.; Xu, D.; Wu, X. Fabrication of Nanocellulose Fibril-Based Composite Film from Bamboo Parenchyma Cell for Antimicrobial Food Packaging. Int. J. Biol. Macromol. 2022, 210, 152–160. [Google Scholar] [CrossRef]
- Li, J.; Lian, C.; Wu, J.; Zhong, T.; Zou, Y.; Chen, H. Morphology, Chemical Composition and Thermal Stability of Bamboo Parenchyma Cells and Fibers Isolated by Different Methods. Cellulose 2023, 30, 2007–2021. [Google Scholar] [CrossRef]
- Zhang, Z.; Li, X.; Qu, Y.; Wu, Y.; Wan, C. Current Progress in Bamboo-Based Transparent Materials for Flexible Electronic Devices. Cellulose 2025, 32, 6935–6963. [Google Scholar] [CrossRef]
- Suparno, O.; dan Danieli, R. Penghilangan Hemiselulosa Serat Bambu Secara Enzimatik Untuk Pembuatan Serat Bambu. J. Teknol. Ind. Pertan. 2017, 27, 89–95. [Google Scholar] [CrossRef]
- Zhang, X.; Guo, J.; Liu, Y.; Hao, X.; Ji, X.; Yang, Q. Biochemical Preparation of Hydrophobic and Lipophilic Nanocellulose from Hemp Stalk. Mater. Today Chem. 2023, 27, 101346. [Google Scholar] [CrossRef]
- Chen, Y.; Geng, B.; Ru, J.; Tong, C.; Liu, H.; Chen, J. Comparative Characteristics of TEMPO-Oxidized Cellulose Nanofibers and Resulting Nanopapers from Bamboo, Softwood, and Hardwood Pulps. Cellulose 2017, 24, 4831–4844. [Google Scholar] [CrossRef]
- Bosenbecker, M.W.; Maron, G.K.; Alano, J.H.; Marini, J.; de Oliveira, A.D. Isolation of Cellulose Nanocrystals from Bambusa Vulgaris Pulp via Physio-Chemical Approach. Biomass Convers. Biorefin. 2022, 14, 14153–14162. [Google Scholar] [CrossRef]
- Bindu, P.; Thomas, S. Estimation of Lattice Strain in ZnO Nanoparticles: X-Ray Peak Profile Analysis. J. Theor. Appl. Phys. 2014, 8, 123–134. [Google Scholar] [CrossRef]
- Ramadan, M.A.A.; Almasri, I.; Khayal, G. Spectrophotometric Determination of Dopamine in Bulk and Dosage Forms Using 2,4-Dinitrophenylhydrazine. Turk. J. Pharm. Sci. 2020, 17, 679–685. [Google Scholar] [CrossRef]
- Liu, M.M.; Lian, X.; Liu, H.; Guo, Z.Z.; Huang, H.H.; Lei, Y.; Peng, H.P.; Chen, W.; Lin, X.H.; Liu, A.L.; et al. A Colorimetric Assay for Sensitive Detection of Hydrogen Peroxide and Glucose in Microfluidic Paper-Based Analytical Devices Integrated with Starch-Iodide-Gelatin System. Talanta 2019, 200, 511–517. [Google Scholar] [CrossRef]
- Ghohestani, E.; Tashkhourian, J.; Hemmateenejad, B. Colorimetric Determination of Peroxide Value in Vegetable Oils Using a Paper Based Analytical Device. Food Chem. 2023, 403, 134345. [Google Scholar] [CrossRef]
- Jiang, X.; Cheng, J.; Yang, F.; Hu, Z.; Zheng, Z.; Deng, Y.; Cao, B.; Xie, Y. Visual Colorimetric Detection of Edible Oil Freshness for Peroxides Based on Nanocellulose. Foods 2023, 12, 1896. [Google Scholar] [CrossRef]
- Wijaya, C.J.; Ismadji, S.; Aparamarta, H.W.; Gunawan, S. Optimization of Cellulose Nanocrystals from Bamboo Shoots Using Response Surface Methodology. Heliyon 2019, 5, e02807. [Google Scholar] [CrossRef]
- French, A.D. Idealized Powder Diffraction Patterns for Cellulose Polymorphs. Cellulose 2014, 21, 885–896. [Google Scholar] [CrossRef]
- Heryanto; Abdullah, B.; Tahir, D.; Mahdalia. Quantitative Analysis of X-Ray Diffraction Spectra for Determine Structural Properties and Deformation Energy of Al, Cu and Si. J. Phys. Conf. Ser. 2019, 1317, 012052. [Google Scholar] [CrossRef]
- Thipchai, P.; Punyodom, W.; Jantanasakulwong, K.; Thanakkasaranee, S.; Hinmo, S.; Pratinthong, K.; Kasi, G.; Rachtanapun, P. Preparation and Characterization of Cellulose Nanocrystals from Bamboos and Their Application in Cassava Starch-Based Film. Polymers 2023, 15, 2622. [Google Scholar] [CrossRef]
- Liu, X.; Wang, H.; Wu, M.; Huang, Y. Transparent Nanopaper from Nanofibrillated Bamboo Pulp. Bioresources 2023, 18, 3995. [Google Scholar] [CrossRef]
- Lin, Q.; Huang, Y.; Yu, W. Effects of Extraction Methods on Morphology, Structure and Properties of Bamboo Cellulose. Ind. Crops Prod. 2021, 169, 113640. [Google Scholar] [CrossRef]
- Chen, H. Theoretical Basis of Lignocellulose Biorefining. In Lignocellulose Biorefinery Engineering; Elsevier: Amsterdam, The Netherlands, 2015; pp. 19–36. [Google Scholar] [CrossRef]
- Zhang, S.; Zhang, F.; Jin, L.; Liu, B.; Mao, Y.; Liu, Y.; Huang, J. Preparation of Spherical Nanocellulose from Waste Paper by Aqueous NaOH/Thiourea. Cellulose 2019, 26, 5177–5185. [Google Scholar] [CrossRef]
- Cheng, D.; Li, T.; Smith, G.; Yang, J.; Hang, C.; Miao, Z.; Wu, Z. Influence of Calcium Chloride Impregnation on the Thermal and High-Temperature Carbonization Properties of Bamboo Fiber. PLoS ONE 2019, 14, e0212886. [Google Scholar] [CrossRef]
- Li, W.; Zhang, Z.; Wang, X.; Mei, C.; Van Acker, J.; Van den Bulcke, J. Understanding the Effect of Growth Ring Orientation on the Compressive Strength Perpendicular to the Grain of Thermally Treated Wood. Wood Sci. Technol. 2021, 55, 1439–1456. [Google Scholar] [CrossRef]
- Bang, J.; Lee, H.; Yang, Y.; Oh, J.K.; Kwak, H.W. Nano/Micro Hybrid Bamboo Fibrous Preforms for Robust Biodegradable Fiber Reinforced Plastics. Polymers 2021, 13, 636. [Google Scholar] [CrossRef]
- Kumawat, N.; Soman, S.S.; Vijayavenkataraman, S.; Kumar, S. Rapid and Inexpensive Process to Fabricate Paper Based Microfluidic Devices Using a Cut and Heat Plastic Lamination Process. Lab Chip 2022, 22, 3377–3389. [Google Scholar] [CrossRef]
- Sehaqui, H.; Zhou, Q.; Ikkala, O.; Berglund, L.A. Strong and Tough Cellulose Nanopaper with High Specific Surface Area and Porosity. Biomacromolecules 2011, 12, 3638–3644. [Google Scholar] [CrossRef]
- De Souza, A.G.; Kano, F.S.; Bonvent, J.J.; Dos Santos Rosa, D. Cellulose Nanostructures Obtained from Waste Paper Industry: A Comparison of Acid and Mechanical Isolation Methods. Mater. Res. 2017, 20, 209–214. [Google Scholar] [CrossRef]
- Santmartí, A.; Lee, K.-Y. Crystallinity and Thermal Stability of Nanocellulose. In Nanocellulose and Sustainability; Series: Sustainability Contributions Through Science and Technology; CRC Press: Boca Raton, FL, USA, 2018; pp. 67–86. [Google Scholar] [CrossRef]
- Tseng, H.Y.; Lizama, J.H.; Shen, Y.W.; Chen, C.J. The Pursuit of Further Miniaturization of Screen Printed Micro Paper-Based Analytical Devices Utilizing Controlled Penetration towards Optimized Channel Patterning. Sci. Rep. 2021, 11, 21496. [Google Scholar] [CrossRef] [PubMed]
- Bausch, F.; Owusu, D.D.; Jusner, P.; Rosado, M.J.; Rencoret, J.; Rosner, S.; Del Río, J.C.; Rosenau, T.; Potthast, A. Lignin Quantification of Papyri by Tga—Not a Good Idea. Molecules 2021, 26, 4384. [Google Scholar] [CrossRef]
- Guimarães, B.M.R.; Scatolino, M.V.; Martins, M.A.; Ferreira, S.R.; Mendes, L.M.; Lima, J.T.; Junior, M.G.; Tonoli, G.H.D. Bio-Based Films/Nanopapers from Lignocellulosic Wastes for Production of Added-Value Micro-/Nanomaterials. Environ. Sci. Pollut. Res. 2022, 29, 8665–8683. [Google Scholar] [CrossRef]
- Zhang, K.; Liu, L.; Cui, S.; Wang, X.; Li, N.; Li, C.; Yang, C.; Fan, C.; Li, J.; Yang, Y.; et al. Multifunctional Magnetic Cellulose Aerogel Nanopaper Made from Nanofibrillated Bamboo Pulp Fiber as Templates. Ind. Crops Prod. 2025, 226, 120642. [Google Scholar] [CrossRef]


Disclaimer/Publisher’s Note: The statements, opinions and data contained in all publications are solely those of the individual author(s) and contributor(s) and not of MDPI and/or the editor(s). MDPI and/or the editor(s) disclaim responsibility for any injury to people or property resulting from any ideas, methods, instructions or products referred to in the content. |
© 2026 by the authors. Licensee MDPI, Basel, Switzerland. This article is an open access article distributed under the terms and conditions of the Creative Commons Attribution (CC BY) license.