Abstract
The United Nations has set a global vision towards emissions reduction and green growth through the Sustainable Development Goals (SDGs). Towards the realisation of SDGS 7, 9, and 13, we focus on green hydrogen production as a potential pathway to achievement. Green hydrogen, produced via water electrolysis powered by renewable energy sources, represents a pivotal solution towards climate change mitigation. Energy access in West Africa remains a challenge, and dependency on fossil fuels persists. So, green hydrogen offers an opportunity to harness abundant solar resources, reduce carbon emissions, and foster economic development. This study evaluates the techno-economic feasibility of green hydrogen production in five West African countries: Ghana, Nigeria, Mali, Niger, and Senegal. The analyses cover the solar energy potential, hydrogen production capacities, and economic viability using the Levelised Cost of Hydrogen (LCOH) and Net Present Value (NPV). Results indicate substantial annual hydrogen production potential with LCOH values competitive with global benchmarks amidst the EU’s Carbon Border Adjustment Mechanism (CBAM). Despite this potential, several barriers exist, including high initial capital costs, policy and regulatory gaps, limited technical capacity, and water resource constraints. We recommend targeted strategies for strengthening policy frameworks, fostering international partnerships, enhancing regional infrastructure integration, and investing in capacity-building initiatives. By addressing these barriers, West Africa can be a key player in the global green hydrogen market.
1. Introduction
The global energy transition towards sustainable and low-carbon solutions has placed hydrogen, particularly green hydrogen, at the forefront of energy discussions. Green hydrogen, produced through water electrolysis using solar or wind energy, is increasingly recognised as a promising energy carrier to address climate change and energy security challenges. For West Africa, a region grappling with limited energy access, high dependence on fossil fuels, and vulnerability to climate change, green hydrogen represents an opportunity to harness abundant renewable energy resources while contributing to regional economic development and decarbonisation objectives [,].
Over the years, significant progress has been made in global hydrogen research, with studies focusing on production techniques, economic feasibility, and integrating hydrogen into energy systems [,]. Such studies have focused on developed economies, leaving gaps in understanding the techno-economic prospects of green hydrogen in developing regions like West Africa. Existing studies highlight the vast renewable energy potential of the region, particularly solar energy, but emphasise challenges such as high infrastructure costs, limited technological expertise, and inadequate policy frameworks [,,]. These challenges underscore the need for localised assessments considering West African countries’ unique socio-economic and climatic conditions [].
Despite its prospects, the development of a green hydrogen economy in West Africa faces critical barriers, including the high cost of electrolysers, insufficient energy infrastructure, and a lack of supportive policy frameworks []. Additionally, while the region’s renewable energy potential is well-documented, few studies have quantified its economic viability for green hydrogen production [,]. This research gap is particularly critical as the global push for net-zero carbon emissions by 2050 increasingly positions green hydrogen as a cornerstone of a sustainable energy system [,].
Against the above background, this study contributes to the sustainability literature as it focuses on green hydrogen production as a potential pathway to achieving SDGS 7, 9, and 13. Green hydrogen, produced via water electrolysis powered by renewable energy sources, represents a pivotal solution towards energy poverty and climate change. Energy affordability in West Africa remains a challenge, and dependency on fossil fuels persists. So, green hydrogen offers an opportunity to harness abundant solar resources, reduce carbon emissions, and foster economic development. Furthermore, this study evaluates the techno-economic feasibility of green hydrogen production in five West African countries: Ghana, Nigeria, Mali, Niger, and Senegal. The analysis covers the solar energy potential, hydrogen production capacities, and economic viability using the Levelised Cost of Hydrogen (LCOH) and Net Present Value (NPV). It is a pertinent issue to consider in the light of the EU’s Carbon Border Adjustment Mechanism (CBAM) that includes the hydrogen sector.
1.1. Literature Review
This section provides a comprehensive review of literature relevant to the study, focusing on the potential of green hydrogen in West Africa as a sustainable energy solution. The review is structured around theoretical frameworks and empirical findings, focusing on energy decarbonisation, solar energy production, electricity access, and water accessibility. The section also explores the interaction between green hydrogen production and decarbonisation and the region’s energy production and consumption dynamics [,,,,,].
1.1.1. Theoretical Framework
The theoretical framework of this study is grounded in energy decarbonisation theory, which emphasises the transition from fossil fuels to low-carbon energy sources to mitigate climate change. Green hydrogen, produced through electrolysis using renewable energy, is positioned as a key component of this transition. The framework also incorporates solar energy production theory, which highlights the role of solar energy in generating electricity for hydrogen production, and electricity access theory, which addresses the challenges of energy access in West Africa, particularly in rural and underserved areas [,,] as shown in Figure 1.
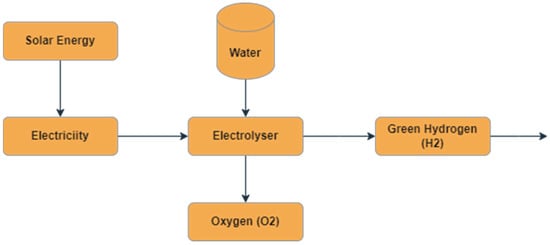
Figure 1.
Conceptual framework of green hydrogen energy production from solar energy.
The literature underscores the importance of integrating renewable energy sources like solar and wind into the energy mix to achieve decarbonisation goals [,]. The theoretical framework also considers the socio-economic impacts of green hydrogen production, including job creation, economic growth, and energy security.
- A.
- Solar Energy Production Concept
Solar energy is identified as a key driver for green hydrogen production in West Africa as shown in Figure 1. The region has significant solar potential, with solar irradiation levels ranging from 1850 to 2357 kWh/m2/year [,]. Solar photovoltaic (PV) and thermal systems are the primary technologies for harnessing solar energy, with PV systems particularly suitable for electrolysis [,]. The literature emphasises that solar energy can provide a reliable and cost-effective source of electricity for green hydrogen production []. However, the intermittent nature of solar energy poses challenges, which can be mitigated through energy storage systems such as battery banks or hydrogen storage []. The integration of solar energy into the hydrogen production process is crucial for achieving a sustainable energy future in West Africa.
- B.
- Electricity Access
Access to electricity remains a significant challenge for low-income countries in West Africa, with an average electrification rate of around 36% [,]. The region’s electricity infrastructure is characterised by poor performance, technical instability, and inadequate investment [,]. The literature highlights the potential of green hydrogen to improve energy access by providing a decentralised and sustainable energy source ([,]. The West African Power Pool (WAPP) is identified as a key initiative for improving regional energy integration and electricity trade []. Meanwhile, significant disparities in electricity access persist, particularly in rural areas in the region. Green hydrogen production, powered by renewable energy, can help address these disparities by providing a reliable and clean energy source for underserved communities [].
1.1.2. Empirical Review
Several renowned researchers have explored the techno-economic viability of green hydrogen production, employing various methodologies to assess feasibility, cost, and scalability. Two studies, “Uncovering the true cost of hydrogen production routes using life cycle monetisation” and “Techno-economic analysis of hydrogen electrolysis from off-grid stand-alone photovoltaics incorporating uncertainty analysis” [,], have established robust frameworks for Levelised Cost of Hydrogen (LCOH) calculations, which form the basis for many contemporary analyses. While Africa possesses immense solar potential, recent work by [] suggests hydrogen production remains economically uncompetitive without substantial policy interventions, particularly in West African contexts with underdeveloped energy infrastructure.
Spatial optimisation research has advanced significantly through geographical information system (GIS) approaches. The studies of [,] demonstrated the effectiveness of Multi-Criteria Decision-Making (MCDM) for renewable energy siting, though their models often overlook critical logistical constraints. This limitation is particularly evident in West Africa, where water scarcity for electrolysis—as noted by []—presents a major implementation barrier. Technological innovation has been a key focus area, with [] providing foundational research on electrolyser efficiency under variable renewable inputs. Akpahou et al. [] cautioned that many technical studies could fail to account for real-world economic and policy constraints that significantly impact project viability.
The policy dimension remains understudied in African contexts. While [,] examined regulatory frameworks in ECOWAS countries, their analysis did not incorporate the financial risk factors that [] identified as crucial for hydrogen investments. This gap is particularly significant given the findings of [] regarding the impact of economic policy uncertainties on renewable energy projects in Sub-Saharan Africa. This study addresses these research gaps by integrating three critical dimensions: the techno-economic modelling approaches refined [], the policy analysis framework developed [], and the infrastructure assessment methodologies employed []. Such comprehensive analysis is particularly vital for West Africa, where [] notes that successful hydrogen deployment will require simultaneous progress across technical, financial, and regulatory fronts.
2. Materials and Methods
This section outlines the data sources, variables, and analytical methods employed to achieve the study’s objectives. Guided by a positivist research philosophy and a quantitative methodological approach, the study adopts an objectivist epistemology, which posits that an observable and measurable reality exists independently of the researcher. According to [], objectivist epistemology underpins empirical inquiries by emphasising the discovery of objective truths through systematic observation and analysis. This epistemological stance minimises subjective bias and supports the production of valid, reliable, and replicable results [,].
This study draws on data related to solar energy potential, electrolyser efficiency, and economic performance metrics such as Net Present Value (NPV) and Levelised Cost of Hydrogen (LCOH). Using a techno-economic analysis framework, the research integrates technical parameters and financial indicators (indicated in Table 1) to assess the feasibility of green hydrogen production in West Africa. This includes evaluating solar resource availability, system efficiency, and associated capital and operational costs for hydrogen infrastructure.

Table 1.
Variables, parameters, and measurements.
Data Description and Data Sources
We used monthly time-series data (January–December 2018) obtained for five West African countries: Ghana, Nigeria, Mali, Niger, and Senegal. The data were obtained based on their renewable energy potential. Figure 2 highlights the five countries’ geographic distribution and solar irradiation levels, and Table 1 shows all the variables modelled with the relevant parameters.
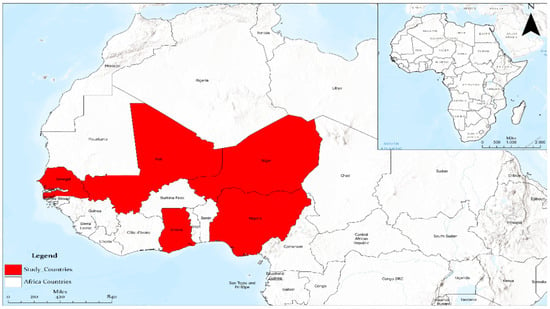
Figure 2.
Countries under study.
Secondary data from the International Renewable Energy Agency (IRENA), Africa Solar Atlas, International Energy Agency (IEA), and national energy agencies was extracted for analysis. Specifically, the secondary data sourced include daily solar irradiation levels (kWh/m2/day) for each country; technical specifications of photovoltaic (PV) systems and electrolysers; and economic indicators such as capital, operational, and electricity costs.
- Solar Energy Generation:
Each country’s monthly average solar Global Horizontal Irradiation (GHI) values were determined and used to estimate the ideal energy for future PV system installations in all selected locations. Furthermore, we assess the viability of a PV system in the selected countries in West Africa, as shown in Figure 2. The mean monthly power generation from the proposed system is shown in Figure 3 and Figure 4.
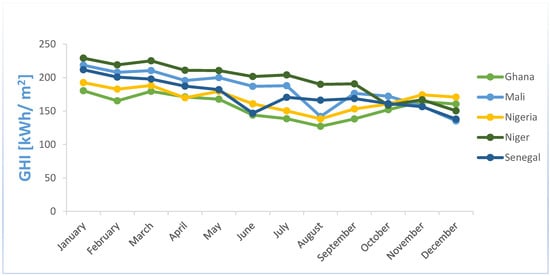
Figure 3.
Monthly average solar irradiation received at the horizontal plane of the selected countries in kWh/m2.
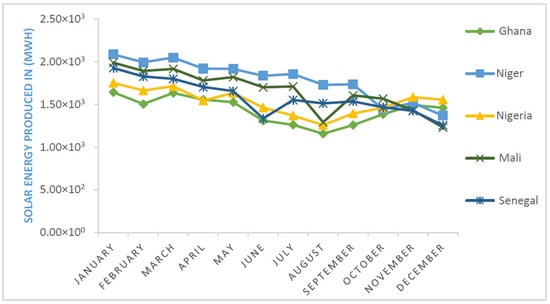
Figure 4.
Monthly average solar energy (MWh) produced by the PV system.
Figure 2 shows the geographical coordinates of each study area in the region, and Figure 4 presents the further computation that was made to obtain the total annual solar power required in gigawatts for each country’s proposed PV electrolyser system. For instance, it is observed that the highest annual value of solar power estimation generated is recorded in the northwestern part of West African inland regions such as Niger (latitude 14.8592°00′ N, longitude 6.4590°00′ E) and Mali (latitude 17°00′ N, longitude 4°00′ W) with 21.437 GWh and 19.924 GWh, respectively. Meanwhile, in the southwestern part of the West African coastal region, Nigeria (latitude 10°00′ N, longitude 8°00′ E), Ghana (latitudes 8°0′ N, and longitudes 2°00′ W), and Senegal (latitude 14.6943° N, longitude 15.5953° W) observed the lowest values with 18.383 GWh, 17.180 GWh, and 18.986 GWh, respectively. In all, it is shown that Niger has the peak annual average solar energy generated and required for the solar panel–water electrolysis system for green hydrogen production.
3. Results and Discussions
3.1. Solar Energy Potential and Hydrogen Production Estimates in West Africa
The results are presented within the context of West Africa’s solar energy potential, evaluating its viability for large-scale hydrogen production while addressing regional policy, infrastructural, and economic challenges.
3.1.1. Global Solar Resources
A parameter known as Global Horizontal Irradiation (GHI) is used to analyse the solar resources in the five countries selected as the study area [,]. The annual averaged GHI values, with an average West African region temperature of 25.204 degrees Celsius for all five countries, are provided in Figure 4. The values of GHI were found to vary from 1888.54 kWh/m2 to 2356.54 kWh/m2/year [,,,,,]. The maximum and minimum annual values of GHI are recorded in Niger and Ghana, with a value of 2356.54 kWh/m2/year and 1888.54 kWh/m2/year, respectively. Moreover, we observed that the highest and lowest national average values of air temperature are registered in Niger and Ghana, with values of 26.451 and 20.257 degrees Celsius, respectively, in this study [,,]. Moreover, the monthly geographical record of solar potential is crucial in evaluating the countries with optimum solar potential yearly [,,,,].
where EPV [kWh] is the power output of a PV unit, ηPV is the efficiency, APV [m2] is the PV area, Ta [°C] is the surrounding temperature, and GHI [kWh/m2] is the sun radiation incoming on the horizontal plane.
In Figure 3, the solar irradiation data from January to December in Ghana, Mali, Niger, Nigeria, and Senegal reveal significant variations in solar energy potential across these countries, reflecting differences in geographical location, climatic conditions, and seasonal weather patterns. Ghana, for instance, exhibits a relatively stable solar irradiation pattern, with monthly values ranging from 127.2 kWh/m2 in August to 180.4 kWh/m2 in January. Meanwhile, Mali’s pattern throughout the year observed a drop to almost that of Nigeria’s irradiation level, 141.9 kWh/m2 and 138.3 kWh/m2 in August, respectively, before picking again. This consistency aligns with the literature suggesting that Ghana’s equatorial climate provides uniform solar exposure throughout the year, albeit with a slight dip during the rainy season [,,]. In contrast, Mali and Niger, both located in the Sahel region, demonstrate higher solar irradiation levels, with Niger recording the highest values, peaking at 229.1 kWh/m2, followed by Mali peaking at 218.6 kWh/m2 in January. The latter outcome is consistent with studies highlighting the Sahel’s exceptional solar energy potential due to its arid climate and minimal cloud cover [,,]. Furthermore, the data also reveal a notable decline in solar irradiation during the rainy season (June to September) in these countries, confirming the influence of seasonal monsoons on solar energy availability [,].
Nigeria and Senegal present intermediate solar irradiation levels compared to Ghana and the Sahelian countries. Nigeria’s values range from 138.3 kWh/m2 in August to 192.5 kWh/m2 in January, while Senegal’s range from 138 kWh/m2 in December to 211.7 kWh/m2 in January before dropping drastically to almost Ghana’s irradiation level of 146.7 kWh/m2 and 144 kWh/m2 in June, respectively (Figure 3). These figures suggest that Nigeria’s solar potential is slightly lower than that of Senegal, which may be attributed to Nigeria’s more extensive forest cover and higher humidity levels, particularly in the southern regions [,,]. Senegal’s higher irradiation levels, particularly in the dry season, align with its geographical position in the Sahel–Sudan transition zone, which benefits from prolonged periods of clear skies [,,,,]. Meanwhile, both countries experience a significant drop in solar irradiation during the rainy season, corroborating findings that West Africa’s monsoon systems substantially impact solar energy generation [,,,,]. This seasonal variability underscores the need for adaptive energy planning and storage solutions to ensure there is consistent energy supply.
The comparative analysis reveals that while all five countries possess substantial solar energy potential, the Sahelian countries (Mali and Niger) consistently outperform the coastal and forested nations (Ghana, Nigeria, and Senegal) in terms of solar irradiation. Still, they all tend to converge starting from October to November. This finding aligns with existing literature emphasising the Sahel’s unique advantage for solar energy development due to its high irradiation levels and low precipitation [,]. The data also highlight the challenges posed by seasonal variability, particularly in countries like Ghana and Nigeria, where the rainy season significantly reduces solar energy availability. This variability necessitates region-specific strategies for solar energy deployment, such as hybrid energy systems combining solar with other renewable sources or grid integration to mitigate seasonal fluctuations [,]. Overall, the data underscore the importance of leveraging geographical and climatic insights to optimise solar energy utilisation across West Africa.
3.1.2. Solar Energy Potential
The analysis revealed significant solar energy potential across the five selected countries. Annual solar irradiation levels ranged from 1850 kWh/m2 to 2350 kWh/m2, with Niger and Mali demonstrating the highest values. This abundant solar resource forms a solid foundation for large-scale photovoltaic (PV) electricity generation, crucial for powering electrolysers in green hydrogen production. Monthly variations in solar irradiation indicated consistent energy availability, reducing the need for extensive energy storage systems.
where [kWh] is the renewable energy production; [kWh] is the energy required by the electrolyser; is the electrolysis efficiency, and η is in addition to the efficiency coefficient, including consideration of the losses.
Figure 4 shows the monthly average of the solar energy produced in MWh from the solar irradiation received at a horizontal plane in kWh/m2 within the selected West African countries. The monthly average solar energy production data for Ghana, Niger, Nigeria, Mali, and Senegal reveal distinct patterns in solar energy generation across these West African countries, reflecting variations in solar irradiation and climatic conditions. Niger consistently leads in solar energy production, with values ranging from 1.37 × 10³ MWh in December to 2.08 × 10³ MWh in January, confirming its status as one of the most solar-rich countries in the region due to its arid climate and high irradiation levels [,,].
Mali and Senegal follow closely, with Mali producing between 1.23 × 10³ MWh in December and 1.99 × 10³ MWh in January, and Senegal ranging from 1.26 × 10³ MWh in December to 1.93 × 10³ MWh in January. Mali’s pattern throughout the year observed a drop to almost that of Nigeria’s solar energy produced by the PV system level, which is 1.29 × 10³ MWh and 1.26 × 10³ MWh in August, respectively. Also, Senegal’s pattern dropped drastically to almost Ghana’s solar energy production level of 1.33 × 10³ MWh and 1.31 × 10³ MWh in June, respectively. These findings align with the literature emphasising the Sahelian region’s exceptional solar potential, attributed to minimal cloud cover and prolonged dry seasons []. Notably, we see a significant decline in energy production during the rainy season (June to September), particularly in Mali and Senegal, which corroborates studies on the impact of seasonal monsoons on solar energy availability [,,]. This seasonal variability underscores the need for robust energy storage systems and hybrid energy solutions to mitigate fluctuations in solar energy production.
In contrast, Ghana and Nigeria exhibit lower solar energy production levels, with Ghana producing between 1.16 × 10³ MWh in August and 1.64 × 10³ MWh in January, and Nigeria ranging from 1.26 × 10³ MWh in August to 1.75 × 10³ MWh in January. These lower values can be attributed to their geographical locations, which are characterised by higher humidity, forest cover, and more pronounced rainy seasons, particularly in southern regions [,,,]. While some studies argue that these countries still possess significant solar potential, especially in their northern regions [,,], others highlight the challenges posed by frequent cloud cover and seasonal rainfall, which reduce solar irradiation and energy production [,]. Despite these challenges, the data suggest that Ghana and Nigeria maintain relatively stable solar energy production throughout the year compared to the Sahelian countries, which experience more pronounced seasonal dips. This stability could be advantageous for grid integration and long-term energy planning, provided that complementary energy sources are incorporated to address periods of reduced solar output. Overall, the data emphasise the importance of region-specific strategies for optimising solar energy utilisation across West Africa, considering geographical advantages and climatic constraints.
3.1.3. Energy Required by the Electrolyser
We compute the electrolyser’s capacity by determining the amount of green hydrogen needed to produce. Its capacity will be affected by the electrolyser’s efficiency, conversion losses, and the pace at which hydrogen is produced. As such, Equation (3) calculates the energy needed for the water electrolysis process by multiplying the theoretical specific energy required by the electrolysis at a given temperature (in kWh/kg) with the annual hydrogen production capacities (in kg/year), divided by the electrolyser’s energy efficiency [].
where is the energy needed for the water electrolysis; is the specific energy of the electrolyser; is the mass of hydrogen produced in a year, and is the efficiency of the electrolyser.
The energy required by the hydrogen electrolyser from the solar energy produced by the PV system is shown in Figure 5. This energy from solar PV systems in Ghana, Niger, Nigeria, Mali, and Senegal demonstrates significant variability across months and countries, reflecting differences in solar energy production and seasonal climatic conditions. Niger consistently requires the highest energy input for hydrogen production, with values ranging from 8.62 × 10² MWh in December to 1.31 × 10³ MWh in January, aligning with its higher solar energy production due to its arid climate and high irradiation levels [,,,,]. Mali and Senegal follow closely, with Mali requiring between 8.13 × 10² MWh in August and 1.25 × 10³ MWh in January, and Senegal ranging from 7.91 × 10² MWh in December to 1.21 × 10³ MWh in January. These findings confirm the Sahelian region has the potential for large-scale hydrogen production, supported by abundant solar resources [,,].
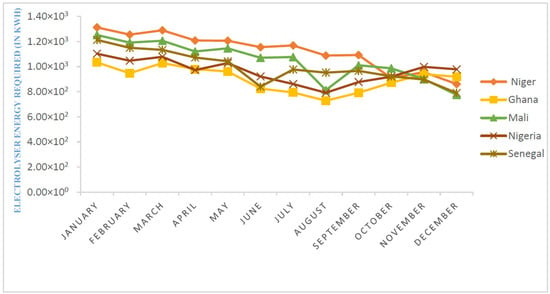
Figure 5.
Energy required by the hydrogen electrolyser (in kWh).
Additionally, the empirical output reveals a pronounced seasonal decline in energy requirements during the rainy season (June to September), particularly in Mali and Senegal. For instance, Mali’s pattern throughout the year observed a drop to almost that of Nigeria’s energy required by the electrolyser, which is 8.13 × 10² MWh and 7.93 × 10² MWh in August, respectively. Also, Senegal’s pattern dropped drastically to almost Ghana’s energy required by the electrolyser, 8.41 × 10² MWh and 8.25 × 10² MWh, respectively, in June, which aligns with studies highlighting the impact of monsoon systems on solar energy availability [,,]. This seasonal variability challenges consistent hydrogen production, necessitating energy storage or hybrid systems to ensure stable electrolyser operation.
In contrast, Ghana and Nigeria exhibit lower energy requirements for hydrogen electrolysers, with Ghana ranging from 7.29 × 10² MWh in August to 1.03 × 10³ MWh in January and Nigeria between 7.93 × 10² MWh in August and 1.10 × 10³ MWh in January. These lower values are consistent with reduced solar energy production, attributed to higher humidity, forest cover, and more pronounced rainy seasons, particularly in southern regions [,]. While some studies argue that these countries still possess significant potential for hydrogen production, especially in their northern regions with higher solar irradiation [,,], others emphasise the challenges posed by frequent cloud cover and seasonal rainfall, which limit solar energy availability [,,]. Despite these challenges, Ghana and Nigeria maintain relatively stable energy requirements for hydrogen production compared to the Sahelian countries, which experience more significant seasonal fluctuations. This stability could facilitate more predictable hydrogen production schedules, provided that complementary energy sources or storage solutions are integrated to address periods of reduced solar output. Overall, the data underscore the importance of tailoring hydrogen production strategies to regional solar energy availability and climatic conditions, ensuring efficient and sustainable utilisation of solar resources across West Africa.
3.2. Hydrogen Production Estimates
3.2.1. Estimation of Solar Hydrogen Production
Hydrogen produced utilising inexhaustible sources is generally linked to PV and wind energy potential, directly impacting the power from every source. Hence, there is a direct correlation between the projected hydrogen produced and the potential for renewable electricity. Nonetheless, the allocation of low-carbon hydrogen from solar energy across various countries behaves differently, attributed to the diverse nature of solar irradiation and the specific geographic location, climatic conditions, and technological constraints.
Figure 5, Figure 6 and Figure 7 show each country’s estimated potential for solar renewable electricity. At the national level (Figure 6 and Figure 7), the monthly PV-based hydrogen generation potential varies among Niger, Mali, and Senegal.
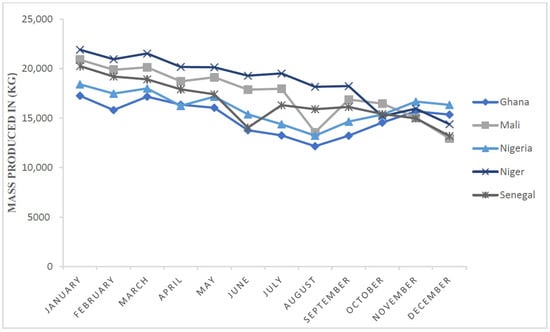
Figure 6.
Monthly mass of hydrogen produced in kilograms (Kg).
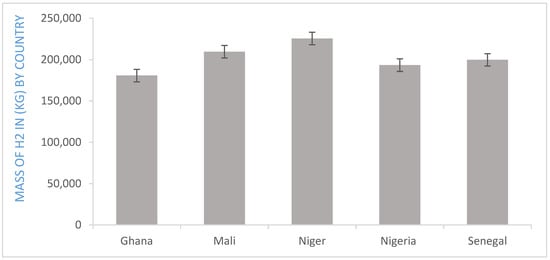
Figure 7.
Yearly mass of H2 produced in kilograms (Kg).
Niger demonstrates peak production in January and March at 22 tons/month, decreasing to its lowest in December at 14 tons/month. Mali follows a similar trend, peaking in January (21 tons/month) and March (20 tonnes/month). Mali’s output later declines, nearly matching Nigeria’s hydrogen generation levels of 13.5 tons in August and 13.2 tons in August respectively, before dropping to its lowest point in December (13 tons/month) (Figure 6). This trend aligns with seasonal solar radiation variations, where Mali’s levels in August drop to 141.9 kWh/m2, comparable to Nigeria’s 138.3 kWh/m2, indicating that seasonal cloud cover impacts PV efficiency [,,].
Senegal, though a coastal country, exhibits PV hydrogen production values close to those of inland countries like Niger and Mali due to its proximity to the Sahara Desert. The highest monthly production of 19 tons/month occurs in January and March, with the lowest values (15–17 tons/month) spanning June to December. In June, Senegal’s pattern dropped significantly to almost Ghana’s hydrogen amount produced at 14 tons and 13.8 tons, respectively. Similar patterns in solar availability are confirmed [,], suggesting that proximity to arid zones enhances PV yield even in coastal areas.
In contrast, coastal nations like Nigeria and Ghana show greater variability in solar-based hydrogen production. Ghana produces 181 tons/year, making it the second most favourable coastal country after Nigeria (193 tons/year) for green hydrogen production. In Senegal, the highest monthly generation in January and March is 20 and 19 tons/month, respectively, while the lowest is observed in June and December at 14 and 13 tons/month. The latter result aligns with [], emphasising that while the Sahel region offers high solar potential, regional differences in weather patterns can significantly impact production feasibility. The study categorises countries into two distinct groups based on production feasibility and investment attractiveness. The first group, comprising Niger, Mali, and Senegal, has strong hydrogen production potential due to its geographical proximity to the Sahara Desert, providing high solar availability. The second group, including Ghana and Nigeria, benefits from better investment appeal due to stronger grid infrastructure and access to energy markets despite slightly lower solar efficiency []. Albedo effects influence solar efficiency in southern regions, where vegetation and cloud cover increase light reflection, reducing effective PV conversion rates. Despite this limitation, Ghana and Nigeria remain attractive due to greater infrastructure readiness and policy support for green energy.
Meanwhile, while hydrogen production feasibility is high in the northern Sahara-adjacent regions, investment attraction remains limited due to underdeveloped grid systems and financing gaps. The estimated annual hydrogen production capacity, based on an electrolyser efficiency of 70%, shows Niger leading with 225 tons/year, followed by Mali (210 tons/year) and Senegal (200 tons/year). Coastal countries like Nigeria and Ghana range between 180 and 193 tons/year. These findings reaffirm the viability of large-scale hydrogen projects in West Africa while emphasising the importance of targeted investment strategies and technological improvements to bridge regional disparities in green hydrogen adoption.
3.2.2. Economic Analysis of Produced Hydrogen
To determine if the project is financially feasible and sustainable, analysing the financial possibility of solar PV–hydrogen production plants benefits investors and policymakers.
where Celec [USD] is the capital cost of the electrolyser, Celec,u [USD/kWe] is the unit cost of the electrolyser, [kWh/kg] is the theoretical specific energy the electrolyser needs, and CF is the capacity factor. Under the baseline scenario, we assume an electrolyser unit cost of 368 USD/kWe, with predefined target values [].
- (i)
- Net Present Value (NPV)
The Net Present Value (NPV) represents the difference between the current value of a project’s cash inflows and outflows. NPV is calculated using Equation (6) []. Investing in a hydrogen energy project is financially viable if the Net Present Value (NPV) is positive and not acceptable if the NPV is negative.
where is the initial investment cost, is the energy produced, is the annual operation and maintenance cost, is the annual replacement cost, r is the discount rate, n is the project’s economic life, and for the year t.
- (ii)
- Simple Payback Time (SPT)
The Simple Payback Time (SPT) is the years needed for the monetary flow to match the initial investment. It also indicates the duration an owner requires to recover the initial cost through revenues or benefits. We used Equation (8) [] below to calculate the Simple Payback Time:
where represents the project’s initial capital cost, is the energy savings per year, reflects the yearly capacity savings, and is the annual operation and maintenance cost.
- (iii)
- Levelised Capital Cost (LCC)
After that, the researcher will evaluate the cost of producing hydrogen by considering the electrolyser system’s capital expenditures, maintenance costs, power costs, and other operating costs. In this study, the researcher uses equations that consider these considerations to obtain the Levelised Capital Cost (LCC).
where is the Levelised Capital Cost, is the annual operation and maintenance cost, is the annual replacement cost, r is the discount rate, is the initial funding cost, and N is the project’s financial life.
4. Discussion
4.1. Financial and Comparative Analytics
Investment potential in Niger, Mali, Senegal, Nigeria, and Ghana is influenced by total capital expenditure (CAPEX), with Niger requiring the highest solar PV plant investment at USD 9 million, followed by Mali (USD 8.7 million) and Senegal (USD 7.7 million). Conversely, Nigeria and Ghana observe lower investment requirements at USD 6.9 million and USD 6.6 million, respectively. Similarly, for water electrolyser systems, Niger demands USD 380 million, Mali USD 354 million, and Senegal USD 320 million, while Nigeria and Ghana require USD 300 million and USD 295 million, respectively, as shown in Figure 8 and Figure 9.
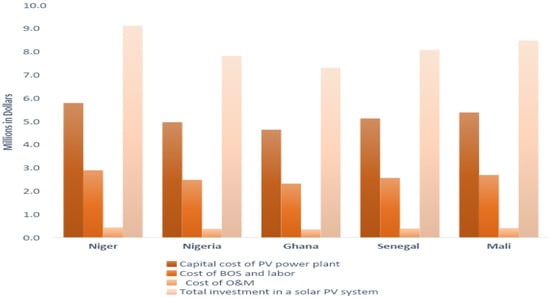
Figure 8.
Total capital cost of renewable electricity source plant systems for selected countries.
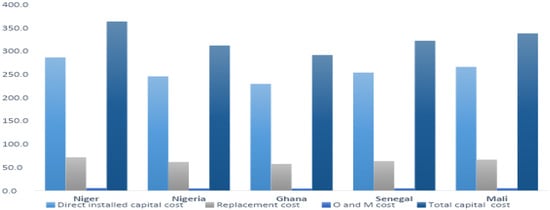
Figure 9.
The total capital cost of the water electrolyser plant system for the selected countries.
Both figures align with findings from [,,], who emphasise the capital-intensive nature of green hydrogen development in emerging economies, advocating for public–private partnerships and international financing mechanisms. Contrasting perspectives, such as those from [,,,], suggest that high CAPEX may deter large-scale hydrogen adoption without substantial government subsidies and regulatory incentives.
The regional solar energy potential plays a crucial role in hydrogen production efficiency. Niger, Senegal, and Mali demonstrate the highest solar energy potential due to their geographic positioning within the Sahara Desert zone, with Niger receiving a peak monthly solar irradiation of 135.3 kWh/m2/day. These findings align with the Nigerien Energy Council’s 2026 target to achieve 5% solar energy penetration.
A comparative economic analysis of green hydrogen production in the selected West African countries of Niger, Mali, Senegal, Nigeria, and Ghana (presented in Figure 10) reveals significant disparities in financial feasibility, solar resource availability, and investment potential. Based on the financial parameters analysed using an Excel-based economic model, the Net Present Value (NPV) and Simple Payback Period (SPP) indicate that Niger presents the shortest payback period of 7.3 years, followed by Mali (7.5 years) and Senegal (7.8 years), while Nigeria and Ghana report the longest recovery times at 8.1 years and 8.7 years, respectively. The Levelised Capital Cost (LCC) of PV electricity further highlights regional cost variations, where Ghana holds the lowest LCC at 20.40 USD/kWh, followed by Nigeria (22.40 $/kWh) and Senegal (23.30 USD/kWh), while Niger (26.04 USD/kWh) and Mali (24.68 USD/kWh) report the highest costs [,], confirming that LCC and NPV serve as fundamental economic metrics in assessing PV-based projects, reinforcing the findings of this study. Opposing views [,,,] agree that LCC is a critical indicator. However, these studies [,,] argue that variations in operational and maintenance costs, system degradation, and local energy tariffs must be incorporated to make the analysis more holistic. Despite infrastructural and economic challenges, all selected countries exhibit substantial green hydrogen production potential, indicating a promising pathway for decarbonising the energy sector in West Africa while improving environmental sustainability and socio-economic conditions.
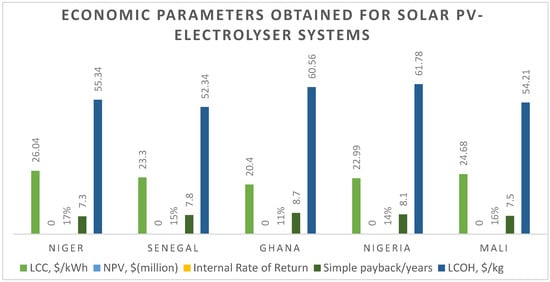
Figure 10.
Economic parameters obtained for solar PV–electrolyser systems and the levelised cost of producing hydrogen by electrolysis.
4.2. Policy Implication of Results—The Case of Ghana
Given that Ghana has the lowest LCC from our simulation, we now present a few policy implications of our results for Ghana [,,]. The discussion could also form the basis for understanding the results of other countries in the region [,]. In our study, Ghana’s position as the country with the lowest Levelised Cost of Hydrogen (LCC) presents opportunities for both domestic and regional energy markets []. For the ECOWAS electricity market, Ghana’s cost-competitive green hydrogen could potentially enhance regional energy trade [], stabilise grids through hydrogen storage [], and attract cross-border infrastructure investments []. The strong link between renewable energy prices and hydrogen costs suggests that Ghana and other solar-rich West African countries may potentially have a competitive edge [,]. Despite such prospects, regional policies should harmonise pricing mechanisms []. While higher hydrogen production could increase short-term electricity demand [,], potentially impacting domestic prices, it offers long-term benefits such as stabilised energy costs [,,] and cheaper hydrogen-based power for neighbouring countries []. Ghana can become a competitor in hydrogen-based power, given the fact that it can trade this source of energy at lower rates compared to other counterparts, and this will result in a potential increase in economic growth and development, increase foreign earnings, which will further boost a favourable balance of payment. In the long run, more expansion and investment in this energy source could result in a healthy climate and poverty reduction.
At the continental level, Ghana’s hydrogen potential could accelerate Africa’s energy transition by attracting foreign investment [], supporting climate commitments [], and serving as a model for green hydrogen adoption [,,,,,]. To capitalise on this potential, Ghana could (i) integrate hydrogen into national energy policies [,], (ii) establish clear regulatory frameworks, and (iii) foster public–private partnerships for infrastructure development []. These steps will directly inform Ghana’s upcoming Hydrogen Roadmap, which should prioritise solar-based electrolysis [] and investment in storage and transport infrastructure [], as well as position the country as a regional hydrogen hub [,,,].
Meanwhile, tariff challenges [], global hydrogen demand [], solar supply chain disruptions, and carbon border taxes [] could impact progress, necessitating localised solar manufacturing and strategic trade alliances []. Ghana’s low LCC underscores its potential to lead West Africa’s hydrogen economy, provided policymakers align national strategies with regional interests [,], leverage global market opportunities [,], and mitigate risks []. By doing so, Ghana can drive sustainable growth while setting a benchmark for the continent’s green hydrogen transition [,].
4.3. Policy Implication of Results—The Case of Nigeria
Given that Nigeria has a low Levelised Cost of Hydrogen (LCC) of 22.40 USD/kWh, which follows Ghana’s figure of 20.40 USD/kWh closely [,], one can safely say that the opportunities for both domestic and regional energy markets are numerous, ranging from domestic production and supply to help improve the epileptic condition of electricity currently faced by the country to regional production and sales which will serve as a source of foreign exchange for the economy [,].
The southern states of the country that experience high rainfall during the rainy season will serve as a good place of investment for hydropower, while the northern states that experience fierce solar irradiation will serve as a good source of solar energy. Investment can be made in these areas to store excess energy during the dry season with longer sunshine. The energy stored in these areas can then be traded in other regions and even neighbouring countries that do not have this comparative advantage. The country’s grid instability is a potential hindrance to smooth energy transition, and the high investment cost associated with green hydrogen poses a challenge to this energy transition [,].
This study recommends public–private partnerships and international collaboration to overcome the challenge of high-cost investment. The synergy of both groups will help improve the process and reduce the burden on one party. The government can also implement some policy regulations that will help boost investors’ confidence. The government should upgrade the national grid to meet modern technology standards and the present generating capacity of the country [,].
5. Conclusions
West African countries are facing different dimensions of energy poverty. This study focused on the prospects of a solution—hydrogen from sunlight, a common renewable resource in the region. The recommendations made follow from the specific country discussions, and a similar approach could be applied to other West African countries. Additionally, this research avoids the trap of making hasty generalisations due to differences in the energy contexts of the countries studied. The objectives of the study have been achieved so far.
First, this study highlights the advantages and limitations of green hydrogen production across selected West African nations such as Nigeria, Niger, Ghana, Mali, and Senegal. Key benefits include abundant renewable energy resources, particularly solar and wind, which make these countries suitable for large-scale green hydrogen projects. The study finds that Ghana and Senegal have relatively advanced renewable energy policies and infrastructure, making them attractive for investment and technological adoption. Despite its large energy market, Nigeria faces grid stability challenges and a heavy reliance on fossil fuels, which may hinder a seamless transition to hydrogen energy. On the other hand, Niger and Mali, while having significant solar potential, struggle with limited infrastructure and financing mechanisms, making large-scale green hydrogen projects challenging to implement.
Furthermore, other challenges this work identified include high capital investment costs, inadequate storage and transportation infrastructure, and regulatory uncertainties that may deter investors. The availability of technology is also uneven, with some countries lacking access to efficient electrolysis systems. Meanwhile, opportunities exist through international collaborations, policy incentives, and private sector involvement to bridge these gaps. Ultimately, this study suggests that targeted policy frameworks, financing mechanisms, and technological advancements will be crucial in ensuring the future feasibility study and long-term sustainability of green hydrogen energy in these nations. Going forwards it will be necessary to quantify seasonal differences and model the hybrid of wave and solar energies. Such approaches would strengthen the arguments proposed here and will help to prioritise hybrid system adoption.
Author Contributions
K.G.: Conceptualisation, Methodology, Data curation, Formal analysis, Software, Writing—original draft, Writing—review and editing. O.G.: Conceptualisation, Methodology, Supervision, Writing—review and editing. J.K.A.: Data curation, Writing—review and editing. S.A.: Data curation, Writing—review and editing. All authors have read and agreed to the published version of the manuscript.
Funding
This research received no external funding. The APC was funded by the Covenant University Centre for Research, Innovation and Discovery (CUCRID).
Data Availability Statement
Data will be made available by the authors upon request.
Acknowledgments
The researchers thank the Institute for Oil and Gas Studies, the University of Cape Coast, and Covenant University Centre for Research, Innovation and Discovery (CUCRID) for their support.
Conflicts of Interest
The authors declare no conflicts of interest.
Abbreviations
The following abbreviations are used in this manuscript:
| UN | United Nations |
| SDGs | Sustainable Development Goals |
| LCOH | Levelised Cost of Hydrogen |
| NPV | Net Present Value |
| EU | European Union |
| CBAM | Carbon Border Adjustment Mechanism |
| H2 | Hydrogen |
| O2 | Oxygen |
| kWh/m2/year | Kilowatt hours per square meter per year |
| PV | Photovoltaic |
| WAPP | West African Power Pool |
| GIS | Geographic Information System |
| MCDM | Multi-Criteria Decision-Making |
| ECOWAS | Economic Community of West African States |
| IRENA | International Renewable Energy Agency |
| IEA | International Energy Agency |
| GHI | Global Horizontal Irradiation |
| GWh | Gigawatt Hour |
| MWh | Megawatt Hour |
| kWh/kg | Kilowatt Hour per Kilogram |
| Kg/year | Kilogram per Year |
| SPT | Simple Payback Time |
| LCC | Levelised Capital Cost |
| SPP | Simple Payback Period |
| CAPEX | Total Capital Expenditure |
References
- Bhandari, R. Green hydrogen production potential in West Africa—Case of Niger. Renew. Energy 2022, 196, 800–811. [Google Scholar] [CrossRef]
- International Renewable Energy Agency. Global Hydrogen Trade Part 1. 2022. Available online: https://www.irena.org/publications/2022/Jul/Global-Hydrogen-Trade-Outlook (accessed on 28 July 2023).
- Dincer, I.; Acar, C. Review and evaluation of hydrogen production methods for better sustainability. Int. J. Hydrogen Energy 2014, 40, 11094–11111. [Google Scholar] [CrossRef]
- Joshi, A.S.; Dincer, I.; Reddy, B.V. Solar hydrogen production: A comparative performance assessment. Int. J. Hydrogen Energy 2011, 36, 11246–11257. [Google Scholar] [CrossRef]
- Sawadogo, M.; Bliefernicht, J.; Fersch, B.; Salack, S.; Guug, S.; Diallo, B.; Ogunjobi, K.O.; Nakoulma, G.; Tanu, M.; Meilinger, S.; et al. Hourly global horizontal irradiance over West Africa: A case study of one-year satellite- and reanalysis-derived estimates vs. in situ measurements. Renew. Energy 2023, 216, 119066. [Google Scholar] [CrossRef]
- Sawadogo, W.; Fersch, B.; Bliefernicht, J.; Meilinger, S.; Rummler, T.; Salack, S.; Guug, S.; Kunstmann, H. Evaluation of the WRF-solar model for 72-hour ahead forecasts of global horizontal irradiance in West Africa: A case study for Ghana. Sol. Energy 2024, 271, 112413. [Google Scholar] [CrossRef]
- International Energy Agency. World Energy Outlook. 2021. Available online: https://www.iea.org/reports/world-energy-outlook-2021 (accessed on 3 September 2023).
- Ouedraogo, N.S. Opportunities, barriers, and issues with renewable energy development in Africa: A comprehensible review. Curr. Sustain./Renew. Energy Rep. 2019, 6, 52–60. [Google Scholar] [CrossRef]
- Mukelabai, M.D.; Wijayantha, U.K.G.; Blanchard, R.E. Renewable hydrogen economy outlook in Africa. Renew. Sustain. Energy Rev. 2022, 167, 112705. [Google Scholar] [CrossRef]
- Mukelabai, M.D.; Wijayantha, U.K.G.; Blanchard, R.E. Hydrogen technology adoption analysis in Africa using a Doughnut-PESTLE hydrogen model (DPHM). Int. J. Hydrogen Energy. 2022, 47, 31521–31540. [Google Scholar] [CrossRef]
- International Energy Agency. Net Zero by 2050: A Roadmap for the Global Energy Sector. 2021. Available online: https://www.iea.org/reports/net-zero-by-2050 (accessed on 27 July 2023).
- International Renewable Energy Agency. Renewable Energy Market Analysis: Africa. 2022. Available online: https://www.irena.org/publications/2022/Jan/Renewable-Energy-Market-Analysis-Africa (accessed on 3 September 2023).
- Agyekum, E.B.; Nutakor, C.; Agwa, A.M.; Kamel, S. A critical review of renewable hydrogen production methods: Factors affecting their scale-up and its role in future energy generation. Membranes 2022, 12, 173. [Google Scholar] [CrossRef]
- Bazilian, M.; Nussbaumer, P.; Rogner, H.H.; Brew-Hammond, A.; Foster, V.; Pachauri, S.; Williams, E.; Howells, M.; Niyongabo, P.; Musaba, L.; et al. Energy access scenarios to 2030 for the power sector in sub-Saharan Africa. Util. Policy 2012, 20, 1–16. [Google Scholar] [CrossRef]
- Zhang, B.; Zhang, S.X.; Yao, R.; Wu, Y.H.; Qiu, J.S. Progress and prospects of hydrogen production: Opportunities and challenges. J. Electron. Sci. Technol. 2021, 19, 100080. [Google Scholar] [CrossRef]
- Gershon, O.; Asafo, J.K.; Nyarko-Asomani, A.; Koranteng, E.F. Investigating the nexus of energy consumption, economic growth and carbon emissions in selected African countries. Energy Strategy Rev. 2024, 51, 101269. [Google Scholar] [CrossRef]
- Gershon, O.; Asafo, J.K.; Sowah, J.N.; Tanko, F. Persistence of emissions in selected African countries: Energy consumption and population growth dynamics. Energy Strategy Rev. 2025, 57, 101628. [Google Scholar] [CrossRef]
- Al-Qahtani, A.; Parkinson, B.; Hellgardt, K.; Shah, N.; Guillén-Gosálbez, G. Uncovering the true cost of hydrogen production routes using life cycle monetisation. Appl. Energy 2021, 281, 115958. [Google Scholar] [CrossRef]
- Yates, J.; Patterson, R.; Egan, R.; Amal, R.; Chang, N.L. Techno-economic analysis of hydrogen electrolysis from off-grid stand-alone photovoltaics incorporating uncertainty analysis. Cell Rep. Phys. Sci. 2020, 1, 100209. [Google Scholar] [CrossRef]
- Kassem, Y. Solar energy potential and feasibility study of a 10MW grid-connected solar plant in Libya. Int. J. Renew. Energy Res. 2020, 10, 5358–5366. [Google Scholar] [CrossRef]
- Bhayo, B.A.; Al-Kayiem, H.H.; Gilani, S.I.U.; Ismail, F.B. Power management optimisation of hybrid solar photovoltaic-battery integrated with pumped-hydro-storage system for standalone electricity generation. Energy Convers. Manag. 2020, 215, 112942. [Google Scholar] [CrossRef]
- African Development Bank. Annual Report and Financial Report 2020. 2020. Available online: https://www.afdb.org/en/annual-report-and-financial-report-2020 (accessed on 24 March 2023).
- Adedoyin, F.F.; Ozturk, I.; Agboola, M.O.; Agboola, P.O.; Bekun, F.V. The implications of renewable and non-renewable energy generating in Sub-Saharan Africa: The role of economic policy uncertainties. Energy Policy 2021, 150, 112115. [Google Scholar] [CrossRef]
- Mohammed, Y.S.; Mustafa, M.W.; Bashir, N. Status of renewable energy consumption and developmental challenges in Sub-Sahara Africa. Renew. Sustain. Energy Rev. 2013, 27, 453–463. [Google Scholar] [CrossRef]
- Aboagye, B.; Gyamfi, S.; Ofosu, E.A.; Djordjevic, S. Status of renewable energy resources for electricity supply in Ghana. Sci. Afr. 2021, 11, e00660. [Google Scholar] [CrossRef]
- Löhr, K.; Tadesse, S.; Yazdanpanah, M.; Sieber, S.; Komendantova, N. Just energy transition: Learning from the past for a more just and sustainable hydrogen transition in West Africa. Sustainability 2022, 14, 1234. [Google Scholar] [CrossRef]
- Gouareh, A.; Settou, B.; Settou, N. A new geographical information system approach based on best worst method and analytic hierarchy process for site suitability and technical potential evaluation for large-scale CSP on-grid plant: An application for Algeria territory. Energy Convers. Manag. 2018, 235, 113963. [Google Scholar] [CrossRef]
- Mentis, D.; Hermann, S.; Howells, M.; Welsch, M.; Siyal, S.H. Assessing the technical wind energy potential in Africa: A GIS-based approach. Renew. Energy 2015, 83, 110–125. [Google Scholar] [CrossRef]
- Mohamed, A.; Abdi-Basid, A.; Omar, D.; Mohamed, J.; Moussa, A.; Ismael, G. Economic feasibility of green hydrogen production by water. Energies 2022, 15, 138. [Google Scholar] [CrossRef]
- Koponen, J.; Kosonen, A.; Huoman, K.; Ahola, J.; Ahonen, T.; Ruuskanen, V. Specific energy consumption of PEM water electrolysers in atmospheric and pressurised conditions. In Proceedings of the 2016 18th European Conference on Power Electronics and Applications (EPE’16 ECCE Europe), Karlsruhe, Germany, 5–9 September 2016. [Google Scholar] [CrossRef]
- Akpahou, R.; Odoi-Yorke, F.; Osei, L.K. Techno-economic analysis of a utility-scale grid-tied solar photovoltaic system in Benin Republic. Clean. Eng. Technol. 2023, 13, 100633. [Google Scholar] [CrossRef]
- Ballo, A.; Valentin, K.K.; Korgo, B.; Ogunjobi, K.O.; Agbo, S.N.; Kone, D.; Savadogo, M. Law and policy review on green hydrogen potential in ECOWAS countries. Energies 2022, 15, 2304. [Google Scholar] [CrossRef]
- Boudries, R.; Dizene, R. Prospects of solar hydrogen production in the Adrar region. Renew. Energy 2011, 36, 2872–2877. [Google Scholar] [CrossRef]
- Falchetta, G.; Dagnachew, A.G.; Hof, A.F.; Milne, D.J. The role of regulatory, market and governance risk for electricity access investment in sub-Saharan Africa. Energy Sustain. Dev. 2021, 62, 136–150. [Google Scholar] [CrossRef]
- Hamukoshi, S.S.; Mama, N.; Shimanda, P.P.; Shafudah, N.H. An overview of the socio-economic impacts of the green hydrogen value chain in Southern Africa. J. Energy S. Afr. 2022, 33, 12–21. [Google Scholar] [CrossRef]
- Rahmouni, S.; Settou, N.; Negrou, B.; Gouareh, A. GIS-based method for future prospect of hydrogen demand in the Algerian road transport sector. Int. J. Hydrogen Energy 2016, 41, 2128–2143. [Google Scholar] [CrossRef]
- International Energy Agency. World Energy Outlook. 2019. Available online: https://www.iea.org/reports/world-energy-outlook-2019 (accessed on 3 September 2023).
- International Renewable Energy Agency. Renewable Energy Statistics 2020. 2020. Available online: https://www.irena.org/publications/2020/Jul/Renewable-energy-statistics-2020 (accessed on 3 September 2023).
- International Renewable Energy Agency. Renewable Energy Market Analysis. 2018. Available online: https://www.irena.org/Energy-Transition/Policy/Regional-Market-Analysis (accessed on 3 September 2023).
- Ouedraogo, N.S. Modeling sustainable long-term electricity supply-demand in Africa. Appl. Energy 2017, 190, 1047–1067. [Google Scholar] [CrossRef]
- Fatima, R.; Iqrar, H.S.; Saira, K. Fourth-generation solar cells: A review. Energy Adv. 2023, 2, 1239–1262. [Google Scholar] [CrossRef]
- Gouareh, A.; Settou, N.; Khalfi, A.; Recioui, B.; Negrou, B.; Rahmouni, S.; Dokkar, B. GIS-based analysis of hydrogen production from geothermal electricity using CO2 as working fluid in Algeria. Int. J. Hydrogen Energy 2015, 40, 15244–15253. [Google Scholar] [CrossRef]
- Green Hydrogen in Developing Countries. World Bank. 2020. Available online: https://www.worldbank.org (accessed on 2 April 2023).
- Ankrah, I.; Lin, B. Renewable energy development in Ghana: Beyond potentials and commitment. Energy 2020, 198, 117356. [Google Scholar] [CrossRef]
- Ayodele, T.; Munda, J. Potential and economic viability of green hydrogen production by water electrolysis using wind energy resources in South Africa. Int. J. Hydrogen Energy 2019, 44, 17669–17687. [Google Scholar] [CrossRef]
- Sarker, A.K.; Azad, A.K.; Rasul, M.G.; Doppalapudi, A.T. Prospect of green hydrogen generation from hybrid renewable energy sources: A review. Energies 2023, 16, 1556. [Google Scholar] [CrossRef]
- Schulte, S.; Moritz, M.; Sch, M. Estimating global production and supply costs for green Hydrogen and hydrogen-based green energy commodities. Int. J. Hydrogen Energy 2022, 48, 4567–4585. [Google Scholar] [CrossRef]
- Dincer, I.; Colpan, C.O.; Ezan, M.A.; Kizilkan, O. Progress in Clean Energy, Volume 2: Novel Systems and Applications; Springer: Berlin/Heidelberg, Germany, 2015. [Google Scholar] [CrossRef]
- Oyedepo, S.O.; Anifowose, E.G.; Obembe, E.O.; Dirisu, J.O.; Khanmohamadi, S.; Kilanko, O.; Babalola, P.O.; Ohunakin, O.S.; Leramo, R.O.; Olawole, O.C. Assessment of economic and environmental impacts of energy conservation strategies in a university campus. In Green Energy: Solar Energy, Photovoltaics, and Smart Cities; Wiley: Hoboken, NJ, USA, 2020; pp. 441–468. [Google Scholar] [CrossRef]
- Pascaris, A.S.; Schelly, C.; Burnham, L.; Pearce, J.M. Integrating solar energy with agriculture: Industry perspectives on the market, community, and socio-political dimensions of agrivoltaics. Energy Res. Social. Sci. 2021, 75, 102023. [Google Scholar] [CrossRef]
- Mukelabai, M.D.; Wijayantha, K.G.U.; Blanchard, R.E. Hydrogen for Cooking: A Review of Cooking Technologies, Renewable Hydrogen Systems and Techno-Economics. Sustainability 2022, 14, 16964. [Google Scholar] [CrossRef]
- Rahmouni, S.; Negrou, B.; Settou, N.; Dominguez, J.; Gouareh, A. Prospects of hydrogen production potential from renewable resources in Algeria. Int. J. Hydrogen Energy 2017, 42, 1383–1395. [Google Scholar] [CrossRef]
- Abouseada, N.; Hatem, T.M. Climate action: Prospects of green Hydrogen in Africa. Energy Rep. 2022, 8, 3873–3890. [Google Scholar] [CrossRef]
- Agyekum, E.B. Energy poverty in energy rich Ghana: A SWOT analytical approach for the development of Ghana’s renewable energy. Sustain. Energy Technol. Assess. 2020, 40, 100760. [Google Scholar] [CrossRef]
- Bain, R.; Cronk, R.; Wright, J.; Yang, H.; Slaymaker, T.; Bartram, J. Fecal contamination of drinking-water in low- and middle-income countries: A systematic review and meta-analysis. PLoS Med. 2014, 11, 1644. [Google Scholar] [CrossRef]
- Sambo, A.S. Renewable energy development in Africa: Issues, challenges, and prospects. Renew. Energy Sustain. 2020, II, 257–264. [Google Scholar] [CrossRef]
- Lens, I. Insights lens: Electrify green hydrogen production in the energy ecosystem across Sub-Saharan Africa. Energy Insights 2021, 1, 1–7. [Google Scholar]
- Lewis, L.A. Attracting Foreign Investments for Green Energy Projects in Sub-Saharan Africa: Climate Change Policy & Innovation in International Legal Compliance. Ph.D. Thesis, Osgoode Hall Law School of York University, Toronto, Ontario, Canada, May 2019. Available online: https://digitalcommons.osgoode.yorku.ca/phd/55 (accessed on 2 April 2024).
- Müller, L.A.; Leonard, A.; Trotter, P.A.; Hirmer, S. Green hydrogen production and use in low- and middle-income countries: A least-cost geospatial modelling approach applied to Kenya. Appl. Energy 2023, 343, 121219. [Google Scholar] [CrossRef]
- Nefedova, L.; Degtyarev, K.; Kiseleva, S.; Berezkin, M. Prospects for green hydrogen production in the regions of Russia. E3S Web Conf. 2021, 244, 04011. [Google Scholar] [CrossRef]
- Negrou, B.; Settou, N.; Chennouf, N.; Dokkar, B. Valuation and development of the solar hydrogen production. Int. J. Hydrogen Energy 2011, 36, 4110–4116. [Google Scholar] [CrossRef]
- Dagnachew, A.G.; Lucas, P.L.; Hof, A.F.; van Vuuren, D.P. Trade-offs and synergies between universal electricity access and climate change mitigation in Sub-Saharan Africa. Energy Policy 2018, 114, 355–366. [Google Scholar] [CrossRef]
- Thomas, Å.H. A Green Recovery in Norway: Contradictory Energy Policy Responses in Times of Crises. Master’s Thesis, Norwegian University of Life Sciences, Ås, Norway, 2022. Available online: https://hdl.handle.net/11250/3012363 (accessed on 2 April 2024).
- Dagdougui, H.; Ouammi, A.; Sacile, R. A regional decision support system for onsite renewable hydrogen production from solar and wind energy sources. Int. J. Hydrogen Energy 2011, 36, 14324–14334. [Google Scholar] [CrossRef]
- Dagnachew, A.G.; Lucas, P.L.; Hof, A.F.; Gernaat, D.E.H.J.; de Boer, H.S.; van Vuuren, D.P. The role of decentralised systems in providing universal electricity access in Sub-Saharan Africa—A model-based approach. Energy 2017, 139, 184–195. [Google Scholar] [CrossRef]
- Danoune, M.B.; Djafour, A.; Hasnaoui, A.; Hamouda, M.; Degla, A.; Gougui, A. Potential and economic viability of green hydrogen production by water electrolysis using solar energy in Oran, Algeria. In Proceedings of the Second International Conference on Energy Transition and Security (ICETS), Adrar, Algeria, 12–14 December 2023. [Google Scholar]
- Domínguez, S.; Cifuentes, B.; Bustamante, F.; Cantillo, N.M.; Barraza-Botet, C.L.; Cobo, M. On the potential of blue hydrogen production in Colombia: A fossil resource-based assessment for low-emission Hydrogen. Sustainability 2022, 14, 11436. [Google Scholar] [CrossRef]
- Opeyemi, A.; Uchenna, E.; Simplice, A.; Evans, O. Renewable energy, trade performance and the conditional role of finance and institutional capacity in sub-Sahara African countries. Energy Policy 2019, 132, 490–498. [Google Scholar] [CrossRef]
- World Energy & Special. Africa Energy Outlook 2019. Available online: https://iea.blob.core.windows.net/assets/2f7b6170-d616-4dd7-a7ca-a65a3a332fc1/Africa_Energy_Outlook_2019.pdf (accessed on 27 July 2023).
- Esteves, N.B.; Sigal, A.; Leiva, E.P.M.; Rodríguez, C.R.; Cavalcante, F.S.A.; De Lima, L.C. Wind and solar Hydrogen for the potential production of ammonia in the state of Ceará—Brazil. Int. J. Hydrogen Energy 2015, 40, 9917–9923. [Google Scholar] [CrossRef]
- Howarth, R.W.; Jacobson, M.Z. How green is blue Hydrogen? Energy Sci. Eng. 2021, 9, 1676–1687. [Google Scholar] [CrossRef]
- Hytron, N. Clean PEM electrolysis Nea and Hytron-hypem modularised turnkey solutions. Hytron Solut. 2022. Available online: https://hyfindr.com/en/shop/products/neahytron-hypem-electrolyzer (accessed on 7 June 2024).
- Kar, S.K. Overview of hydrogen economy in Australia. Wiley Interdiscip. Rev. Energy Environ. 2022, 11, 1–27. [Google Scholar] [CrossRef]
- Kazemi Asfeh, I.; Kalantar Feeoj, R.; Alavi Eshkaftaki, S.M.; Jahangiri, M.; Yadav, B.K. Enhancing solar energy output for green hydrogen production: A comparative study on bifacial solar panels in Nepalese cities at household-scale. Int. J. Ambient. Energy. 2024, 45, 2424926. [Google Scholar] [CrossRef]
- Mahmah, B.; Harouadi, F.; Benmoussa, H.; Chader, S.; Belhamel, M.; M’Raoui, A.; Abdeladim, K.; Cherigui, A.N.; Etievant, C. MedHySol: Future federator project of massive production of solar Hydrogen. Int. J. Hydrogen Energy 2009, 34, 4922–4933. [Google Scholar] [CrossRef]
- Milbrandt, A.; Mann, M. Hydrogen Resource Assessment: Hydrogen Potential from Coal, Natural Gas, Nuclear, and Hydro Power, National Renewable Energy Laboratory (NREL) 2009. Available online: https://www.nrel.gov/docs/fy20osti/77198.pdf (accessed on 3 September 2023).
- Monforti-Ferrario, F.; Huld, T.; Bódis, K. A methodology for optimisation of the complementarity between small-hydropower plants and solar PV systems. Renew. Energy 2015, 83, 1–8. [Google Scholar] [CrossRef]
- Ishaq, H.; Dincer, I.; Crawford, C. A review on hydrogen production and utilisation: Challenges and opportunities. Int. J. Hydrogen Energy 2022, 47, 26238–26264. [Google Scholar] [CrossRef]
- Hydrogen: How to Meet the Safety Challenges. Africa Energy Portal. 2020. Available online: https://africa-energy-portal.org/region/west-africa (accessed on 27 July 2023).
- Kalbasi, R.; Jahangiri, M.; Tahmasebi, A. Comprehensive investigation of solar-based hydrogen and electricity production in Iran. Int. J. Photoenergy 2021, 2021, 6627491. [Google Scholar] [CrossRef]
- Zapantis, A. Blue Hydrogen. Global CCS Institute. 2021. Available online: https://www.globalccsinstitute.com/wp-content/uploads/2021/04/Circular-Carbon-Economy-series-Blue-Hydrogen.pdf?_hsenc=p2ANqtz--AwkgGZWjKjPhf8RKMiO1u-yuzGep3phHFwxXmdJfukEwEIay7saeWJ0X7qY0HCSjgjtMq (accessed on 3 September 2023).
- Bourne, S. The future of fuel: The future of Hydrogen. Fuel Cells Bull. 2012, 2012, 12–15. [Google Scholar] [CrossRef]
- World Bank. Annual Report for Supporting Developing World. 2020. Available online: https://documents.worldbank.org/en/publication/documents-reports/documentdetail/585151601566378168/ (accessed on 10 October 2023).
- World Bank. Global Photovoltaic Power Potential by Country. 2020. Available online: https://www.worldbank.org/en/topic/energy/publication/solar-photovoltaic-power-potential-by-country (accessed on 3 September 2023).
- International Energy Agency. IEA G20 Hydrogen Report: Revised Assumptions. The Future of Hydrogen. 2020. Available online: https://www.iea.org/reports/the-future-of-hydrogen (accessed on 21 May 2023).
- Bauer, C.; Treyer, K.; Antonini, C.; Bergerson, J.; Gazzani, M.; Gencer, E.; Gibbins, J.; Mazzotti, M.; McCoy, S.T.; McKenna, R.; et al. On the climate impacts of blue hydrogen production. Sustain. Energy Fuels 2022, 6, 66–75. [Google Scholar] [CrossRef]
- Cloete, S.; Ruhnau, O.; Hendrik, J.; Hirth, L. Blue Hydrogen and industrial base products: The future of fossil fuel exporters in a net-zero world. J. Clean. Prod. 2022, 363, 132347. [Google Scholar] [CrossRef]
- Cummins. Hydrogen: The Next Generation—Discover Cummins Electrolysers Technologies; Cummins: Columbus, IN, USA, 2021; pp. 1–20. [Google Scholar]
- World Bank. Annual Report for Supporting Developing World. 2018. Available online: https://documents.worldbank.org/en/publication/documents-reports/documentdetail/630671538158537244/the-world-bank-annual-report-2018 (accessed on 3 September 2023).
- Siew, C.; Cheng, W. The Prospects of Green and Blue Hydrogen Production in Norway for Energy Export. Master’s Thesis, University of Stavanger, Stavanger, Norway, 2022. [Google Scholar]
- Bennet, T.; Swetha, R.K.; Maria, O. Energy & Africa: Green Hydrogen Bridging the Energy Transition in Africa and Europe. Florence School of Regulation (FSR) for the Africa-EU Energy Partnership, 2020. Available online: https://fsr.eui.eu/publications/?handle=1814%2F68677&utm_source=chatgpt.com (accessed on 27 July 2023).
- Ugwoke, B.; Gershon, O.; Becchio, C.; Corgnati, S.P.; Leone, P. A review of Nigerian energy access studies: The story told so far. Renew. Sustain. Energy Rev. 2020. [Google Scholar] [CrossRef]
Disclaimer/Publisher’s Note: The statements, opinions and data contained in all publications are solely those of the individual author(s) and contributor(s) and not of MDPI and/or the editor(s). MDPI and/or the editor(s) disclaim responsibility for any injury to people or property resulting from any ideas, methods, instructions or products referred to in the content. |
© 2025 by the authors. Licensee MDPI, Basel, Switzerland. This article is an open access article distributed under the terms and conditions of the Creative Commons Attribution (CC BY) license (https://creativecommons.org/licenses/by/4.0/).