Abstract
The transition to the 4th Industrial Revolution (4IR) in the electroplating industry necessitates intelligent, real-time monitoring systems to replace traditional, time-consuming offline analysis. In this study, we developed a cost-effective, automated measurement system for hexavalent chromium (Cr(VI)) in plating wastewater using an Arduino-based RGB sensor. Unlike conventional single-variable approaches, we conducted a comprehensive feature sensitivity analysis on multi-sensor data (including pH, ORP, and EC). While electrochemical sensors were found to be susceptible to pH interference, the analysis identified that the Red and Green optical channels are the most critical indicators due to the distinct chromatic characteristics of Cr(VI). Specifically, the combination of these two channels effectively functions as a dual-variable sensing mechanism, compensating for potential interferences. To optimize prediction accuracy, a systematic machine learning strategy was employed. While the Convolutional Neural Network (CNN) achieved the highest classification accuracy of 89% for initial screening, a polynomial regression algorithm was ultimately implemented to model the non-linear relationship between sensor outputs and concentration. The derived regression model achieved an excellent determination coefficient (R2 = 0.997), effectively compensating for optical saturation effects at high concentrations. Furthermore, by integrating this sensing model with the chemical stoichiometry of the reduction process, the proposed system enables the precise, automated dosing of reducing agents. This capability facilitates the establishment of a “Digital Twin” for wastewater treatment, offering a practical ICT (Information and Communication Technology)-based solution for autonomous process control and strict environmental compliance.
1. Introduction
The electroplating industry plays a vital role in the manufacturing sector, with applications ranging from automotive to aerospace and electronic components. Chrome plating is one of the most widely used surface finishing techniques in this industry, owing to its unique properties of corrosion resistance, wear resistance, and esthetic appeal. However, this industrial process inevitably generates significant volumes of hazardous wastewater containing hexavalent chromium (Cr(VI)). Unlike the stable trivalent form (Cr(III)), Cr(VI) is highly mobile in the environment and poses severe health risks. Exposure to Cr(VI) is known to induce oxidative stress, cytotoxicity, and carcinogenesis in humans, necessitating strict monitoring and control technologies [1]. Recognizing these dangers, regulatory bodies worldwide have enforced stringent discharge limits. The World Health Organization and the U.S. Environmental Protection Agency have set maximum permissible limits for Cr(VI) in drinking water and industrial effluent at 0.05 mg/L and 0.1 mg/L, respectively [2,3].
Despite these strict regulations, accurate and timely monitoring of Cr(VI) remains a significant challenge. Traditionally, the determination of Cr(VI) concentration has relied on offline analytical methods such as spectrophotometry (e.g., Diphenylcarbazide method), atomic absorption spectroscopy, or titration. While these methods offer high precision, they are time-consuming, labor-intensive, and require expensive instrumentation and skilled operators. Crucially, they fail to provide real-time data, creating a “blind spot” between sampling and analysis. Moreover, these conventional methods can be prone to errors due to interference from other substances. For instance, in the case of spectrophotometry, co-existing metal ions in the wastewater can absorb light at similar wavelengths to Cr(VI), leading to false positives or negatives [4].
To address these limitations, the paradigm of wastewater management is shifting toward the 4th Industrial Revolution (4IR), characterized by the convergence of Information and Communication Technology (ICT) and environmental engineering. Recent advancements have introduced various sensing technologies for the rapid detection of Cr(VI), including fluorescent probes and point-of-care testing kits [5]. While these advancements mark significant progress in rapid detection, applying such technologies to continuous industrial processes necessitates robust systems capable of handling the complex matrix of plating effluents. To systematically approach this challenge, we first analyzed the characteristics of actual chromium plating wastewater reported in previous studies (Table 1). As summarized in Table 1, real wastewater typically exhibits a highly acidic environment (pH 1–3) and contains a complex matrix of co-existing ions such as Cr(III), Ni(II), Zn(II), and Fe, in addition to Cr(VI). This complexity renders simple single-variable sensors ineffective.

Table 1.
Reference of chromium plating wastewater.
In this study, we developed a cost-effective, real-time Cr(VI) monitoring system and validated its performance using synthetic wastewater designed to simulate these harsh conditions. Unlike conventional approaches, our system utilizes a multi-sensor array comprising pH, Oxidation-Reduction Potential (ORP), Electrical Conductivity (EC), and Red-Green-Blue color (RGB) sensors to comprehensively characterize the wastewater matrix. These sensors were integrated with an Arduino, and a machine learning model was developed based on the characteristic data obtained from the measurement system.
This approach aligns with the core philosophy of the 4th Industrial Revolution (4IR)—moving beyond passive monitoring toward active, data-driven process control. Unlike traditional end-of-pipe monitoring, which detects pollutants only after discharge, our system aims to establish a smart monitoring framework for wastewater systems. By converging Information and Communication Technology (ICT), our study aims to develop a customized wastewater treatment system that predicts influent characteristics in real-time. This allows for the optimization of the treatment process before the wastewater enters the reactor, ensuring stability and efficiency suitable for the 4IR era.
2. Experimental Methods
2.1. Chemicals and Reagents
All chemicals used in this study were of analytical grade and used without further purification. Potassium dichromate (K2Cr2O7, Junsei, Tokyo, Japan) was used to prepare the hexavalent chromium (Cr(VI)) stock solution. To simulate the complex matrix of plating wastewater containing co-existing ions, Chromium(III) chloride hexahydrate (CrCl3·6H2O, Sigma-Aldrich, St. Louis, MO, USA), Nickel(II) chloride hexahydrate (NiCl2·6H2O, Samchun, Pyeongtaek, Republic of Korea), and Sodium chloride (NaCl, duksan, Ansan, Republic of Korea) were employed. The pH of the synthetic plating wastewater was adjusted using 0.1 M hydrochloric acid (HCl) and 0.1 M sodium hydroxide (NaOH). The HCl solution was prepared from a 30% stock solution (Sigma-Aldrich, St. Louis, MO, USA), and the NaOH solution was prepared from solid pellets (Sigma-Aldrich, St. Louis, MO, USA). All aqueous solutions were prepared using deionized (DI) water.
2.2. Development of the Automation Measurement System
To construct a cost-effective and versatile monitoring unit, an Arduino Uno SMD R3 was integrated with five distinct sensors capable of characterizing the complex matrix of plating wastewater. The hardware configuration, as shown in Figure 1a, consists of sensors for pH (SEN0161-V2, DFRobot, Zhiwei Robotics Crop., Shanghai, China ), ORP (SEN0165, DFRobot, Zhiwei Robotics Crop., Shanghai, China), EC (DFR0300, DFRobot, Zhiwei Robotics Crop., Shanghai, China), temperature (KIT0021, DFRobot, Zhiwei Robotics Crop., Shanghai, China), and Red-Green-Blue color (RGB) (SEN0212, DFRobot, Zhiwei Robotics Crop., Shanghai, China). These sensors were connected to the Arduino board via an expansion shield to ensure stable data transmission and power distribution.

Figure 1.
Configuration of the developed real-time monitoring system. (a) Internal hardware connections of the Arduino and sensor modules, (b) Installation of sensors in the reactors ((left): light-shielded RGB (Red-Green-Blue color) sensor, (right): ORP (Oxidation-Reduction Potential), EC (Electrical Conductivity), pH, temperature sensors), and (c) Photograph of the entire continuous flow experimental setup including the Cr(VI) treatment process.
The sensors were installed in two cylindrical reactors, each with a volume of 500 mL, to simulate the continuous flow of wastewater (Figure 1b). A critical design feature was the installation of the RGB sensor. Since the RGB sensor (TCS34725) detects color based on light reflection and absorption, it is highly sensitive to ambient light interference. To eliminate this external noise and ensure that the sensor only responded to the chromatic properties of the wastewater (specifically the yellow hue of Cr(VI)), the reactor equipped with the RGB sensor was completely wrapped with black insulating tape for light shielding, as illustrated in Figure 1b. The integrated experimental setup, demonstrating the continuous flow from the influent reservoir through the sensor modules to the Cr(VI) treatment process, is visualized in Figure 1c.
For real-time data acquisition and monitoring, a custom Graphical User Interface (GUI) was developed using the standard Tkinter library in Python 3 (Available online: https://www.python.org, accessed on 15 January 2024), selected for its lightweight architecture and stability during long-term operation (Figure 2). This software communicates with the Arduino system via a serial port, receiving data packets at 1 s intervals. As shown in Figure 2, the dashboard visualizes the instantaneous values of Red, Green, Blue, pH, ORP, EC, and temperature (Temp.) in separate graphs, allowing operators to track fluctuations immediately. Simultaneously, all received data are time-stamped and automatically saved to a CSV file with structured headers (e.g., Data, Time, Red, Green, Blue, pH, ORP, EC, Temp.) for subsequent machine learning model training. This automated data logging system eliminates human error in manual recording and enables the accumulation of large-scale datasets essential for high-accuracy predictions.
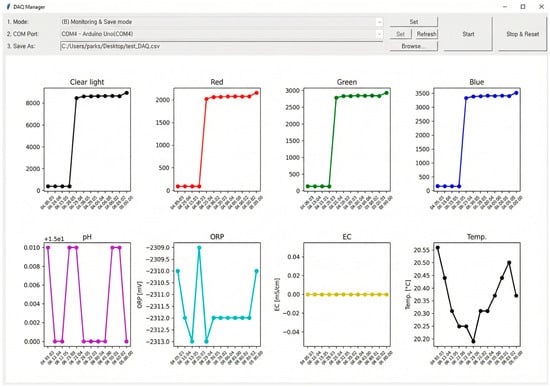
Figure 2.
Real-time monitoring GUI (Graphical User Interface) developed using Tkinter, displaying live data streams for RGB (Red-Green-Blue color), pH, ORP (Oxidation-Reduction Potential), EC (Electrical Conductivity), and Temperature. (note: This image is a direct screen capture from the monitoring software’s interface.)
2.3. Design of Experiments and Data Collection
To develop a robust machine learning algorithm capable of predicting Cr(VI) concentration under varying conditions, a comprehensive dataset covering the typical ranges of plating wastewater was required. We employed the Response Surface Methodology (RSM), specifically the Box–Behnken Design (BBD) [17], to design the experimental runs. The BBD was selected over a full factorial design because it allows for the estimation of quadratic effects and interactions between variables with a significantly reduced number of experimental runs, making it more efficient for this multi-variable study. Based on the actual wastewater characteristics analyzed in the introduction, five key input variables were selected: Cr(VI), Cr(III), Ni(II), NaCl, and pH. The experimental ranges for these factors were determined to cover the minimum, medium, and maximum levels observed in real industrial effluents, as detailed in Table 2.
Table 2.
Ranges of pH and concentration for the 5 factors.
A total of 46 synthetic wastewater samples were prepared according to the BBD matrix. Precise quantities of the stock solutions (containing Cr(VI), Cr(III), Ni(II), and NaCl) were mixed to achieve the target concentrations, and the pH was adjusted to the designated levels using the acid and base solutions described in Section 2.1. The prepared solutions were then flowed through the automated measurement system, where sensor outputs (ORP, EC, RGB, temperature) were continuously recorded. To evaluate the performance of various machine learning models, including Artificial Neural Network (ANN), Convolutional Neural Network (CNN), and Random Forest (RF), the dataset was partitioned into training (2999 points), testing (3234 points), and validation (750 points) sets.
3. Results and Discussion
3.1. Feature Sensitivity Analysis and Sensor Selection
Prior to developing the prediction algorithms, a feature sensitivity analysis was conducted on approximately 7000 data points to identify the most significant indicators among the independent variables (ORP, EC, Red, Green, Blue). The distribution of measured values for these variables corresponding to the specific Cr(VI) concentration levels (1.0, 2.5, and 4.0 mM) is visualized in Figure 3. In machine learning feature selection, a variable that maintains a wide/broad distribution (high variance) across all target classes is considered to carry high information density, whereas a variable with a narrow (low variance) or sporadic distribution provides little predictive value [18]. Given this criterion, a wider distribution of sensor values at each concentration level serves as an indicator of higher sensitivity, implying that the sensor responds dynamically to the presence of Cr(VI). As observed in Figure 3, the Red and Green variables exhibited a broad distribution across all three concentration levels (1.0, 2.5, and 4.0 mM). This dynamic response throughout the entire range suggests that these two variables possess a high correlation with the Cr(VI) concentration and can effectively capture its variations. In contrast, the other variables did not maintain a broad distribution across all levels. The Blue sensor showed a high distribution only at the 2.5 mM level, while ORP showed a high distribution only at the 1.0 mM level. The EC sensor displayed a very narrow distribution (low variance) across all levels, indicating it is barely influenced by the specific changes in Cr(VI) concentration in this experimental setup.
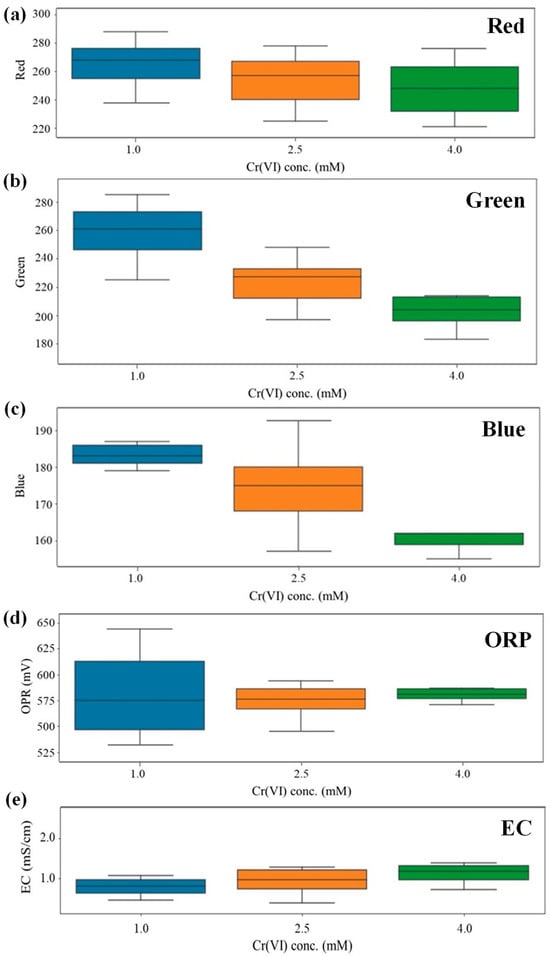
Figure 3.
Distribution of measured values from sensors corresponding to Cr(VI) concentration levels (1.0, 2.5, and 4.0 mM). (a) Red, (b) Green and (c) Blue values measured by the RGB (Red-Green-Blue color) sensor, (d) ORP (Oxidation-Reduction Potential) sensor, and (e) EC (Electrical Conductivity) sensor value. (Note that the Red and Green channels exhibit a broad distribution of measured values, indicating high sensitivity and active response, whereas the Blue channel, along with other sensors (ORP and EC) show narrow or restricted ranges).
To rigorously validate these visual observations and quantify the influence of interfering factors, a comprehensive analysis of variance (ANOVA) and correlation analysis were further conducted. The statistical results provided concrete evidence regarding the physical limitations of the excluded sensors within the complex wastewater matrix. Specifically, the electrochemical sensors (ORP and EC) were excluded due to the dominant interference of pH and a lack of selectivity. In the strongly acidic plating wastewater, the exceptionally high equivalent ionic conductance of hydrogen ions (H+) caused massive fluctuations in the EC readings. The analysis indicated that the influence of pH on the EC signal was approximately 210 times stronger (F-value ≈ 11,607) than that of Cr(VI), causing a “masking effect” where the conductivity signals generated by the target heavy metal were effectively buried. Similarly, the ORP sensor proved to be unsuitable as it showed no statistically significant correlation with Cr(VI) concentration (p = 0.2339). Instead, it was found to be significantly sensitive to interfering salinity changes (NaCl, p = 0.0231) and heavily skewed by pH variations, making it an unreliable indicator for chromium monitoring.
Among the optical sensors, the Blue channel was excluded as it failed to distinguish between Cr(VI) and Cr(III) due to significant spectral overlap. In contrast, the statistical analysis confirmed the complementary roles of the selected Red and Green channels. The correlation analysis revealed that the Red channel acts as an interference reference due to its high sensitivity to Cr(III) (r = −0.90) and relatively low sensitivity to Cr(VI) (r = −0.15). This unique property allows the system to compensate for noise in the Green channel, which functions as the primary detector responsive to total chromium concentration. Consequently, the combination of these two variables enables the machine learning model to accurately isolate the Cr(VI) signal even in the presence of co-existing ions.
The high correlation of the selected Red and Green variables is physically attributed to the characteristic color of Cr(VI). Cr(VI) solutions exhibit a vibrant yellow color. According to the additive color model of light (RGB model), the color yellow is produced by mixing Red and Green light [19]. Therefore, the statistical evidence aligns with the physical theory that the Red and Green sensors are the most sensitive to the yellow hue of the Cr(VI) wastewater, making them the most critical input variables for the machine learning model.
3.2. Comparative Analysis of Classification Models
To automate the detection process, three different machine learning classification models—ANN, RF, and CNN—were trained and evaluated using the prepared dataset [20,21]. The objective was to classify the wastewater into discrete concentration ranges to serve as a primary screening tool. The prediction accuracy for the test dataset was found to be 83% for ANN, 62% for RF, and 89% for CNN.
The Artificial Neural Network (ANN) is a multi-layer perceptron model consisting of input, hidden, and output layers connected by weights. While ANN is capable of mapping complex non-linear relationships between the sensor inputs (RGB) and Cr(VI) levels, it processes input features as independent vectors [22]. This fully connected architecture often leads to overfitting when dealing with raw sensor data containing noise, limiting its generalization performance (83%). The Random Forest (RF) model exhibited the lowest performance (62%). RF is an ensemble learning method based on decision trees that classifies data by creating orthogonal splits based on discrete thresholds. However, the colorimetric data of Cr(VI) wastewater exhibits smooth, continuous spectral gradations rather than distinct categorical boundaries. The rigid, step-wise decision boundaries of RF are inherently ineffective for capturing these subtle continuous variations, resulting in frequent misclassifications at the transition points between concentration ranges [23]. In contrast, the Convolutional Neural Network (CNN) achieved the highest accuracy of 89%. Unlike ANN and RF, CNNs utilize convolutional kernels (filters) to extract hierarchical features from the input data. Although CNNs are typically utilized for 2D image processing, they are highly effective for processing multi-channel sensor data. The convolutional layers act as feature extractors that capture local dependencies and inter-channel correlations (specifically the ratio changes between Red and Green) while effectively filtering out high-frequency sensor noise [24]. This structural advantage allows the CNN to learn the robust spectral signatures of Cr(VI) more accurately than the other models.
However, as highlighted by the red box in Figure 4, even the optimal CNN model exhibited significant discrepancies in certain concentration ranges. This suggests that while classification models are useful for broad categorization, they have fundamental limitations in predicting the precise continuous values required for fine-tuning chemical dosing in treatment processes.

Figure 4.
Result of CNN (Convolution Neural Network) modeling: 3234 row (test data) × 2 columns (real and predict). The red box in the figure indicates the intervals where there is a discrepancy between the real and predicted values.
3.3. Development of High-Precision Polynomial Regression Model
To overcome the resolution limitations of the classification models and achieve higher precision suitable for process control, a polynomial regression approach was adopted [25]. Based on the feature sensitivity analysis in Section 3.1, the Red and Green channels were selected as the primary independent variables. The polynomial regression analysis revealed that the quadratic terms of Red and Green had the highest explanatory power, with R2 values of 0.94 and 0.96, respectively. Figure 5 compares the predicted values from the quadratic equations with the actual measured values. As illustrated in Figure 5, the relationship between the predicted values derived from the quadratic equations and the actual measured values exhibits a high degree of linearity. This strong linear alignment serves as empirical evidence that the RGB sensor’s response characteristics are accurately described by a second-order polynomial function rather than a simple linear one. This underlying non-linear relationship is physically attributed to the saturation effect of the optical sensor, which typically occurs at high color intensities. Consequently, a simple linear model would fail to account for this saturation phenomenon, inevitably leading to an underestimation of Cr(VI) levels in high-concentration spill scenarios.
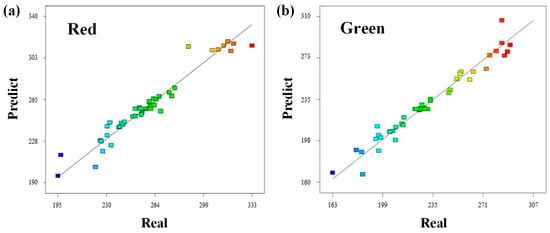
Figure 5.
Linear plot of predict and real values for quadratic equations derived from polynomial regression. (a) Red and (b) Green values measured by the RGB (Red-Green-Blue color) sensor.
Consequently, a multivariate quadratic regression model was derived to compute the influent Cr(VI) concentration directly from the Red and Green inputs. The interaction between these two color channels and the Cr(VI) concentration is visualized in the 3D response surface plot in Figure 6. The empirical equation derived from this model is expressed in Equation (1):
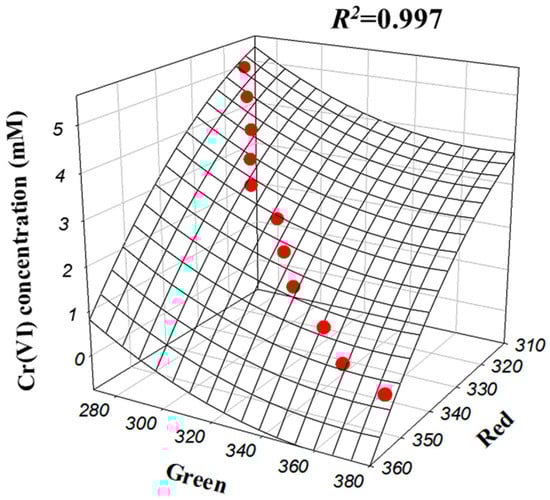
Figure 6.
Second-order polynomial regression model for influent Cr(VI) concentration depending on Red and Green of RGB (Red–Green–Blue color) sensor value.
In Equation (1), Red and Green represent the red and green values measured by the RGB sensor, respectively. This optimized multivariate model achieved an excellent determination coefficient (R2 = 0.997), demonstrating superior precision compared to individual variable models. To rigorously verify the model’s generalizability, the algorithm was tested against an independent validation set comprising 750 data points, yielding a Root Mean Square Error (RMSE) of 0.051 mM (1.28%). It is worth noting that this study adopted a comprehensive machine learning strategy by utilizing both classification algorithms (ANN, CNN, RF) for initial pattern recognition and regression algorithms for precise quantification. While the classification models validated the sensor’s ability to distinguish concentration ranges, the Polynomial Regression—a robust supervised learning algorithm—was ultimately selected to model the non-linear relationship for high-resolution monitoring [21]. Therefore, Equation (1) serves as the trained hypothesis function of this optimized regression model. Consequently, a real-time monitoring program was developed by embedding this machine learning-based model, enabling precise inference of Cr(VI) concentration based on live sensor data.
3.4. Feasibility for On-Site Application and 4IR Integration
The practical implementation of the developed machine learning model extends beyond monitoring to active process control. The proposed automated system offers significant advantages over traditional offline analysis methods in terms of cost, speed, and integration potential. While standard spectrophotometers or Inductively Coupled Plasma (ICP) analyses require expensive equipment and significant time delays for sample preparation, the Arduino-based RGB sensor system costs less than $100 and provides data every second. This real-time capability is crucial for the 4IR transformation of plating facilities. By installing this system at the influent line, the facility can establish a “Digital Twin” of the wastewater stream. The precise Cr(VI) concentration data computed by the polynomial regression model (Equation (1)) serves as the critical input for automating the chemical treatment process.
For instance, in the widely used chemical precipitation method, ferrous sulfate (FeSO4)is typically employed to reduce toxic Cr(VI) to less harmful Cr(III). This reduction reaction follows the stoichiometry described in Equation (2):
According to Equation (2), the reduction of 1 mole of dichromate requires exactly 6 moles of ferrous ions (Fe2+). By linking our sensor system to a Programmable Logic Controller (PLC), the exact mass of reducing agent required can be dynamically calculated using the real-time Cr(VI) concentration derived from Equation (1). This automated feedback loop prevents the discharge of untreated wastewater caused by under-dosing and eliminates the economic loss and excess sludge generation associated with over-dosing. Consequently, this integration enables the realization of an intelligent, self-optimizing wastewater treatment plant that meets both environmental regulations and economic efficiency.
4. Conclusions
In this study, a real-time automatic measurement system for Cr(VI) concentration in chrome plating wastewater was developed by integrating a low-cost RGB sensor with a robust machine learning algorithm. Unlike traditional single-variable sensors, a comprehensive feature sensitivity analysis and statistical validation were utilized, identifying that the Red and Green channels are the most critical indicators. This dual-channel selection was statistically proven to be robust against common interferences while effectively compensating for spectral overlap. A systematic machine learning strategy was employed to optimize the prediction model. While the highest classification accuracy (89%), suitable for initial screening, was demonstrated by the Convolutional Neural Network (CNN), limitations were observed in continuous value prediction. To address this, a polynomial regression algorithm—a supervised learning method—was implemented to model the non-linear relationship between sensor outputs and concentration. The derived empirical model achieved a high determination coefficient (R2 = 0.997), effectively compensating for the optical saturation effects observed at high concentrations. It should be noted that this study was conducted using synthetic wastewater to validate the fundamental algorithm and sensor performance in a controlled environment. However, to simulate the industrial matrix, the experimental design incorporated high concentrations of interfering ions (Ni(II), Cr(III), NaCl). The statistical results confirmed the system’s robustness against these co-existing factors, demonstrating that the selected sensors are unaffected by nickel and salinity variations. Since real industrial wastewater involves complex matrix effects such as turbidity and co-existing ions, future research will focus on applying the system to real-world samples and developing necessary pre-treatment protocols to ensure robustness in practical applications. The significance of this research extends beyond the development of a monitoring device to the realization of a smart process control system. By integrating the sensing model with the stoichiometry of the chemical reduction process, the system enables precise, automated dosing of reducing agents. This capability allows for the establishment of a “Digital Twin” of the wastewater treatment process, significantly reducing chemical waste and ensuring strict compliance with environmental regulations.
In conclusion, the proposed system offers a practical, cost-effective (under $100), and intelligent solution to replace expensive offline analysis methods. It stands as an innovative ICT model suitable for the 4IR, providing a technological foundation for autonomous environmental management in the electroplating industry.
Author Contributions
H.Y.: Conceptualization, Methodology, Writing—Original draft preparation. D.P.: Project administration, Resources, Writing—Review and Editing. All authors have read and agreed to the published version of the manuscript.
Funding
This research was supported by the Basic Science Research Program through the National Research Foundation of Korea (NRF) funded by the Ministry of Education (RS-2022-NR071006).
Institutional Review Board Statement
Not applicable.
Informed Consent Statement
Not applicable.
Data Availability Statement
The original contributions presented in this study are included in the article. Further inquiries can be directed to the corresponding author.
Conflicts of Interest
The authors declare that they have no known competing financial interests or personal relationships that could have appeared to influence the work reported in this paper.
References
- Royle, H. Toxicity of Chromic Acid in the Chromium Plating Industry (1). Environ. Res. 1975, 10, 39–53. [Google Scholar] [CrossRef] [PubMed]
- World Health Organization. Water Quality: Guidelines, Standards and Health; IWA Publishing: London, UK, 2001. [Google Scholar]
- Baral, A.; Engelken, R.D. Chromium-Based Regulations and Greening in Metal Finishing Industries in the USA. Environ. Sci. Policy 2002, 5, 121–133. [Google Scholar] [CrossRef]
- Dawra, N.; Dabas, N. Advances in Spectrophotometric Determination of Chromium(III) and Chromium(VI) in Water: A Review. Int. J. Environ. Anal. Chem. 2024, 104, 2994–3015. [Google Scholar] [CrossRef]
- Maruthupandi, M.; Lee, N.Y. Point-of-Care Testing Kit for the Detection of Hexavalent Chromium by Carbohydrazide-Derived Graphitic Carbon Nitride. Chemosensors 2024, 12, 180. [Google Scholar] [CrossRef]
- Cao, W.; Ao, H.; Wang, Z.; Zhou, Z.; Li, F.; Yuan, B. Cr(VI) Removal from Water by Fixed-Bed Column Filled with Modified Corn Stalk. Environ. Eng. Sci. 2019, 36, 1070–1078. [Google Scholar] [CrossRef]
- Badrelzaman, M.; Khamis, M.I.; Ibrahim, T.H.; Jumean, F.H. Scale-Up of Self-Regenerating Semi-Batch Adsorption Cycles through Concurrent Adsorption and Reduction of Cr(VI) on Sheep Wool. Processes 2020, 8, 1092. [Google Scholar] [CrossRef]
- Nam, A.; Choi, U.S.; Yun, S.-T.; Choi, J.-W.; Park, J.-A.; Lee, S.-H. Evaluation of Amine-Functionalized Acrylic Ion Exchange Fiber for Chromium(VI) Removal Using Flow-through Experiments Modeling and Real Wastewater. J. Ind. Eng. Chem. 2018, 66, 187–195. [Google Scholar] [CrossRef]
- Oden, M.K.; Sari-Erkan, H. Treatment of Metal Plating Wastewater Using Iron Electrode by Electrocoagulation Process: Optimization and Process Performance. Process Saf. Environ. Prot. 2018, 119, 207–217. [Google Scholar] [CrossRef]
- Zare, M.; Amin, M.M.; Nikaeen, M.; Bina, B.; Pourzamani, H.; Fatehizadeh, A.; Taheri, E. Resazurin Reduction Assay, a Useful Tool for Assessment of Heavy Metal Toxicity in Acidic Conditions. Environ. Monit. Assess. 2015, 187, 276. [Google Scholar] [CrossRef]
- Venkateswaran, P.; Palanivelu, K. Studies on Recovery of Hexavalent Chromium from Plating Wastewater by Supported Liquid Membrane Using Tri-n-Butyl Phosphate as Carrier. Hydrometallurgy 2005, 78, 107–115. [Google Scholar] [CrossRef]
- Selvaraj, K.; Manonmani, S.; Pattabhi, S. Removal of Hexavalent Chromium Using Distillery Sludge. Bioresour. Technol. 2003, 89, 207–211. [Google Scholar] [CrossRef] [PubMed]
- Akbal, F.; Camcı, S. Copper, Chromium and Nickel Removal from Metal Plating Wastewater by Electrocoagulation. Desalination 2011, 269, 214–222. [Google Scholar] [CrossRef]
- Protsenko, V.S.; Danilov, F.I. Chromium Electroplating from Trivalent Chromium Baths as an Environmentally Friendly Alternative to Hazardous Hexavalent Chromium Baths: Comparative Study on Advantages and Disadvantages. Clean Technol. Environ. Policy 2014, 16, 1201–1206. [Google Scholar] [CrossRef]
- Akar, S.; Lorestani, B.; Sobhanardakani, S.; Cheraghi, M.; Moradi, O. Surveying the Efficiency of Platanus Orientalis Bark as Biosorbent for Ni and Cr(VI) Removal from Plating Wastewater as a Real Sample. Environ. Monit. Assess. 2019, 191, 373. [Google Scholar] [CrossRef] [PubMed]
- Lee, S.-C.; Kang, J.-K.; Sim, E.-H.; Choi, N.-C.; Kim, S.-B. Modacrylic Anion-Exchange Fibers for Cr(VI) Removal from Chromium-Plating Rinse Water in Batch and Flow-through Column Experiments. J. Environ. Sci. Health Part A 2017, 52, 1195–1203. [Google Scholar] [CrossRef] [PubMed]
- Box, G.E.P.; Behnken, D.W. Some New Three Level Designs for the Study of Quantitative Variables. Technometrics 1960, 2, 455–475. [Google Scholar] [CrossRef]
- Guyon, I.; Elisseeff, A. An Introduction to Variable and Feature Selection. J. Mach. Learn. Res. 2003, 3, 1157–1182. [Google Scholar]
- Gonzalez, R.C.; Woods, R.E. Digital Image Processing, 4th ed.; Pearson: New York, NY, USA, 2018; pp. 405–420. [Google Scholar]
- Heaton, J. Ian Goodfellow, Yoshua Bengio, and Aaron Courville: Deep Learning. Genet. Program. Evol. Mach. 2018, 19, 305–307. [Google Scholar] [CrossRef]
- Mazaheri, H.; Ghaedi, M.; Ahmadi Azqhandi, M.H.; Asfaram, A. Application of Machine/Statistical Learning, Artificial Intelligence and Statistical Experimental Design for the Modeling and Optimization of Methylene Blue and Cd(II) Removal from a Binary Aqueous Solution by Natural Walnut Carbon. Phys. Chem. Chem. Phys. 2017, 19, 11299–11317. [Google Scholar] [CrossRef]
- Haykin, S.O. Neural Networks and Learning Machines, 3rd ed.; Pearson: Upper Saddle River, NJ, USA, 2009. [Google Scholar]
- Breiman, L. Random Forests. Mach. Learn. 2001, 45, 5–32. [Google Scholar] [CrossRef]
- LeCun, Y.; Bottou, L.; Bengio, Y.; Haffner, P. Gradient-Based Learning Applied to Document Recognition. Proc. IEEE 1998, 86, 2278–2324. [Google Scholar] [CrossRef]
- Maulud, D.; Abdulazeez, A.M. A Review on Linear Regression Comprehensive in Machine Learning. J. Appl. Sci. Technol. Trends 2020, 1, 140–147. [Google Scholar] [CrossRef]
Disclaimer/Publisher’s Note: The statements, opinions and data contained in all publications are solely those of the individual author(s) and contributor(s) and not of MDPI and/or the editor(s). MDPI and/or the editor(s) disclaim responsibility for any injury to people or property resulting from any ideas, methods, instructions or products referred to in the content. |
© 2026 by the authors. Licensee MDPI, Basel, Switzerland. This article is an open access article distributed under the terms and conditions of the Creative Commons Attribution (CC BY) license.