Abstract
Reverse engineering (RE) is essential in recreating 3D models of existing manufactured parts. It is widely used for repairing damaged components, improving used parts, and designing new items based on older models. One of the most common methods in RE is photogrammetry, which enables 3D reconstruction by capturing multiple images. Therefore, this study aimed to explore the application of mobile photogrammetry to obtain a 3D model of a train brake pad. The process started with capturing images of objects in a quick and professional manner to ensure visualization of data. This was followed by processing 2D images using Agisoft Metashape 2.2.1 software and Artificial Intelligence (AI) algorithms to create a precise 3D model. Subsequently, assessment was performed using feasibility in terms of cost, time, and accuracy. The results show that mobile photogrammetry provided an accessible and cost-effective method, alongside maximum contact stress after reducing optimization by approximately 28.42%, with maximum error value measured by the virtual model with the reference value of 0.30 mm (on Metashape) and 0.46 mm (on AI). This suggested that reverse parameterization significantly accelerated computer-aided design (CAD) model reconstruction and reduced the part redesign development cycle. By using photogrammetry and parametric modeling, engineers could accurately analyze and optimize train brake pads, ensuring safety as well as sustainability in railway operations. Additionally, RE and parametric modeling could assist in creating durable, cost-effective alternatives, and predicting appropriate replacements.
1. Introduction
Reverse engineering (RE) is a fundamental process in contemporary engineering that facilitates the re-measurement and recreation of 3D models for existing manufactured parts []. This method has been widely applied across industries including aerospace, automotive, and railway engineering to repair damaged components, enhance the performance of used parts, and design new components based on older models [,,]. Through RE, engineers can refine designs by digitally reconstructing objects, enhancing efficiency, and prolonging the operational lifespan of crucial mechanical components [,,]. RE, as a practical implementation of inverse analysis, also intersects with structural diagnosis and simulation efforts. Inverse analysis serves as a mathematical framework to estimate material or boundary properties from observable responses—such as displacements or strains—based on experimental data. G. Maier’s contributions [,] in this domain integrate mechanical testing with inverse analysis, often enhanced by Digital Image Correlation (DIC), to enable accurate identification of damage locations and mechanical parameters. This approach reinforces the role of RE not only in geometric modeling but also in structural integrity assessment and predictive diagnostics [,]. As a widely used method in RE, photogrammetry enables 3D object reconstruction by capturing multiple images from varying angles []. It also extracts spatial data from 2D images, generating highly precise 3D models. The widespread application is largely attributed to cost-effectiveness, user-friendliness, and the capability to capture intricate details without direct contact with the object [,,].
In comparison, traditional 3D scanning methods use costly laser scanners and high-end metrology tools, while mobile photogrammetry provides a more affordable alternative by applying smartphones or consumer-grade cameras [,,,]. Recent advancements in computational photography and Artificial Intelligence (AI) have significantly improved mobile photogrammetry, serving as a practical tool for various engineering applications [,]. By using mobile devices, engineers can capture images of the brake pad from multiple perspectives, ensuring comprehensive coverage for accurate 3D reconstruction [,]. These images are processed using specialized software such as Agisoft Metashape, which applies structure-from-motion (SfM) and Multi-View Stereo (MVS) algorithms to generate a dense point cloud, and convert into a 3D mesh [,]. Additionally, AI algorithms refine models by correcting distortions, filling in missing data, and improving geometric accuracy [,,].
To evaluate the feasibility of photogrammetry, analysis is conducted based on cost, time, and accuracy [,]. Compared to laser scanning and coordinate measuring machines (CMMs), this method offers a cost-effective alternative by using readily available devices [,,]. The image capture process is quick and requires minimal setup, while AI-assisted processing accelerates 3D model generation [,]. However, the accuracy is based on image quality, lighting conditions, and software capabilities [,,]. One of the primary challenges in RE is transitioning from a point cloud to a parametric computer-aided design (CAD) model [,]. Three-dimensional scanning provides point clouds or mesh models of objects, and deforming these 3D meshes is important for analyzing motion and optimizing shapes. This process plays a crucial role in fields such as computer-aided engineering (CAE) and computer animation []. To address the limitations of mesh-based representations in such applications, reverse parameterization is employed to identify geometric features and convert them into editable CAD entities [], enabling further design modifications and integration within the CAD environment. This method considerably reduces the part redesign development cycle and ensures compatibility with existing engineering workflows. Further references on inverse analysis methods applied to mechanical structural components include [,,], which provide insights into CAD/CAE integration and mechanical diagnosis using inverse approaches. Train brake pads endure substantial wear due to high friction forces during braking operations [,]. Through RE and photogrammetry, engineers can assess wear patterns, optimize material selection, and create cost-effective replacement parts []. Furthermore, predictive maintenance strategies can be developed to determine the optimal replacement schedule, thereby minimizing downtime and enhancing railway safety. RE and parametric modeling also support sustainable engineering practices by reducing waste, lowering material costs, and extending component lifespan [,]. By developing durable, high-performance alternatives, engineers contribute to efficient railway operations and mitigate environmental impact [].
Based on the background above, this study aimed to explore the application of mobile photogrammetry to obtain a 3D model of a train brake pad, a crucial component in railway safety. The process started with the removal of the brake pad from the train, followed by taking a series of photographs to construct the 3D model. Subsequently, the generated model was analyzed by comparing pre-measured dimensions of the brake pad with the 3D CAD model, conducting an accuracy assessment, and presenting the findings in the Results Section. The method was further evaluated in terms of accuracy, cost, time efficiency, and practical applicability. Since the 3D model obtained could not be used in various applications, including maintenance and repair, restoration, prototyping, product development, and the enhancement of existing designs, this study served as a valuable reference for professionals to implement mobile photogrammetry in railway engineering.
2. Materials and Methods
2.1. Creating 3D Models Using Photogrammetry
The process of 3D model reconstruction can be time-consuming, but with Agisoft Metashape software, the steps become more straightforward. There are various photogrammetry methods that require in-depth knowledge to achieve specific results. However, for simple 3D model creation, the basic features of the software are sufficient. The user only needs to provide images of the object, fix any issues that arise, and remove unwanted parts of the generated mesh using other software. Meanwhile, most of the technical processes will be handled automatically by the software. To facilitate understanding, the entire workflow was visualized in a flowchart. This diagram helps distinguish between tasks performed by the user and those handled automatically by the software. The flowchart is presented in Figure 1, where tasks in the blue area are performed by the software with minimal user intervention. This method applies to basic reconstruction, but more experienced users can adjust the workflow according to their needs.
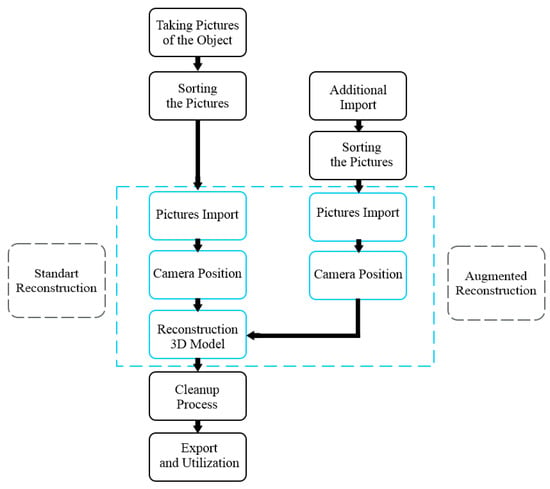
Figure 1.
Workflow creating 3D models using photogrammetry.
The 3D reconstruction process starts with capturing images of the selected object. In this case, the primary objective is to use photogrammetry to generate a 3D model of a brake pad. As a result, the photographed object has a relatively large size. One key aspect of this process is ensuring adequate lighting. For large objects, taking images outdoors can be an option, but direct sunlight may cause challenges. Therefore, capturing images on a cloudy day is the best alternative. Objects with rough surfaces are easier to process, while those with shiny surfaces show slight difficulties. If possible, coating the object with powder, such as flour, can help reduce light reflection and increase the chances of a successful reconstruction. Images should be taken using a DSLR camera, with the aperture settings adjusted to ensure the entire object remains in focus. Since more images allow for better detail, a minimum of 60–200 images were recommended, depending on the objects size and level of detail. It is crucial not to move the object during the photography process []. To achieve optimal results, the object should be captured from various angles while occupying most of the frame in each image. The best method is to walk around the object while taking photos. However, rotating the object while keeping the camera stationary is less effective and not suitable for large objects.
2.2. Specifications and Setting Camera
During the capture process, various camera settings were carefully configured to ensure images met the required specifications for accurate 3D model generation. The settings were adjusted based on the environmental conditions, particularly the lighting setup within an enclosed space. In this study, a Sony A6000 camera was used, with specific configurations set to Manual mode, a shutter speed of 1/160 s, an aperture of f/1.8, and an ISO of 400. These settings were selected to optimize image clarity, minimize noise, and maintain consistency across all captured images. Additionally, adjustments to ISO and aperture were made as needed to compensate for changes in lighting conditions, ensuring sufficient exposure and detail in the photographs. By fine-tuning these parameters, high-quality images were obtained, contributing to the accuracy and reliability of the 3D reconstruction process.
The camera settings used during the image capture process in this study were adjusted according to the lighting setup of the photogrammetry studio. There are three key aspects in camera settings for photography, namely aperture, shutter speed, and ISO. These aspects are closely related to the light intensity of the workpiece being photographed. Since the light intensity in this photogrammetry setup was predetermined, the most influential aspect of the image capture process was the appropriate ISO setting. This is because a higher ISO leads to brighter images, which investigate the impact of ISO settings on image quality under different lighting conditions. The results show that, while a higher ISO setting increases image brightness, it can introduce noise, making careful adjustments. To determine the most suitable settings for the given lighting conditions, three tests are performed using different ISO settings to identify the optimal image results. The camera settings used in this study are shown in Table 1.

Table 1.
Specifications and camera settings.
The shooting results of each camera setting showed that images captured with F1.8 aperture, shutter speed of 1/160 s, and ISO 400 had the right quality. This was because images were not dark compared to ISO 200 and not extremely bright as at ISO 600. Additionally, the focus image of the shooting appeared clear, sharp, and there was no noise light, showing suitability for use during the 3D modeling process in the software.
2.3. Data Acquisition
As shown in Figure 2, 432 images of the train brake pad were taken in a controlled photo studio environment to ensure optimal lighting and image quality. The studio was set up with a light intensity of 200 lx to maintain consistency throughout the image capture process. Figure 1 shows the photogrammetry studio arrangement, indicating the lighting configuration and camera placement used during the photography session. Proper positioning of the lighting sources and camera angles plays a crucial role in minimizing shadows and reflections, which can affect the accuracy of the 3D reconstruction process. The collected images were processed using Agisoft Metashape and Google Colab to generate a dense point cloud and a textured 3D model of the train brake pad. The processing was divided into three main stages, which required approximately 24 min, 14 min, and 9 min, respectively. These tasks were executed on a high-performance desktop computer equipped with an Intel Core i7-1255U processor, 16GB DDR4-3200 RAM, and a 512GB SSD, operating on Microsoft Windows 11.
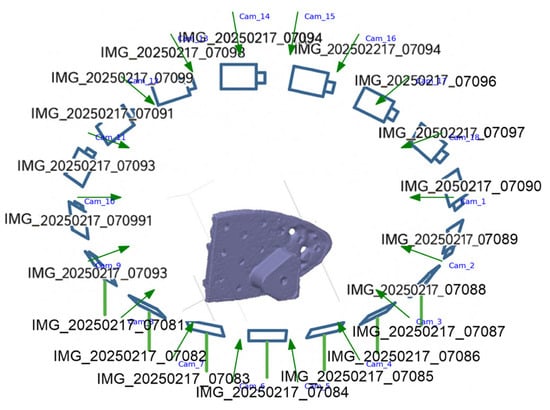
Figure 2.
Camera station configuration of brake pad.
The processing speed and efficiency were influenced by both the hardware specifications as well as the optimization of photogrammetry algorithms used in Agisoft Metashape []. Following the 3D model generation, further measurements and analysis were conducted using SolidWorks 2025. The STL model of the train brake pad was imported into the SolidWorks environment, where precise measurements were performed to compare the dimensions of the 3D model with the actual brake pad. This stage of the study lasted for approximately 3 h to ensure a detailed assessment of the model’s geometric accuracy. Using SolidWorks, engineers can evaluate the fidelity of the reconstructed model to identify necessary refinements before further applications, such as RE, prototyping, or manufacturing improvements. In this study, the structured workflow ensures that mobile photogrammetry is a viable method to obtain high-quality 3D models of train brake pads. The integration of CAD and CAE tools is critical throughout a product’s lifecycle, as the CAD model serves as a foundational element for design, analysis, manufacturing, and assembly processes []. Enhancing this integration, the combination of controlled lighting conditions, precise image acquisition, and advanced software processing significantly improves the accuracy and reliability of the resulting 3D models. These methods have proven to be both time-efficient and practical across a range of engineering applications, including design optimization, maintenance, and repair. By leveraging photogrammetry in conjunction with CAD software, engineers can perform more detailed component analysis, supporting the development of high-quality replacement parts and promoting the efficiency and sustainability of railway maintenance practices.
2.4. Object Photogrammetry
As shown in Figure 3. This study explored a train brake pad, a vital component in railway braking systems responsible for ensuring the safe and efficient deceleration of trains. Analysis was performed using mobile photogrammetry to capture the geometric features of the brake pad and generate an accurate 3D model. Moreover, the selection of a brake pad was due to their crucial role in railway safety and the need for wear monitoring, conducting RE, and optimizing the design to improve performance and durability. During braking, the train brake pad often experiences constant friction and extreme pressure, leading to gradual wear and potential performance degradation. This requires frequent inspections, maintenance, and eventual replacement to ensure optimal functionality.
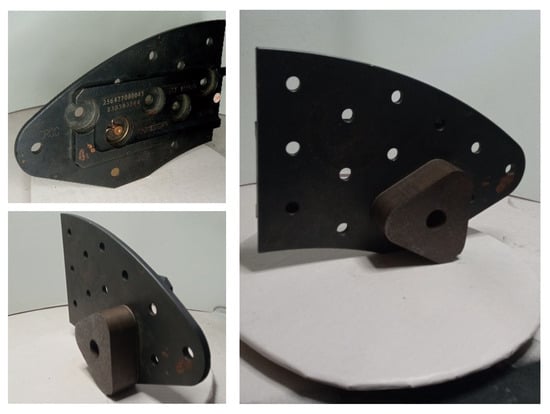
Figure 3.
The object in the research is a brake pad.
The method used in this study included capturing several high-resolution images of the brake pad from different angles using a mobile camera. For the best quality, controlled lighting conditions were established in a photo studio, preventing excessive shadows and reflections from affecting the reconstruction process. After capturing all images, processing was performed using specialized photogrammetry software such as Agisoft Metashape. This software applied advanced algorithms, SfM and MVS, to generate a dense point cloud and reconstruct the 3D structure of the brake pad. To support data processing, Google Colab was used, leveraging cloud computing resources for faster model generation.
2.5. Data Processing
Following the completion of the fieldwork phase, the office work segment of the study commenced. During this stage, a total of 191 images capturing the train brake pad were meticulously processed using Agisoft Metashape Professional Software. To achieve precise triangulation, two user-defined tie points were designated on each component of the brake pad. These points played an essential role in ensuring accuracy in the correlation of images. Subsequently, detailed measurements of brake pad components were taken to establish predefined positioning and scale constraints, using the previously marked tie points, as shown in Figure 4. To further aid the triangulation process, the generic block type option was selected. Since camera calibration parameters were precomputed, the “Keep camera calibration” setting was enabled for the aerotriangulation process. The images shown in Figure 4 were identified across all photographic images to guarantee precise determination of camera positions and minimize noise interference in the point cloud data. Once the aerotriangulation procedure was completed, the generation of the 3D point cloud dataset commenced. A colored point cloud was constructed by selecting the options of 1-pixel point sampling, no compression, and visible colors as the color source. The resultant point cloud data passed through an initial rough cleaning phase to eliminate points associated with unwanted regions. This step was performed to prevent unnecessary computational resource consumption and optimize processing efficiency. After the removal of extraneous points in the sparse point cloud data, the next stage included generating a dense point cloud dataset using moderate depth filtering. Regarding the front surface of the train brake pad, the sparse point cloud dataset consisted of 169,040 points, while the corresponding dense point cloud dataset contained 13,766,657 points. Meanwhile, the rear surface showed a sparse point cloud dataset of 89,821 points and a dense point cloud dataset comprising 1,357,748 points.
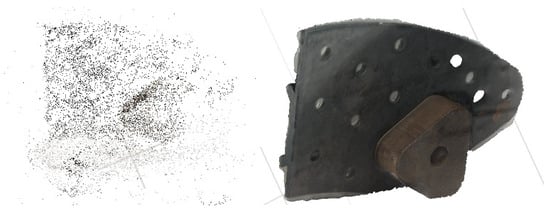
Figure 4.
Point cloud data brake pad model.
During the subsequent mesh-building phase, the dense cloud dataset was selected as the primary source data. The surface type was specified as arbitrary (3D) and a high-quality face count was applied to enhance precision. This was followed by activating interpolation, and the “calculate vertex colors” option was enabled. The stages were individually executed for both the front and rear surfaces of the train brake pad. Meanwhile, the finalized 3D model was successfully constructed by merging the two separately obtained models. This comprehensive method ensured the creation of an accurate and detailed 3D representation of the train brake pad, facilitating further analysis and assessment.
The mesh construction process further involved several key computational techniques essential for optimizing model fidelity and simulation readiness:
- Triangulation Algorithm
One of the most widely employed triangulation methods is Delaunay triangulation, which ensures that no data point lies inside the circumcircle of any triangle in the mesh. This characteristic helps prevent the formation of narrow, unstable triangles that can degrade computational accuracy in later analysis stages. In this study, Delaunay triangulation was applied to generate the initial surface mesh from the dense point cloud, offering a robust and efficient method for geometric reconstruction.
- b.
- Mesh TypesTwo principal mesh types were considered during the reconstruction workflow:
- Surface Mesh: Comprising triangles or quadrilaterals, this mesh type captures only the external geometry of the object. It is primarily used for visualization, CAD modeling, and rendering purposes. In this project, software like Agisoft Metashape and Geomagic generated surface meshes suitable for high-resolution visualization and dimension analysis.
- Tetrahedral Mesh (Volume Mesh): This mesh divides the internal volume of the model into tetrahedral elements and is essential for structural simulations, such as Finite Element Analysis (FEA). While surface meshes were adequate for model reconstruction and accuracy validation, tetrahedral meshes were later generated for structural analysis and optimization simulations.
Selection Guidance:- Surface mesh: best for geometric modeling and visualization.
- Tetrahedral mesh: required for physical simulations and performance evaluation.
- c.
- Mesh Parameter Settings
- Mesh Density: This setting controls the number of mesh elements, directly influencing detail and computational load. A higher density allows for more accurate geometry representation but increases processing time. In this study, a high-density configuration was chosen during meshing to capture fine details of the brake pad geometry.
- Decimation Factor: To improve performance during post-processing and analysis, polygon count reduction (decimation) was applied. This technique reduces the number of faces in the mesh while preserving the overall geometry, enhancing efficiency for CAD export and real-time rendering. For example, the initial dense mesh containing over one million triangles was decimated to below 300,000 for simulation readiness.
- Surface Smoothing: Algorithms such as Laplacian smoothing were employed to refine the mesh by eliminating noise and irregularities, especially around the curved and transition regions. Care was taken to preserve key geometrical features and avoid distortion of critical surfaces.
2.6. Process 3D Model with AI
Figure 5 illustrates the workflow for creating a 3D model of an object using AI. The process consists of several key steps, beginning with gathering images of the object to be reconstructed. These images are then uploaded to a designated folder in Google Drive, ensuring they are accessible for further processing. Next, the AI-based program is executed within Google Colab, leveraging cloud-based computing power to process the images efficiently. Following this, the system performs meshing and texturing to generate a structured 3D representation of the object with realistic surface details. Finally, users can download the generated 3D model in various file formats, such as STL, OBJ, or JPG, making it suitable for applications like 3D printing, rendering, or further digital modifications. The structured workflow streamlines the transformation of 2D images into a detailed 3D model using AI-powered techniques.

Figure 5.
The workflow for creating a 3D model.
2.7. Photogrammetry Studio
The design of the photogrammetry studio setup aims to capture high-quality images from several angles and create an accurate 3D reconstruction of the train brake pad. The system comprises a rotating arm with a mounted camera, enabling image capture at 0°, 45°, and 90°. These angles provide comprehensive coverage of the object’s geometry, ensuring the construction of detailed 3D model. The object is placed centrally on a stable platform, with a supporting structure holding additional components that contribute to maintaining balance and correlation, as shown in Figure 6.

Figure 6.
Photogrammetry studio.
As shown in Figure 7, the schematic setup of a 3D scanner consists of a rotating platform (f) where the object (b) is placed for scanning, with a camera (d) positioned 30 cm away to capture images from different angles. The camera is mounted on an adjustable arm (e) to modify focus and distance as needed. Lighting positions (a and c) are strategically placed to ensure uniform illumination, reducing shadows for a clearer scan. As the studio rotates 360°, the camera captures multiple images, aided by a clean photo studio background (f) to enhance accuracy. The setup incorporates proper lighting and a neutral background for best image conditions. These elements help minimize unwanted reflections and reduce noise to improve the accuracy of the photogrammetry process. Additionally, tie points are strategically placed on the object as reference markers that facilitate accurate triangulation during images processing. Along a predefined trajectory, the camera is positioned to ensure appropriate correlation of images. This stage is essential to achieve precise spatial positioning and reduce errors in the 3D reconstruction process.
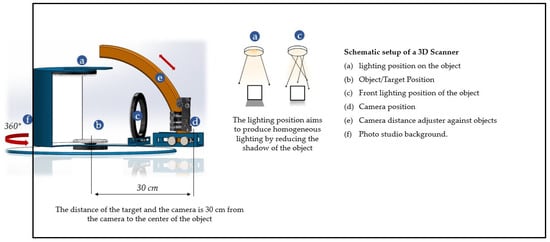
Figure 7.
Schematic setup of a 3D scanner.
After capturing, all images are processed using specialized photogrammetry software, such as Agisoft Metashape, to generate a point cloud, which represents the object’s surface in a digital space. The software refines the model by filtering unnecessary data and enhancing the resolution to produce a detailed 3D representation of the scanned object. Several methods including depth filtering and mesh building are also applied to improve the model’s accuracy. By integrating structured image capture, calibrated positioning, and advanced computational processing, this photogrammetry setup ensures a high-fidelity 3D model that can be used for various analytical and engineering applications. The ability to capture images from several perspectives and apply structured processing methods enables precise measurements and assessments of the object’s characteristics. This method is used in mechanical engineering, industrial inspection, and component analysis, where accurate digital models are essential for evaluation, simulation, and design optimization. Furthermore, a well-structured photogrammetry method enhances the efficiency and accuracy of 3D modeling, serving as an essential tool for engineers.
3. Result
3.1. Data Acquisition and Processing
The use of Geomagic Studio in model reconstruction includes numerous stages, namely the acquisition of point cloud data and refined triangulated surface. In this case, data acquisition is conducted using a scanner with photogrammetry method to ensure non-contact scanning. According to Figure 8, the initial scan produces a point cloud representation of the object, comprising a dense collection of individual points that outline the surface geometry. However, raw point cloud data often contain noise and unnecessary details, affecting the accuracy of the final model. To address this challenge, acquired data are imported into the Geomagic Studio for further refinement. Within the software, an essential preprocessing stage is conducted to reduce interference and noise in the point cloud, ensuring relevant data are retained for the next stage.
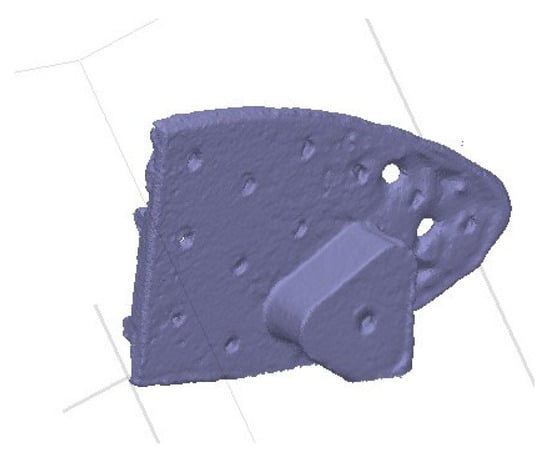
Figure 8.
Point cloud data representation of the brake pad.
Following optimization, the data are processed into polygonal form, marking the transition to the polygon processing stage. For modifications and parameterization, the polygonal data are divided into two distinct sections, allowing for more precise handling and model reconstruction. One of the critical tasks during this stage is hole filling, wherein missing data points are identified and interpolated to create a continuous surface. This ensures that any gaps in the scanned data are properly addressed, allowing for a complete and coherent geometric structure. After the hole-filling procedure, additional adjustments and mesh repairs are performed to further enhance the quality of the reconstructed surface. This stage ensures visual accuracy and structural stability of the model for downstream applications, such as computer-aided design (CAD) or finite element analysis (FEA).
After completing refinements, the processed model becomes a triangulated surface, as shown in Figure 9. This triangulated surface is a crucial stage in the reconstruction process, representing a more structured and manageable form of the object. During further operations, triangulated meshing allows for better computational efficiency and accuracy such as surface fitting, smoothing, and feature extraction. This method allows the model to maintain geometric integrity, ensuring flexible modifications and optimizations.
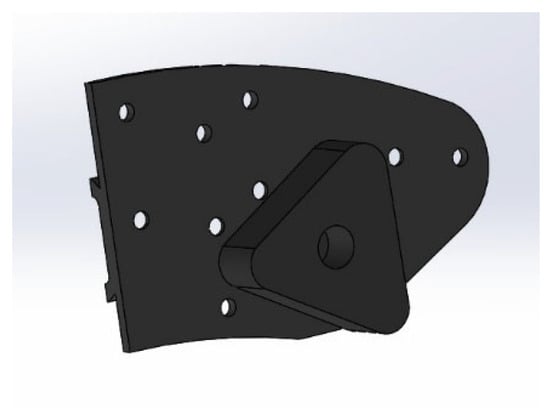
Figure 9.
Triangulated surface in Agisoft Metashape software.
3.2. Parametric Surface Analysis and Model Reconstruction
After completing the polygon stage, the next is surface reconstruction, which takes place in Geomagic Studio. This stage plays a fundamental role in RE, transforming the raw polygonal mesh into a refined parametric surface. The process starts by forming a smooth, continuous surface from the previously structured polygon data. This is followed by the identification of curved surfaces by software and reconstruction to ensure that the model retains an accurate and uniform geometric representation. Using the parametric surface feature, software refines the overall shape, smoothing out any inconsistencies and preparing the model for further optimization. A key aspect of surface reconstruction is the formation of a structured grid network. Through the built-in grid generation functions in Geomagic Studio, a uniform grid network is mapped onto the model’s surface. This uniformity is essential in the final surface quality, as denser and more evenly spaced grid points contribute to a smoother, highly accurate representation.
Surface reconstruction ensures that any irregularities in the polygonal mesh are corrected, allowing for a more precise transition from raw scan data to a refined, manufacturable model. Following the structured grid formation, Geomagic Studio uses Non-Uniform Rational B-Splines (NURBS) to synthesize a continuous surface from the grid network. NURBS is a powerful mathematical representation commonly used in CAD and computer-aided manufacturing (CAM) that provides a highly flexible and smooth surface definition. By automatically generating a NURBS surface, Geomagic Studio effectively converts the raw scan data into a fully functional digital model that can be further manipulated in CAD environments.
After establishing the NURBS surface, additional refinements such as cutting, stitching, and surface merging are performed. These operations ensure that different model sections correlate seamlessly and resolve surface discontinuities. Following adjustments, the final CAD model is created, as shown in Figure 10. The CAD model represents the fully reconstructed and optimized version of the original scanned object. Subsequently, the output file is saved in a commonly used format such as STEP, IGES, or STL, allowing for compatibility with various CAD software for further engineering applications.
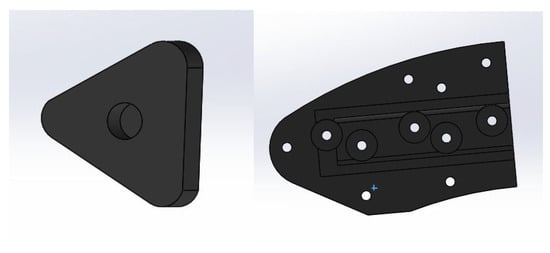
Figure 10.
CAD model with method photogrammetry Agisoft Metashape (offline software).
As shown in Figure 11, the final reconstructed model of brake pad is achieved through this comprehensive workflow. The integration of structured grids, NURBS surfaces, and CAD processing ensures that the brake pad model is visually accurate and functions precisely, allowing for suitability for further manufacturing processes, simulations, and analysis. By systematically refining the scanned data through each stage, namely polygon processing, parametric surface reconstruction, grid formation, and CAD conversion, Geomagic Studio facilitates an efficient RE workflow. This ensures that the reconstructed model meets high standards of precision, showing potential suitability for use in industries such as aerospace, automotive, and mechanical engineering.
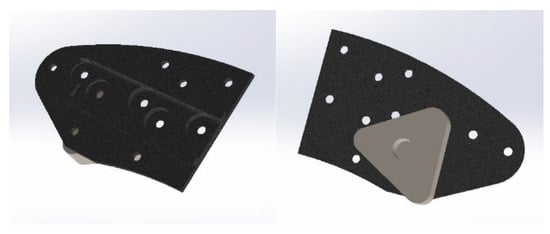
Figure 11.
Reconstruction model of brake pad with method photogrammetry AI-based photogrammetry software (online software).
3.3. 3D Model Evaluation
Figure 12 shows a solid brake pad train model of various types without texture information indicating the reconstruction quality. Although the scanning system successfully captured the complex surface structure of the brake pad, errors were still present in small details, particularly in the blade tip areas. The variations in the number of EDOF images showed a significant influence on the generated solid images. The comparison between Photogrammetry Offline Software/Agisoft Metashape (A) and AI-Based Photogrammetry Software/Google Colab (B) in the context of 3D model reconstruction showed significant differences in surface accuracy, reconstruction quality, and computational efficiency. Photogrammetry is the process of converting 2D images into a 3D model, which depends on complex algorithms to extract spatial information and generate accurate digital representations. As shown in Image A, traditional offline photogrammetry software uses SfM and MVS methods to reconstruct a 3D model by identifying and matching features across multiple images, estimating camera positions, and generating a dense point cloud. This method often struggles with surface noise, missing details, and errors in fine structures, particularly in intricate components such as a brake pad train model.
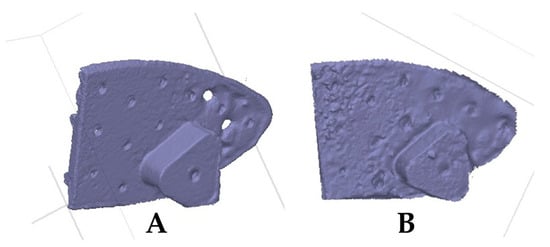
Figure 12.
Images of 3D model solids object views of different SfM software, (A) Photogrammetry offline software; (B) AI-based photogrammetry software.
In Image A, the reconstructed model appears rough and less refined, with visible artifacts and inconsistencies in surface geometry, which result from limitations in feature detection and dense reconstruction methods. This traditional method requires significant computational power and longer processing times, as each image experiences an extensive correlation process, which fails to handle reflective or textureless surfaces effectively. Moreover, occluded or shadowed regions may not be well reconstructed, leading to gaps or inaccuracies in the final model. In contrast, AI-based photogrammetry software, as shown in Image B, integrates deep learning and neural networks to enhance the 3D reconstruction process by improving feature detection, predicting missing geometry, and refining surface textures. AI-driven methods analyze large datasets of 3D structures, allowing them to infer details that would typically be lost in traditional photogrammetry.
In Image B, the brake pad train model shows smoother surfaces, fewer distortions, and a more realistic geometry, indicating AI’s ability to produce high-quality reconstructions with minimal artifacts. Compared to traditional methods that rely solely on pixel-based feature matching, AI-based photogrammetry learns from geometric patterns and automatically corrects inconsistencies, making it particularly effective for complex or highly detailed components. Additionally, AI significantly reduces processing time, optimizing feature extraction and eliminating the need for redundant calculations, which allows for faster and more efficient reconstructions. AI-driven photogrammetry also excels in handling reflective, textureless, or occluded surfaces, where conventional methods often fail, by filling in missing data based on learned priors. This ability to intelligently interpolate and predict missing parts makes AI-based photogrammetry more suitable for applications requiring high precision, such as engineering, aerospace, and industrial design. Although traditional photogrammetry still plays a crucial role in 3D modeling, the reliance on manual feature matching, extensive processing, and high computational demands makes it less efficient. AI-based photogrammetry continues to evolve, offering more robust, accurate, and efficient solutions for 3D model reconstruction. The transition towards AI-based methods is transforming industries by making high-fidelity 3D scanning more accessible, automated, and reliable, reducing the need for extensive human intervention while improving overall reconstruction quality.
Figure 13 presents the confidence levels of the brake pad model, comparing Photogrammetry Offline Software (A) and AI-Based Photogrammetry Software (B) through a color-mapped 3D model. The confidence level in 3D model reconstruction is a key indicator of accuracy, where green and blue areas represent high confidence, and red areas indicate deviations from the actual object. In Image A (Offline Photogrammetry Software), the reconstruction is relatively accurate but inconsistent in certain areas, particularly along edges and corners, where red shows errors in capturing depth variations. Traditional photogrammetry relies on SfM and MVS algorithms, using feature matching and triangulation to generate a dense point cloud before meshing.
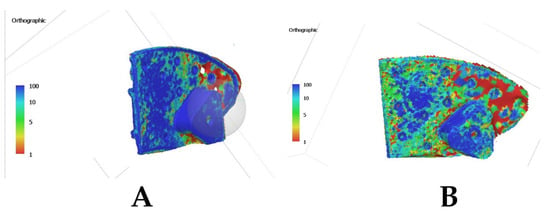
Figure 13.
Images of 3D model confidences object views of different SfM software, (A) Photogrammetry offline software; (B) AI-based photogrammetry software.
Although this method is effective, it is highly dependent on image overlap, surface texture, and lighting conditions, making it vulnerable to occlusions, noise, and missing data. The red areas in Image A suggest challenges in reconstructing fine details, reflective surfaces, and areas with poor texture contrast, which are common limitations of traditional SfM-based photogrammetry software like Agisoft Metashape. Additionally, the reliance on manual tuning of parameters and extensive processing time makes it less efficient for complex geometries. Despite these limitations, offline photogrammetry remains widely used in archaeology, heritage documentation, and industrial applications where computational resources and automation are not primary concerns. Figure 13 illustrates the confidence levels of 3D model reconstructions generated by two different Structure-from-Motion (SfM) software tools, labeled as views A and B. The legend in both images uses a color scale to indicate the reconstruction confidence of each 3D point, where blue (≈100) represents high confidence, signifying well-defined geometry derived from multiple consistent image matches. Green to yellow shades (≈10 to 50) indicate moderate confidence, typically arising from fewer image overlaps or partial occlusion. Red (≈1) denotes low confidence, often occurring in areas with poor texture, reflective surfaces, or insufficient photographic coverage. This color-coded visualization allows for quick assessment of model accuracy and helps identify regions that may require additional refinement or re-capture.
Figure 13 shows the color map which represents the reconstruction confidence level of each point, where blue indicates high confidence (≈100), green to yellow indicates moderate confidence (≈10–50), and red indicates low confidence (≈1). In contrast, Image B (AI-based photogrammetry Software) shows a more uniform confidence distribution, with fewer red and more green/blue areas, suggesting higher reconstruction accuracy and limited artifacts. AI-based photogrammetry uses deep learning models trained on extensive datasets, which allows for prediction of missing data, enhances feature detection, and improves surface consistency. Compared to traditional photogrammetry, which follows a linear depth estimation process, AI-based methods dynamically adjust and optimize depth calculations, serving as a robust strategy in handling occlusions, lighting variations, and low-texture surfaces. The confidence level map in Image B suggests a closer alignment between the reconstructed model and the real object, leading to a more stable and reliable 3D representation.
One of the major advantages of AI-based photogrammetry is the ability to intelligently fill missing data, significantly reducing holes, jagged edges, and incomplete reconstructions. This capability is particularly valuable for high-precision industries such as aerospace, medical imaging, and automated industrial inspections, where accuracy and detail preservation are critical. Additionally, AI-based photogrammetry significantly reduces processing time by using pre-trained neural networks that can automatically refine and optimize reconstructions without manual intervention. This leads to faster model generation with reduced computational costs, serving as an efficient alternative to traditional SfM/MVS workflows. The prevalence of green and blue areas in Image B suggests that AI-based methods achieve a higher degree of geometric accuracy, particularly in complex areas. Another significant strength is the ability to handle reflective and low-texture surfaces, which often create challenges for traditional photogrammetry software due to poor feature detection and inconsistent depth estimation.
As shown in Figure 14 and Figure 15, the Agisoft Metashape program produces superior results with fewer errors compared to alternative applications such as AI Google Colab. The details of the 3D brake pad model in Figure 13A Photogrammetry offline software have higher definition, are clearer, have more natural colors, and smoother textures compared to Figure 13B AI-based photogrammetry software. Meanwhile, Figure 14 shows a comparison of the 3D brake pad model with various orientations built by different SfM software. The results show that Metashape has the best outcomes, while AI Google Colab and Meshroom generate “noisy” point clouds and fail to produce any set of point clouds from the sculpture dataset. In the case of AI Google Colab’s SfM software, the results of the 3D brake pad model are close to Agisoft Metashape, suggesting that the use of alternative software can be a solution in RE process. Based on Table 2, the use of AI Google Colab software has the smallest cumulative time, indicating the RE process. Furthermore, photogrammetric computer vision framework called AliceVision offers camera tracking and 3D reconstruction methods. Table 2 shows the specifications of various SfM applications that are operated to reconstruct the 3D model of the Hemiptera insect specimen.
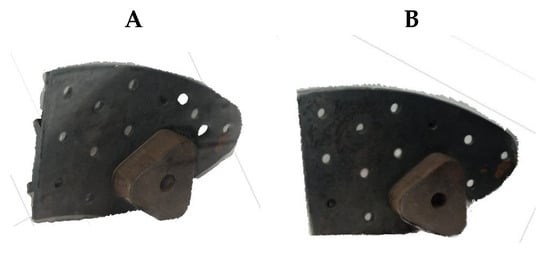
Figure 14.
Images of 3D model texturing object views of different SfM software, (A) Agisoft Metashape; (B) AI Google Colab.
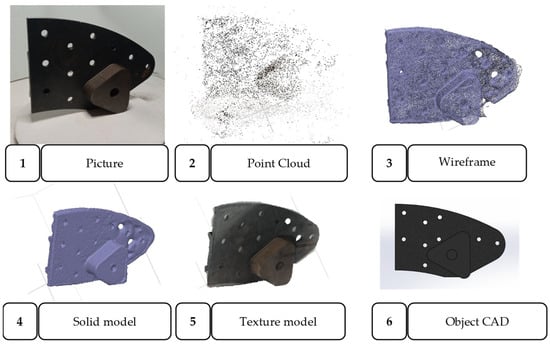
Figure 15.
Images of 3D model texturing object views of different SfM software.

Table 2.
Specifications comparison of different SfM software to reconstruct 3D brake pad model.
3.4. Optimization of Brake Pad Structure
The FEA performed on the brake pad (PAD2) provides insight into its structural integrity under static load conditions. The results, derived from strain, displacement, and von Mises stress distributions, show critical performance characteristics of brake pad material and design. The legends presented in the simulation results illustrate the distribution of strain, displacement, and von Mises stress across the brake pad model. In the strain contour (ESTRN), the color gradient ranges from blue (lowest strain, ≈3.178 × 10⁻⁷) to red (highest strain, ≈2.680 × 10⁻³), indicating regions experiencing significant deformation, particularly around geometric transitions. The displacement plot (URES) shows a similar gradient, where blue denotes minimal movement (≈1.165 × 10⁻²⁰ mm) and red indicates maximum displacement (≈6.576 × 10⁻³ mm), typically occurring in unconstrained or free regions of the structure. In the von Mises stress distribution, blue areas represent low stress (≈9.944 × 10⁶ N/m2), while red highlights critical stress concentrations reaching up to 1.214 × 10⁹ N/m2, significantly surpassing the material’s yield strength of 250 MPa as marked by a red threshold line. These legends are crucial in interpreting the structural performance of the brake pad under load, identifying high-risk areas for deformation or failure, and guiding design improvements for enhanced durability and safety.
As presented in Figure 16, the strain distribution across the brake pad shows significant variations, with the highest values concentrated in specific areas, prominently denoted in red. According to the color scale, the maximum strain observed is approximately 2.68 × 10⁻³, indicating the areas experiencing the most significant deformation. In comparison, the strain remains relatively low across the majority of the structure, suggesting that the material is experiencing minimal elongation or deformation under the applied static load. This distribution implies that, while most of brake pads retain their structural integrity under the given conditions, localized regions of higher strain, particularly in areas with geometric complexity such as corners, edges, or transitions in thickness, are subjected to greater deformation. These areas likely correspond to stress concentrators, where abrupt changes in geometry cause localized amplification of mechanical stress and strain. The results suggest that, while the overall design maintains stability under load, the identified high-strain areas may require closer examination to prevent potential issues related to material fatigue, wear, or failure over time.
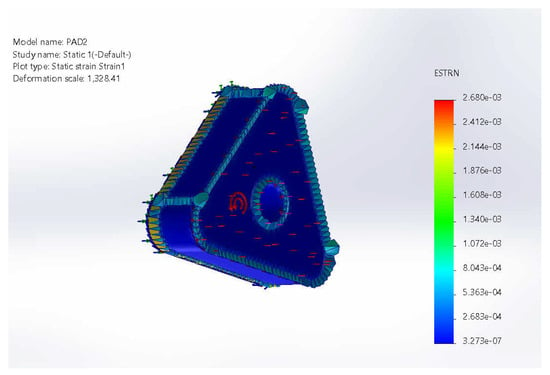
Figure 16.
Images strain analysis.
The displacement analysis, as shown in Figure 16 provides insight into the extent of movement experienced by various regions of the brake pad under applied forces. The contour plot shows that displacement is not uniform, with some areas indicating greater movement than others. The highest displacement value recorded is 6.576 × 10⁻³ mm, which is quite small, indicating that the brake pad retains its structural rigidity even under loading conditions. The maximum displacement primarily occurs in free areas with minimal support, where the structure has greater freedom to deform. However, the lowest displacement values are observed in areas fixed or heavily constrained, reinforcing the fact that these areas experience negligible movement. The maximum displacement, approximately 0.0066 mm, suggests that some minor deflections occur, but are not significant enough to compromise the overall stiffness of the brake pad. The largest deflections are concentrated around the free edges or thinner sections of the model, which is expected due to their reduced ability to resist deformation. The results confirm that the brake pad maintains a high degree of structural integrity, with only localized deformations occurring in less constrained areas. Figure 17 displays the results of a displacement analysis, specifically illustrating the total displacement magnitude (URES) across the brake pad model under static loading conditions. The legend indicates values in millimeters, ranging from approximately 1.00 × 10⁻³⁰ mm (deep blue, indicating negligible movement) to 6.576 × 10⁻³ mm (red, representing the highest displacement). This total displacement (URES) combines the individual displacement components along the x (ux), y (uy), and z (uz) axes using the Euclidean norm, i.e.,
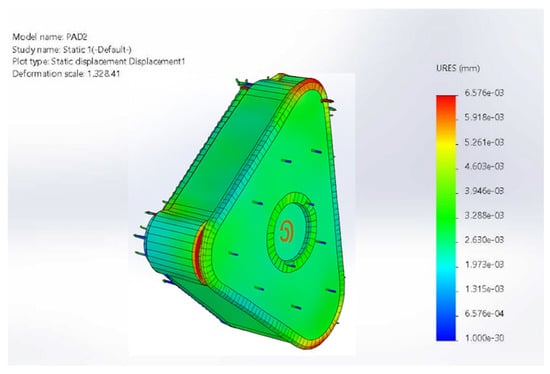
Figure 17.
Displacement analysis.
The plot provides a comprehensive view of how much each point in the structure moves in space, rather than along a specific direction. Regions highlighted in red typically indicate the most flexible or unsupported parts of the model, while blue zones correspond to areas with fixed or constrained boundaries.
Figure 18 provides crucial insights into stress distribution across the brake pad, showing that the areas might be susceptible to material failure. The analysis identifies areas with the highest stress concentrations, which are particularly important for evaluating potential risks of yielding or structural damage. The maximum recorded von Mises stress is 1.214 × 10⁹ N/m2 (1.214 GPa), occurring in localized areas that experience the greatest loading conditions. This value significantly exceeds the material’s yield strength of 250 MPa (2.5 × 10⁸ N/m2), showing that certain areas of the brake pad are subjected to stress levels beyond the elastic limit of the material. Consequently, the areas are prone to plastic deformation, which can compromise brake pad’s integrity and lead to long-term performance issues or even failure under repeated loading cycles. The stress distribution suggests that the most critical areas are found in geometric discontinuities, such as sharp edges, corners, or abrupt thickness transitions. Additionally, von Mises stress exceeding the yield limit implies that the material is overstressed, potentially requiring design modifications to mitigate excessive stress concentrations. Possible solutions may include optimizing the geometry to distribute stress more evenly, selecting a material with higher yield strength, or incorporating reinforcements in high-stress regions. Figure 18 presents the results of a von Mises stress analysis, which visualizes the equivalent stress (σeq or σvon Mises) distributed throughout the brake pad under static loading conditions. This scalar stress measure, derived from the full stress tensor, represents an equivalent uniaxial stress used to predict yielding of ductile materials. The von Mises criterion is commonly applied in engineering simulations to evaluate whether the material at any location has exceeded its yield strength. In this analysis, stress values range from approximately 9.94 × 10⁴ N/m2 (blue, low stress) to 1.214 × 10⁹ N/m2 (red, high stress), with the yield strength indicated by a red threshold line at 2.5 × 10⁸ N/m2. Regions with stress above this threshold are at risk of plastic deformation or failure, making von Mises stress a critical parameter in safety and durability assessments.
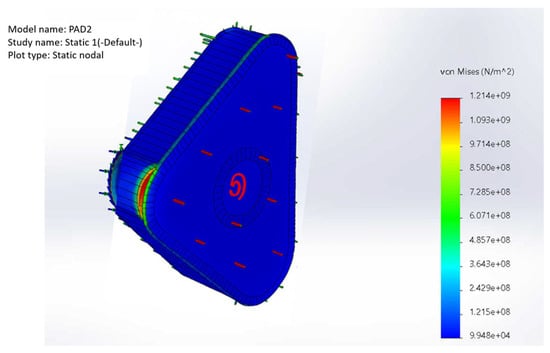
Figure 18.
Von Mises stress analysis.
The stress scale used in the analysis suggests a yield strength value of 250 MPa, but there may be discrepancies in the provided values that require further verification to ensure the accuracy of failure predictions. When the specified yield strength is lower than the actual analysis, the structure may be at an even greater risk of plastic deformation than initially estimated. Therefore, a detailed material validation is recommended to confirm the yield limit and assess whether the observed stress levels are within acceptable safety margins. The optimized maximum contact stress and maximum equivalent stress are compared with previous conditions, as shown in Table 3. This shows that the maximum contact stress after optimization is reduced by approximately 28.42%.

Table 3.
Comparison before and after optimization.
3.5. Boundary Conditions and Simulation Setup
3.5.1. Boundary Conditions
In the finite element analysis (FEA) conducted for the brake pad model, appropriate boundary conditions were defined to replicate the actual operational constraints. Fixed supports were applied to simulate the mechanical constraints where the brake pad is mounted within the caliper assembly. These constraints prevent translational and rotational movement in all directions. The free ends of the pad, not constrained by mechanical fixtures, were left to deform under the applied loads. This setup ensures that the boundary conditions accurately mimic real-world application scenarios, especially during braking operations.
3.5.2. Loading Conditions
Static loads were applied to simulate the pressure exerted during a braking event. The force was directed normal to the friction surface, corresponding to the contact between the pad and the brake disc. Based on the simulation setup, the magnitude of the applied pressure induced localized deformation and stress, particularly in regions with abrupt geometric transitions. Although the exact numeric force value was not explicitly detailed in the manuscript, the stress output reached a maximum von Mises stress of 1.214 GPa, indicating the high-intensity loading conditions used for the analysis.
3.5.3. Mesh Characteristics
The meshing process was carried out using a fine tetrahedral mesh to ensure accurate stress and deformation results. The mesh density was adjusted to balance computational cost and result precision. For the most refined models, mesh sizes were approximately in the sub-millimeter range, suitable for capturing detailed stress concentration patterns. The number of elements was sufficient to produce a smooth convergence in the simulation results, ensuring mesh independence of critical outputs like displacement and stress.
3.5.4. Computational Cost
The simulation was performed using commercial FEA software (Solidworks CAE 2025), specifically SolidWorks Simulation, on a system equipped with an Intel Core i7-1255U processor and 16 GB RAM. The complete simulation cycle, including meshing, solving, and post-processing, took approximately 3 h. The computation was optimized for accuracy, using appropriate convergence criteria and solver settings to minimize numerical errors during analysis.
3.5.5. Stress Concentration
Stress distribution analysis revealed critical regions exhibiting significantly higher stress values compared to the surrounding areas. These regions, primarily at sharp corners, material thickness transitions, and mounting holes, acted as stress risers due to geometric discontinuities. The maximum von Mises stress of 1.214 GPa—substantially exceeding the material yield strength of 250 MPa—suggested potential zones for plastic deformation and fatigue failure. These findings emphasized the importance of geometric optimization to reduce sharp transitions and implement fillets or reinforcements in high-stress areas to enhance structural durability and safety.
3.6. Result Accuracy of Brake Pad
Table 4 shows the measurement results in area 1 of the brake pad. The results were obtained using Agisoft Metashape and AI, and each was compared with measurements. The results for the brake pad measured on the virtual model are slightly larger than those for the brake pad measured on the physical model with a CMM machine. By using the mean value obtained by the CMM method as a reference, it can be observed that the maximum difference in the accuracy level obtained by the maximum error value measured by the virtual model with the reference value is 0.30 mm (on Metashape) and 0.46 mm (on AI), maximum equivalent to 1.5% (on Metashape) and 4.6% (on AI).

Table 4.
Measurement result of brake pad.
Figure 19 shows the measurement areas of a brake pad from multiple perspectives, highlighting key dimensions labeled C1 to C7. The top-left and top-right views showcase the brake pad’s structure, perforations, and attachment points, with measurements such as C1, C2, and C3 focusing on critical areas. The bottom-left view provides a side profile, emphasizing dimensions C3, C4, C5, and C6, which relate to the thickness and attachment of the pad. The bottom-right view further details measurement C7, likely indicating pad thickness or clearance. These measurements are essential for evaluating the brake pad’s performance, wear, and proper fitment.
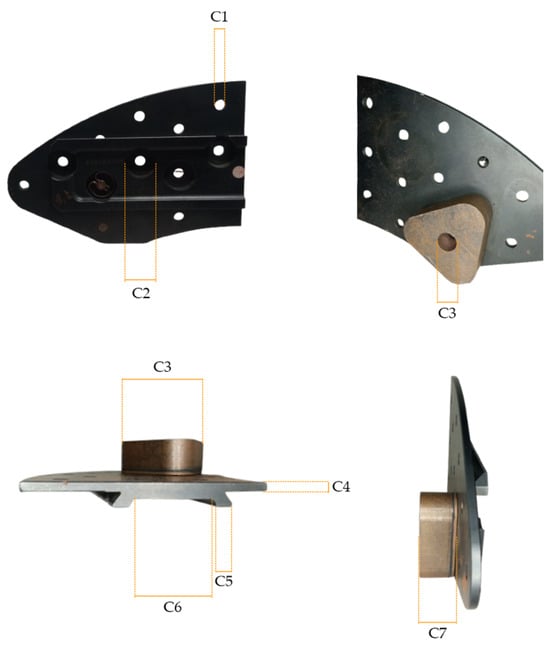
Figure 19.
Area of measurement of brake pad.
4. Conclusions
In conclusion, this study showed the effectiveness of RE softwares (Agisoft Metashape & Google Colab) in quickly reconstructing model parameters, particularly for worn or defective parts. Compared to traditional forward modeling, this method significantly reduced redesign time and enhanced product development efficiency. FEA of the brake pad showed that the initial design had a safety factor near the minimum acceptable limit, indicating a need for optimization. Structural refinements improved stress distribution and cooling, enhancing durability and braking consistency. These results show the critical role of numerical analysis in predicting failure points, refining material properties, and optimizing designs before prototyping. The method had broad applications across various industries, including automotive and aerospace, where component wear was a common issue. Additionally, RE ensured efficient redesigns, extended component lifespan, and bridged traditional manufacturing with modern digital modeling. As industries move toward smart manufacturing and predictive maintenance, this method would be essential for optimizing performance and maintaining competitiveness. Future studies should explore advanced materials, hybrid modeling, and experimental validation to further enhance component reliability. Measurement results show minimal deviations among CMM, Metashape, and AI-based methods, with errors ranging from 0.09% to 1.5% for Metashape and 0.20% to 4.60% for AI. The highest error was recorded in C3 (4.60%) using AI, while the lowest occurred in C2 (0.20%). These variations highlight the accuracy of both Metashape and AI-based measurements, although AI exhibited slightly greater discrepancies. The findings reinforce the significance of precise measurement techniques in ensuring design accuracy and reliable performance. The integration of AI-enhanced photogrammetry with parametric modeling introduced a streamlined workflow for brake pad optimization, significantly reducing modeling time while maintaining accuracy. The finite element simulations confirmed the reliability of the optimized design, particularly in mitigating stress concentration zones.
Author Contributions
Conceptualization, P.P. and R.R.; methodology, P.P.; software, M.F.; validation, P.P., M.F., and R.R.; formal analysis, P.P.; investigation, M.F.; resources, P.P.; data curation, P.P.; writing—original draft preparation, P.P.; writing—review and editing, P.P.; visualization, M.F.; supervision, R.R.; project administration, P.P.; funding acquisition, P.P. All authors have read and agreed to the published version of the manuscript.
Funding
The study was funded by the LPPM Diponegoro University under grant number 222-712/UN7.D2/PP/IV/2025 & 222-596/UN7.D2/PP/IV/2025 and LPDP/Kedaireka grant number 33/IV/KS/06/2022 & 505/UN7.D2/KS/VI/2022.
Institutional Review Board Statement
Not applicable.
Informed Consent Statement
Not applicable.
Data Availability Statement
The data presented in this study are available upon request from the corresponding author.
Acknowledgments
The authors express profound gratitude to LPDP/BRIN and LPPM Diponegoro University for the support.
Conflicts of Interest
The authors declare no conflict of interest.
References
- Yue, Z.; Sun, H.; Zhong, R.; Ma, H.; Xu, Z.; Elliott, F. Measurement of tunnel clearance convergence using mobile laser detection technology. Can. J. Remote Sens. 2021, 47, 100–118. [Google Scholar] [CrossRef]
- Mangino, E.; Carruthers, J.; Pitarresi, G. The future use of structural composite materials in the automotive industry. Int. J. Veh. Des. 2007, 44, 211–232. [Google Scholar] [CrossRef]
- Wu, Z.; Wu, S.; Qian, W.; Zhang, H.; Zhu, H.; Chen, Q.; Zhang, Z.; Guo, F.; Wang, J.; Withers, P.J. Structural integrity issues of additively manufactured railway components: Progress and challenges. Eng. Fail. Anal. 2023, 149, 107265. [Google Scholar] [CrossRef]
- Wahab, D.A.; Blanco-Davis, E.; Ariffin, A.K.; Wang, J. A review of the applicability of remanufacturing in extending the life cycle of marine or offshore components and structures. Ocean Eng. 2018, 169, 125–133. [Google Scholar] [CrossRef]
- Gao, W.; Zhang, Y.; Ramanujan, D.; Ramani, K.; Chen, Y.; Williams, C.B.; Wang, C.C.L.; Shin, Y.C.; Zhang, S.; Zavattieri, P.D. The status, challenges, and future of additive manufacturing in engineering. Comput.-Aided Des. 2015, 69, 65–89. [Google Scholar] [CrossRef]
- Javaid, M.; Haleem, A.; Suman, R. Digital twin applications toward industry 4.0: A review. Cogn. Robot. 2023, 3, 71–92. [Google Scholar] [CrossRef]
- Li, H.; Zhang, R.; Zheng, S.; Shen, Y.; Fu, C.; Zhao, H. Digital twin-driven intelligent operation and maintenance platform for large-scale hydro-steel structures. Adv. Eng. Inform. 2024, 62, 102661. [Google Scholar] [CrossRef]
- Maier, G.; Bocciarelli, M.; Bolzon, G.; Fedele, R. Inverse analyses in fracture mechanics. Int. J. Fract. 2006, 138, 47–73. [Google Scholar] [CrossRef]
- Maier, G.; Buljak, V.; Garbowski, T.; Cocchetti, G.; Novati, G. Mechanical characterization of materials and diagnosis of structures by inverse analyses: Some innovative procedures and applications. Int. J. Comput. Methods 2014, 11, 1343002. [Google Scholar] [CrossRef]
- Pepe, M.; Domenica, C. Techniques, tools, platforms and algorithms in close range photogrammetry in building 3D model and 2D representation of objects and complex architectures. Comput.-Aided Des. Appl. 2020, 18, 42–65. [Google Scholar] [CrossRef]
- Ortiz-Sanz, J.; Gil-Docampo, M.; Rego-Sanmartín, T.; Arza-García, M.; Tucci, G. A PBeL for training non-experts in mobile-based photogrammetry and accurate 3-D recording of small-size/non-complex objects. Measurement 2021, 178, 109338. [Google Scholar] [CrossRef]
- Mihić, M.; Sigmund, Z.; Završki, I.; Butković, L.L. An Analysis of Potential Uses, Limitations and Barriers to Implementation of 3D Scan Data for Construction Management-Related Use—Are the Industry and the Technical Solutions Mature Enough for Adoption? Buildings 2023, 13, 1184. [Google Scholar] [CrossRef]
- Yiğit, A.Y.; Uysal, M. Automatic Crack Detection and Structural Inspection of Cultural Heritage Buildings Using UAV Photogrammetry and Digital Twin Technology. J. Build. Eng. 2024, 94, 109952. [Google Scholar] [CrossRef]
- Wang, C.H. A Cost-Effective, Mobile Platform-Based, Photogrammetric Approach for Continuous Structural Deformation Monitoring. Ph.D. Dissertation, Newcastle University, Newcastle upon Tyne, UK, 2013. [Google Scholar]
- Mosbrucker, A.R.; Major, J.J.; Spicer, K.R.; Pitlick, J. Camera system considerations for geomorphic applications of SfM photogrammetry. Earth Surf. Process. Landf. 2017, 42, 969–986. [Google Scholar] [CrossRef]
- McGlade, J.; Wallace, L.; Reinke, K.; Jones, S. The potential of low-cost 3D imaging technologies for forestry applications: Setting a research agenda for low-cost remote sensing inventory tasks. Forests 2022, 13, 204. [Google Scholar] [CrossRef]
- Tavani, S.; Billi, A.; Corradetti, A.; Mercuri, M.; Bosman, A.; Cuffaro, M.; Seers, T.; Carminati, E. Smartphone assisted fieldwork: Towards the digital transition of geoscience fieldwork using LiDAR-equipped iPhones. Earth-Sci. Rev. 2022, 227, 103969. [Google Scholar] [CrossRef]
- Suo, J.; Zhang, W.; Gong, J.; Yuan, X.; Brady, D.J.; Dai, Q. Computational imaging and artificial intelligence: The next revolution of mobile vision. Proc. IEEE 2023, 111, 1607–1639. [Google Scholar] [CrossRef]
- Cheng, C.S.; Luo, L.; Murphy, S.; Lee, Y.C.; Leite, F. A framework to enhance disaster debris estimation with AI and aerial photogrammetry. Int. J. Disaster Risk Reduct. 2024, 107, 104468. [Google Scholar] [CrossRef]
- Pravallika, A.; Hashmi, M.F.; Gupta, A. Deep Learning Frontiers in 3D Object Detection: A Comprehensive Review for Autonomous Driving. IEEE Access 2024, 12, 173936–173980. [Google Scholar] [CrossRef]
- Kumar, A.; Harsha, S.P. A systematic literature review of defect detection in railways using machine vision-based inspection methods. Int. J. Transp. Sci. Technol. 2024. [Google Scholar] [CrossRef]
- Gonçalves, G. Using structure-from-motion workflows for 3D mapping and remote sensing. In Unmanned Aerial Systems for Monitoring Soil, Vegetation, and Riverine Environments; Elsevier: Amsterdam, The Netherlands, 2023; pp. 71–90. [Google Scholar]
- Jawad, A.A.; Al-Turfi, M.N.; Al-Rubaie, D.S. Enhancing Urban Building Modeling Accuracy with Drone Imagery and Ground Control Points Using SFM/MVS Techniques. Al-Iraqia J. Sci. Eng. Res. 2024, 3, 94–104. [Google Scholar]
- Qin, R.; Gruen, A. The role of machine intelligence in photogrammetric 3D modeling–an overview and perspectives. Int. J. Digit. Earth 2021, 14, 15–31. [Google Scholar] [CrossRef]
- Zhang, J.; Huang, M.; Wan, N.; Deng, Z.; He, Z.; Luo, J. Missing measurement data recovery methods in structural health monitoring: The state, challenges and case study. Measurement 2024, 231, 114528. [Google Scholar] [CrossRef]
- Vijendran, M.; Deng, J.; Chen, S.; Ho, E.S.; Shum, H.P. Artificial intelligence for geometry-based feature extraction, analysis and synthesis in artistic images: A survey. Artif. Intell. Rev. 2024, 58, 64. [Google Scholar] [CrossRef]
- Altman, S.; Xiao, W.; Grayson, B. Evaluation of low-cost terrestrial photogrammetry for 3D reconstruction of complex buildings. ISPRS Ann. Photogramm. Remote Sens. Spat. Inf. Sci. 2017, 4, 199–206. [Google Scholar] [CrossRef]
- Ge, Y.; Chen, K.; Liu, G.; Zhang, Y.; Tang, H. A low-cost approach for the estimation of rock joint roughness using photogrammetry. Eng. Geol. 2022, 305, 106726. [Google Scholar] [CrossRef]
- Swornowski, P.J. A critical look at the coordinate measuring technique. Mechatronics 2013, 23, 80–93. [Google Scholar] [CrossRef]
- Mutilba, U.; Gomez-Acedo, E.; Kortaberria, G.; Olarra, A.; Yagüe-Fabra, J.A. Traceability of on-machine tool measurement: A review. Sensors 2017, 17, 1605. [Google Scholar] [CrossRef]
- Wen, X.; Wang, J.; Zhang, G.; Niu, L. Three-dimensional morphology and size measurement of high-temperature metal components based on machine vision technology: A review. Sensors 2021, 21, 4680. [Google Scholar] [CrossRef]
- Amuru, D.; Abbas, Z. AI-Assisted Circuit Design and Modeling. In AI-Enabled Electronic Circuit and System Design: From Ideation to Utilization; Springer Nature Switzerland: Cham, Switzerland, 2024; pp. 1–40. [Google Scholar]
- Lei, C.; Dang, K.; Song, S.; Wang, Z.; Chew, S.P.; Bian, R.; Yang, X.; Guan, Z.; de Lopes, C.I.M.A.; Wang, M.H.; et al. AI-assisted facial analysis in healthcare: From disease detection to comprehensive management. Patterns 2025, 6, 101175. [Google Scholar] [CrossRef]
- Onatayo, D.A.; Srinivasan, R.S.; Shah, B. Ultraviolet Radiation Transmission in Building’s Fenestration: Part II, Exploring Digital Imaging, UV Photography, Image Processing, and Computer Vision Techniques. Buildings 2023, 13, 1922. [Google Scholar] [CrossRef]
- Mazni, M.; Husain, A.R.; Shapiai, M.I.; Ibrahim, I.S.; Anggara, D.W.; Zulkifli, R. An investigation into real-time surface crack classification and measurement for structural health monitoring using transfer learning convolutional neural networks and Otsu method. Alex. Eng. J. 2024, 92, 310–320. [Google Scholar] [CrossRef]
- Yu, S.; Liu, X.; Tan, Q.; Wang, Z.; Zhang, B. Sensors, systems and algorithms of 3D reconstruction for smart agriculture and precision farming: A review. Comput. Electron. Agric. 2024, 224, 109229. [Google Scholar] [CrossRef]
- Huang, J.; Menq, C.H. Automatic CAD model reconstruction from multiple point clouds for reverse engineering. J. Comput. Inf. Sci. Eng. 2002, 2, 160–170. [Google Scholar] [CrossRef]
- Ben Makhlouf, A.; Louhichi, B.; Mahjoub, M.A.; Deneux, D. Reconstruction of a CAD model from the deformed mesh using B-spline surfaces. Int. J. Comput. Integr. Manuf. 2019, 32, 669–681. [Google Scholar] [CrossRef]
- Buonamici, F.; Carfagni, M.; Furferi, R.; Governi, L.; Lapini, A.; Volpe, Y. Reverse engineering modeling methods and tools: A survey. Comput.-Aided Des. Appl. 2018, 15, 443–464. [Google Scholar] [CrossRef]
- Buljak, V.; Cocchetti, G.; Cornaggia, A.; Maier, G. Assessment of residual stresses and mechanical characterization of materials by “hole drilling” and indentation tests combined and by inverse analysis. Mech. Res. Commun. 2015, 68, 18–24. [Google Scholar] [CrossRef]
- Buljak, V.; Cocchetti, G.; Cornaggia, A.; Maier, G. Estimation of residual stresses by inverse analysis based on experimental data from sample removal for “small punch” tests. Eng. Struct. 2017, 136, 77–86. [Google Scholar] [CrossRef]
- Buljak, V.; Cocchetti, G.; Cornaggia, A.; Maier, G. Parameter identification in elastoplastic material models by Small Punch Tests and inverse analysis with model reduction. Meccanica 2018, 53, 3815–3829. [Google Scholar] [CrossRef]
- Chang, K.H. A review on shape engineering and design parameterization in reverse engineering. In Reverse Engineering—Recent Advances and Applications; IntechOpen: London, UK, 2012; pp. 161–186. [Google Scholar]
- Raghunathan, V.; Sathyamoorthy, G.; Ayyappan, V.; Srisuk, R.; Singaravelu, D.L.; Rangappa, S.M.; Siengchin, S. Advances in brake friction materials: A comprehensive review of ingredients, processing methods, and performance characteristics. J. Vinyl Addit. Technol. 2024, 30, 1396–1431. [Google Scholar] [CrossRef]
- Zhang, P.; Wei, D.; Mei, E.; Xie, B.; Liang, Y.; Ding, X.; Zhang, L.; Qu, X. The braking performance and failure mechanism of copper-based brake pads during repeated emergency braking at 400 km/h. Wear 2024, 558, 205532. [Google Scholar] [CrossRef]
- Chowdary, B.V.; Jaglal, D. 3D CAD model reconstruction and fast prototyping of rotational parts: A reverse engineering approach. J. Eng. Des. Technol. 2023, 21, 1520–1544. [Google Scholar] [CrossRef]
- Jayal, A.D.; Badurdeen, F.; Dillon, O.W., Jr.; Jawahir, I.S. Sustainable manufacturing: Modeling and optimization challenges at the product, process and system levels. CIRP J. Manuf. Sci. Technol. 2010, 2, 144–152. [Google Scholar] [CrossRef]
- Cheung, W.M.; Marsh, R.; Griffin, P.W.; Newnes, L.B.; Mileham, A.R.; Lanham, J.D. Towards cleaner production: A roadmap for predicting product end-of-life costs at early design concept. J. Clean. Prod. 2015, 87, 431–441. [Google Scholar] [CrossRef]
- Maharana, K.; Mondal, S.; Nemade, B. A review: Data pre-processing and data augmentation techniques. Glob. Transit. Proc. 2022, 3, 91–99. [Google Scholar] [CrossRef]
- Faizin, M.; Paryanto, P.; Cahyo, N.; Rusnaldy, R. Investigating the accuracy of boat propeller blade components with reverse engineering approach using photogrammetry method. Results Eng. 2024, 22, 102293. [Google Scholar] [CrossRef]
- Louhichi, B.; Abenhaim, G.N.; Tahan, A.S. CAD/CAE integration: Updating the CAD model after a FEM analysis. Int. J. Adv. Manuf. Technol. 2015, 76, 391–400. [Google Scholar] [CrossRef]
Disclaimer/Publisher’s Note: The statements, opinions and data contained in all publications are solely those of the individual author(s) and contributor(s) and not of MDPI and/or the editor(s). MDPI and/or the editor(s) disclaim responsibility for any injury to people or property resulting from any ideas, methods, instructions or products referred to in the content. |
© 2025 by the authors. Licensee MDPI, Basel, Switzerland. This article is an open access article distributed under the terms and conditions of the Creative Commons Attribution (CC BY) license (https://creativecommons.org/licenses/by/4.0/).