Abstract
Pyrolysis is a promising thermochemical conversion process for transforming biomass waste into valuable products like bio-oil, syngas, and biochar. Understanding the thermodynamic efficiency of this process is important for optimizing its design and operation conditions. This study presents a novel approach for analyzing lignocellulosic biomass pyrolysis, including flax straw, by using conventional and advanced exergy techniques at different operating temperatures. Using Aspen Plus software, the pyrolysis process was accurately simulated, and system inefficiencies and possible areas for improvement were identified by performing both conventional and advanced exergy analysis. This study addresses the requirements to maximize the yield of valuable products, such as biochar, bio-oil, and biogas, while minimizing exergy losses. The pyrolysis reactor, cyclone, and flash were the main sources of exergy destruction, accounting for 32.2%, 31.8%, and 18.7% of the total exergy destruction, respectively. An advanced exergy analysis revealed that endogenous exergy, which is attributable to internal system irreversibilities, was the primary contributor to exergy destruction within the flax straw pyrolysis process. Notably, 35.6% of the total exergy loss can be potentially mitigated. The findings further suggest that temperature optimization has the potential to significantly reduce exergy destruction by 31.7% via enhancing reaction kinetics and overall conversion efficiency.
1. Introduction
Globally, the agricultural sector is the second-largest greenhouse gas (GHGs) contributor (19.9%) after the energy sector (68.1%) [1,2]. In this regard, the global agricultural sector, with over 5 billion tons of crop residues generated annually, holds a notable potential for the production of a wide range of bioproducts, including biomass-derived fuels [3]. However, the efficient use of biomass remains difficult, requiring more advanced conversion methods. Therefore, a sustainable recovery of lignocellulosic biomass as a renewable energy source could assist in mitigating the environmental damage caused by the combustion of fossil fuels. This has made biomass the fourth-largest energy source in the world, accounting for up to 14% of energy consumption and having the potential to reach 30% by 2050 [4]. Policy regulations like the European Union’s Renewable Energy Directive also aim to achieve a 42.5% share of renewable energy by 2030 [5,6]. At the same time, biomass valorization is closely linked to environmental protection, as pollutants, such as ammonia, emitted by agricultural activities and fertilizers contribute to respiratory diseases and ecosystem degradation, necessitating the use of advanced gas analysis technologies [7]. In addition to energy recovery, advances in energy storage also highlight the versatility of biomass-derived materials [8].
Thermochemical conversion of biomass includes pyrolysis, liquefaction, direct combustion, and gasification [9]. Pyrolysis, in particular, works in an oxygen-free environment and offers valuable products, including bio-oil, biogas, and biochar [10]. The distribution of these products is influenced by the process parameters, including heating rate, temperature, and residence time [11]. Depending on the applications, fast pyrolysis, which has a short residence time, produces higher bio-oil yields, whereas slow pyrolysis, which has a longer residence time, maximizes the biochar content [12,13]. For instance, slow pyrolysis of sawdust at 300 °C resulted in 63.5% of char, while fast pyrolysis produced 52.48% of bio-oil at 550 °C [13]. In addition to biomass pyrolysis, kinetic and thermogravimetric studies of co-firing sewage sludge and Ekibastuz coal demonstrated that both feedstock composition and temperature critically affect conversion and energy recovery performance [14].
Although studies have investigated pyrolysis from a chemical kinetics or reactor modeling part [15,16], comprehensive thermodynamic analysis using exergy principles—especially advanced exergy analysis—has received limited attention. According to the second law of thermodynamics, exergy is the quality of energy or its maximal capacity to work when a system is in an equilibrium state, along with its surroundings [17,18]. Advanced exergy analysis helps to determine the presence and amount of irreversibilities and inefficiencies in the exergy conversion processes by separating avoidable exergy from unavoidable exergy destruction [18]. Especially in complicated energy systems like the pyrolysis process, each component’s characteristics and exergy destruction are affected by the inefficiencies of other system elements [18]. Therefore, it becomes helpful to separate the total exergy into endogenous and exogenous exergy, wherein endogenous exergy destruction occurs due to the component under investigation and exogenous exergy depends on other system elements [19]. Integration of the pyrolysis process simulation and its exergetic analysis remain unexplored, despite its promise.
A notable exception is the work by Peters et al. [20], which focused on exergetic analysis of a fast pyrolysis process and indicated that a gas-and-char combustor causes the highest exergy destruction, due to the chemical reactions taking place in it. Furthermore, several studies conducted advanced exergy analysis of industrial plants. For example, Vučković et al. [18] showed that the steam boiler caused the highest exergy destruction in the industrial plant for rubber products, accounting for more than 80% of the total exergy destruction. Xu et al. [21] conducted conventional exergy analysis of pilot-scale pyrolysis of industrial waste for the preparation of magnesium oxide with a bischofite flow rate of 4.83 kg/s. According to their results, exergy destruction was 82.8 MW, which was mainly caused by the combustion heating–dehydration reaction (CHDR) and combustion heating–hydrolysis units, suggesting that the primary energy consumption was the combustion phase [21].
Pyrolysis modeling and exergy-based biomass system assessment have evolved in recent studies; however, gaps remain for flax-straw-specific analyses. Exergoeconomic and environmental evaluations of straw pyrolysis for corn and associated residues have been carried by Zhao et al. [22]. While hybrid solar–biomass exergy studies showed growing usage of advanced exergy and exergoeconomic tools for improvement prioritization [23], detailed TGA–FTIR kinetic analysis and thermodynamic characterization of flax straw have been reported in Vafakish et al.’s study [24]. The impact of biomass pretreatment on thermodynamic performance has been investigated in more recent feedstock-oriented exergy experiments [25].
However, few studies integrate detailed process simulations (e.g., via Aspen Plus) with both conventional and advanced exergy analyses for biomass residues like flax straw, particularly under varying operating temperatures. This represents a significant gap in the literature. The current work focuses on the simulation of flax straw (FS) pyrolysis, with the identification of primary energy efficiencies based on the analysis’ findings. Flax straw is a significant agricultural waste product in many parts of Europe, including Kazakhstan, with a high lignocellulosic content. Its current use is limited, often being burned in fields, which contributes to air pollution [26]. Using it as a feedstock for pyrolysis provides a sustainable waste-to-energy solution. Our approach involves conducting conventional exergy analysis of pyrolysis systems, followed by advanced exergy analysis to identify performance-critical components, units with relatively large irreversibilities, and avoidable losses to increase operational efficiency at various temperatures. Specifically, the process was modeled accurately by using Aspen Plus, whereas conventional and advanced exergy analysis was performed by using the literature.
2. Methodology
2.1. Simulation Description
A process model was developed using Aspen Plus (v14) for the pyrolysis of FS. The steady-state system was modeled using the Peng–Robinson–Boston–Mathias (PR-BM) thermodynamic model, based on our previous justification [17]. HCOALGEN and DCOALIGT characteristics were used to compute enthalpy and density, and flax straw was defined as a non-conventional component. Compositional, proximate, and ultimate are used to define FS feedstock, as shown in Table 1, and the values were adopted from our previous experimental work [27]. Key assumptions of the model are summarized below [28,29]:

Table 1.
Compositional, proximate, and ultimate analysis of FS [27].
- •
- Steady-state operation of all unit blocks;
- •
- Isothermal reactor conditions;
- •
- Negligible kinetic and potential exergy;
- •
- Insignificant pressure drops and heat losses.
In this work, kinetic and potential exergy were neglected because their contributions are negligible compared to the chemical and physical exergy of the pyrolysis streams. The pyrolysis system operates at low gas velocities (<1–2 m/s), under steady-state conditions, and with minimal elevation differences between units (<0.5 m). Under these conditions, thermal and chemical exergy dominate the exergy balance. This assumption is consistent with exergy analyses in the literature [28,29]. Therefore, neglecting kinetic and potential exergy is appropriate and does not influence the accuracy of the exergy destruction distribution reported in this study.
The process scheme in Aspen Plus was shown in Figure 1. The simulations consisted of biomass drying, breaking down unconventional components into primary components, pyrolyzing the biomass using the kinetic reaction model, separating solid particles (biochar), condensation and, finally, separating the gaseous and liquid products (biogas and bio-oil). Initially, the excess moisture was removed by drying the biomass feedstock at 150 °C in a stoichiometric reactor within a drier block. During the breakdown phase, a yield-based reactor (RYEILD) transformed the non-conventional component (dehydrated flax straw) into main biochemical constituents (cellulose, hemicellulose, and lignin). A kinetic reaction model was used to simulate the process. An interlinked linear reaction pathway for cellulose, hemicellulose, and lignin—the three primary constituents of biomass—was used in the pyrolysis reactor [30]. The reaction rate constants and activation energies are listed in Table 2 and the detailed properties of the reactive components are mentioned in the Supplementary Materials (Tables S1–S3) [31,32]. Using kinetic reactions, the stream of the yield reactor was transferred to a pyrolysis reactor, operating at 400 °C and one bar. Approximately 90% of the solid carbon in the pyrolysis vapor was then extracted using a cyclone. The stream was further condensed to separate gases (bio-gas) and liquid (bio-oil). As stated in the literature, the condenser’s cooling temperature was maintained at −5 °C [33].
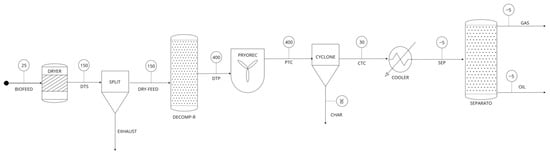
Figure 1.
Designed process flowsheet to model FS biomass pyrolysis.
Table 2.
Details of kinetic reactions used in the Aspen model (PYROREC) [30].
The kinetic network used in this study is based on pathways for the decomposition of cellulose, hemicellulose, and lignin. The reactions CELL → CELLA and CELLA → volatiles describe the primary depolymerization and fragmentation of cellulose, reflecting the two-step activation and subsequent volatilization reported by Ranzi et al. [30]. Hemicellulose is represented through parallel decomposition routes (HCE1 and HCE2), capturing its acetyl-group and sugar-fragment formation behavior. Lignin decomposition is modeled through three families of parallel pathways (LIGC, LIGH, LIGO), representing C–O and C–C bonds and the formation of phenolic, aromatic, and char-forming intermediates, which is consistent with the multistep lignin depolymerization reported in the literature. This structure reproduces the competitive interactions between primary devolatilization, intermediate rearrangement, and secondary char-forming pathways, which have been validated in multiple pyrolysis studies. The kinetic parameters (frequency factors and activation energies) for each reaction are taken directly from the original mechanism sources in Table 2.
2.2. Model Validation
The Aspen Plus model for flax straw pyrolysis was validated against the experimental data obtained from a horizontal tube furnace reactor under slow pyrolysis conditions, as shown in our previous work [27]. The reactor was heated at a rate of 30 °C/min to target temperatures (400–600 °C), with a feedstock mass of 5 g per run [27]. The model was previously validated using a batch reactor in Aspen Plus with experimental data [17]. Henceforth, all the analysis presented in this work was based on a batch reactor with an equivalent of 100 kg/h as the mass flow of the flax straw. The kinetic model incorporated 21 reactions, based on the decomposition pathways of cellulose, hemicellulose, and lignin, as in Table 2. Product yields (biochar, bio-oil, and biogas) from the simulation were compared with experimental values at 400 °C, as shown in Table 3.
Table 3.
Comparison of product yield in Aspen Plus simulation and experiments at 400 °C [17].
Product yields, including bio-oil, syngas, and char, were compared to simulation outputs, and demonstrated model reliability that was generally within 5% of relative error. It is noted that a slightly higher deviation (5.8%) was observed for the char yield at 600 °C, which is attributed to intensified secondary cracking and vapor–solid interaction effects at elevated temperatures. Nevertheless, the deviation remains within the acceptable range (±5–10%) commonly reported for biomass pyrolysis simulations in the literature, confirming that the model accuracy is appropriate for the thermodynamic and sustainability assessments conducted in this work. Product yields at different temperatures and gas compositions are included in Tables S4 and S5 in the Supplementary Materials. The relative errors originate from the following: (i) kinetic mechanism used in Aspen, which consolidates numerous tar compounds and secondary vapors into representative pseudo-components that were shown in Table S1 and (ii) intraparticle heat-transfer limitations and non-uniform heating in bench-scale experiments.
2.3. Conventional Exergy Analysis
In the development of the exergy model, the kinetic and potential exergies of the streams are disregarded, and it is considered that exergy is entirely influenced by the physical and chemical exergy [34]. Chemical exergy is the work performed to bring a component into chemical equilibrium with its surroundings, whereas physical exergy is the work performed to bring a stream to the temperature and pressure of the thermodynamic environment [18]. The specific physical exergy of the gas and liquid stream is expressed as follows [20]:
The physical exergy of the solid stream is calculated through the following [20]:
The stream’s specific chemical exergy is calculated as follows [20]:
For exergy, the term “fuel-product” is employed in the current analysis [32]. The exergy of the fuel or inlet stream, EF,k, is the exergy resource utilized in the kth component, while the exergy of the product, EP,k, is the exergy for the outlet stream [34]. Therefore, by using definitions for the exergy of the fuel and the exergy of the product, the exergy balance for the kth component is expressed at the component level in terms of ED,k, exergy destruction [34]:
EF,k = EP,k + ED,k
The exergy balance algorithm has been determined based on the pyrolysis system shown in Figure 1. Exergy efficiency can be regarded as being the criterion to assess the irreversibility of the process [34], and it is calculated by using the following relationship [35]:
εk = EP,k/EF,k
The exergy destruction ratio (yk) is expressed by the following [35]:
yk = ED,k/EF,k
For the overall system [35]:
ytot = ED,tot/EF,tot
The exergy destruction percentage within the kth component is as follows [35]:
yk* = ED,k/ED,tot
All symbols and variables appearing in Equations (1)–(16) are defined in the Nomenclature section.
2.4. Advanced Exergy Analysis
2.4.1. Exogenous and Endogenous Exergy
There are two components to the kth component destruction rate: exogenous (EX) and endogenous (EN) [35]:
ED,k = ED,kEX + ED,kEN
Kelly et al. [19] identified four ways for determining ED,kEX and ED,kEN: (1) thermodynamic cycles, (2) exergy balance, (3) engineering approach, and (4) the equivalent component method, among which thermodynamic cycles is the better approach. ED,kEN can be obtained when the kth component functions at its real efficiency, while the other components are in their ideal state [34]. Lastly, ED,kEX was computed by using the difference between the actual exergy destruction of this component and the endogenous exergy.
2.4.2. Avoidable and Unavoidable Exergy
Conventional exergy analysis can reveal the quantity of rates of destruction in systems, without providing information about the nature of these losses [36]. On the other hand, advanced exergy analysis is a relatively new technique that helps identify the factors influencing component loss and provides information on specific destructions. The unavoidable exergy destruction (ED,kUN) was defined as the minimum irreversibility achievable for each component under realistic technological constraints. These constraints were established using Aspen Plus estimates of lower-loss operating conditions. Thus, using advanced exergy analysis, the total exergy destruction of the kth component can be divided into avoidable, ED,kAV, and unavoidable, ED,kUN [36]:
ED,k = ED,kUN + ED,kAV
Through the combination of these exergies, the total exergy destruction is as follows [34]:
ED,k= ED,kUN,EX + ED,kUN,EN + ED,kAV.EX + ED,kAV.EN
The unavoidable fraction can be computed by forcing the components in the unavoidable state. Thus, unavoidable exergy destruction is calculated through the following [34]:
Subsequently, avoidable exergy was obtained by the difference between the real exergy destruction and unavoidable exergy destruction.
2.5. Sustainability Analysis
The effectiveness of the system and its influence on the environment can be assessed by using sustainability analysis [37]. In this context, the sustainability index (SI) represents the sustainability of the fuel resource, which is the inverse of the depletion number, Dp [38].
where Dp is defined in terms of exergy efficiency, ε [39]:
The waste exergy ratio,
is expressed in terms of total exergy input and total exergy destruction [39]:
The environmental impact factor is further computed as follows [39]:
3. Results and Discussion
3.1. Process Modeling and Conventional Exergy Analysis
Table 4 provides the operating conditions in block units. The pressure was set as one bar for all units and a basis of 100 kg/h of FS biomass was used for the inlet mass flow rate with the residence time of the reactor being 16.7 min.
Table 4.
Operating conditions in different block units used for the modeled pyrolysis process.
The accuracy of the model and robustness was tested based on the slow pyrolysis of FS at various temperatures, and the relative error in the product yield was about 5% [17]. The stream details, including the temperature and component flow rates of each stream, are available in the previous work. The current work focuses on exergy analysis. Exergy analysis measures the irreversibility of the entire system and assists in determining the cause of system inefficiencies. Our previous study on conventional exergy analysis revealed better efficiency for fast pyrolysis (98%), as compared to slow pyrolysis (89%) [17]. In the current work, the distribution of exergy destruction of the pyrolysis process is explored. According to Figure 2, the majority of the exergy was destructed in the pyrolysis reactor (32.2%), cyclone (31.8%), and flash (18.7%): in other words, in units wherein main products of the process, including biochar, bio-oil, and biogas, are produced and separated. High exergy destruction in the equipment can be explained by the high temperature of the working medium and the large temperature differences throughout the process. A similar observation was noted by Liu et al. [34] in their Kalina cycle modeling. According to their work, the absorption refrigeration cycle was less exergy-destructive than the Kalina cycle, with the integrated system’s efficiency being 35.52%. The authors also proposed that the high irreversible loss occurred due to the transition processes to char occurring in the reactor and cyclone.
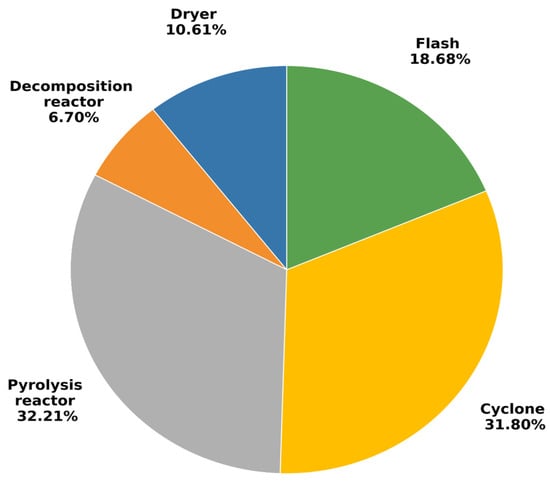
Figure 2.
Distribution of exergy destruction among different units of pyrolysis process.
Table 5 shows detailed conventional exergy results, including exergy efficiency and percentage exergy destruction of individual units of the pyrolysis process. A total exergy destruction of 467.85 W occurred in the current pyrolysis plant model. Conventional exergy analysis for the pyrolysis system has also been studied in the literature. This pattern is consistent with Peters et al. [20]. Peters et al. [20] studied the fast pyrolysis of 8.1 kg/s dry hybrid poplar wood chips with residence times of 0.5–2500 s and a temperature range of 450–650 °C. Their results showed that the exergy destruction of the overall plant was 44.57 MW. The gas-and-char combustor was the main contributor to exergy destruction, due to chemical reactions. In addition, Wang et al. [40] showed that the exergy destruction of the system was 80.42 W, in which the most considerable exergy destruction was caused by the compressor (26.27 W) and the gas cooler (21.81 W) in the double-efficient CO2 cooling and heating system. Campusano et al. [41] also found that the reactor and downstream upgrading units dominated the irreversibilities in an auger/fluidized-bed pyrolysis configuration.
Table 5.
Details of the exergy balance of each unit in the current pyrolysis system during FS pyrolysis.
3.2. Advanced Exergy Analysis Results
Table 6 below presents the details of advanced exergy analysis in terms of exo/endogeneous exergy and avoidable/unavoidable exergy of each unit of the pyrolysis process. In terms of endogenous and exogenous exergies, it can be noticed that the total endogenous exergy is 421.06 W, while the total exogenous exergy is 46.78 W. This indicated that the system’s exergy destruction was caused by the units present in the pyrolysis, and that the internal factors mainly contributed to the irreversibility of the system. These results were comparable with the results of Wang et al. [40], in which endogenous exergy (59.97 W) was approximately three times higher than exogenous exergy (20.45 W) in the dual-evaporator ejector expansion cycle. Furthermore, a system total of 166.7 W of exergy was avoidable, which was more than half of the unavoidable exergy (301.14 W). The avoidable exergy accounted for 35.6% of the overall plant, suggesting an improvement potential in the overall pyrolysis system. Moreover, the total avoidable endogenous exergy (122.94 W) was approximately three times higher than the total avoidable exogenous exergy (43.77 W). Therefore, the endogenous exergy requires more consideration in terms of potential improvement. The highest avoidable endogenous exergy accounted for the pyrolysis reactor, cyclone, and dryer, which are 58.31 W, 34.06 W, and 29.03 W, respectively. The high proportion of endogenous exergy destruction in the pyrolysis reactor is primarily due to the complex heat and mass-transfer phenomena during the decomposition of lignocellulosic biomass [41]. These phenomena include the following: (1) irreversible heat transfer between the external heat source and the biomass particles; (2) chemical reactions that are highly irreversible, particularly the bond-breaking and re-formation processes at high temperatures; and (3) mass transfer limitations as volatile products diffuse out of the porous char structure, which is a key source of irreversibility. The relatively high exergy destruction observed in the cyclone arises from the combined effects of the pressure drop [42], temperature differences across the unit, and the irreversible gas–solid separation associated with the char-rich pyrolysis vapors. An improved design cyclone with varying operational parameters, such as inlet velocity, needs to be further explored to assist in decreasing the share of exergy loss.
Table 6.
Advanced exergy (in W) distribution across different units in the pyrolysis of FS.
3.3. Improvement Potential
The exergy destruction of the pyrolysis reactor unit accounted for 32.2% of the overall exergy destruction because of chemical reactions occurring in the reactor. In comparison, in the study of Peters et al., the pyrolysis reactor was responsible for 12.0% of the overall system [20]. Using other reactor types may alter the reaction yield and, consequently, the product’s composition. Therefore, it was unlikely to substantially impact the exergy destruction caused by the chemical processes involved in the pyrolysis process [20]. Thus, the effect of the temperature on exergy destruction of the pyrolysis reactor was further examined in this study. As illustrated in Figure 3, the total exergy destruction decreases with increasing temperature.
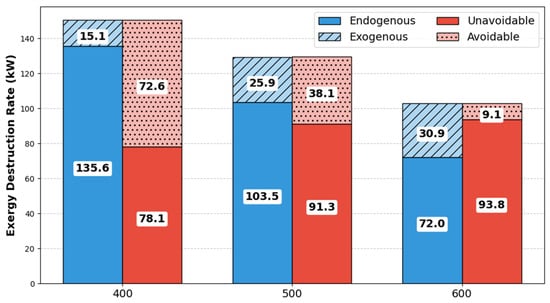
Figure 3.
Avoidable and unavoidable exergy destruction and endogenous and exogenous exergy destruction at different temperatures.
To quantify this influence, the model showed that optimizing the pyrolysis reactor temperature from 400 to 600 °C reduced the total exergy destruction by 31.7%, evidencing that temperature control is the primary factor for performance improvement. A high temperature improves the kinetics of the pyrolysis reaction, resulting in a more complete breakdown of the feedstock. As a result, conversion processes become more effective, which leads to a decrease in exergy destruction. In terms of exogenous and endogenous exergies, both decreased as the temperature increased. However, the endogenous exergy contributed significantly to the total exergy, 70–90% of total exergy destruction in the temperature range of 400–600 °C, suggesting that the irreversibility arose from internal factors.
Higher temperatures lead to more rapid reactions and, in a sense, a more complete conversion, which can reduce total exergy destruction by minimizing the potential for unconverted reactants. However, it also means that a greater proportion of the total exergy destruction becomes unavoidable, due to the higher temperature difference and the more significant irreversible chemical reactions. For instance, Wu et al. also indicated that higher preheating temperatures lead to higher irreversibility [43]. This limits the potential for future optimization, as the system is operating closer to its thermodynamic limits. This represents a classic trade-off observed in thermochemical systems, where enhanced reaction rates simultaneously introduce stronger thermal gradients and less flexible operation. Based on our results, the optimum lies at 600 °C, where the gain from reduced chemical irreversibility outweighs the increase in unavoidable destruction.
Table 7 summarizes the advanced exergy decomposition of the pyrolysis reactor across the evaluated temperature range. It should also be noted that avoidable exogenous exergy corresponded to a negative value of −1.02 W. This suggested that modifying a system can lead to unintended consequences, where the performance of individual components degraded as a result of enhancements made to other parts of the system. For instance, Hu et al. [44] showed that the evaporator had a negative exogenous avoidable exergy destruction of −29 W, indicating that the performance improvement of the other components lowers the efficiency of the system. The unavoidable exergy destruction is the irreducible portion of exergy destruction brought on by technical constraints, including manufacturing techniques, cost, and material application [45]. The unavoidable exergy was highest at 600 °C with a value of 93.78 W in our process, whereas the avoidable part was equal to 9.09 W. The unavoidable exergy increased from 78.10 W to 93.78 W as the temperature increased, suggesting that thermal effects hinder the ability to maintain desired system behavior. According to Caglayan and Caliskan [45], the only way to attain avoidable conditions was to improve the economic and technological limitations of the process. Furthermore, at 500 °C, the unavoidable endogenous exergy peaked at a value of 82.20 W, suggesting that the highest internal inefficiency was at this temperature.
Table 7.
Advanced exergy results, with respect to pyrolysis reactor temperature change.
Another potential improvement for this system is the installation of a heat exchanger in order to recover waste heat from the reactor, allowing preheating of the feedstock. This lessens the exogenous exergy destruction by enhancing heat utilization. Integrating the pyrolysis reactor with a CHP system to utilize the produced syngas for generating electricity and heat improves the overall process’ efficiency and reduces exogenous exergy destruction [20]. While the heat exchanger and CHP integration are thermodynamically advantageous, a detailed economic assessment (CAPEX/OPEX) is a necessary subject for future work before industrial implementation.
Although the cyclone exhibited significant avoidable exergy destruction, its inlet flow rate was not independently optimized in this work because cyclone hydrodynamics require CFD-based design and separation efficiency constraints beyond the scope of this thermodynamic study. Therefore, cyclone aerodynamic optimization is identified as an important direction for future work.
3.4. Sensitivity Analysis
Exergy values depend on the reference ambient (dead state) temperature, T0. Therefore, a sensitivity analysis was conducted to assess the robustness of the improved exergy decomposition, and T0 was varied from 25 °C (baseline) to 0 °C, which represents typical seasonal temperature variations in a continental climate such as Kazakhstan. The results are displayed in Table 8, below. As a result, changing T0 causes small (<1.2%) shifts in the total exergy destruction values without changing the ranking of the exergy-dominant units (reactor > cyclone > flash > dryer > decomposition reactor). The change in environmental temperature is minor compared to the reaction temperatures (400–600 °C), meaning that the driving temperature differences remain essentially unchanged. This confirms that the thermodynamic conclusions, including the improvement priorities, remain valid under realistic environmental fluctuations.
Table 8.
Sensitivity analysis summary.
3.5. Sustainability Analysis Results
The table below presents the results of the sustainability analysis of the pyrolysis process. The results showed that the environmental impact is directly influenced by exergy efficiency; as efficiency increases, the environmental impact of the process decreases [37]. The indicators in Table 9 demonstrate that exergy destruction was the primary source of environmental damage. Therefore, the highest SI value is 17.85 for slow pyrolysis at 600 °C. This value indicated that the environmental impact was the lowest at this temperature, highlighting the importance of managing exergy destruction for sustainability.
Table 9.
Environmental indicators for the slow pyrolysis process at different temperatures.
4. Conclusions
The study delivered a comprehensive exergy analysis of FS pyrolysis, concentrating on both conventional and advanced exergies. Conventional exergy analysis revealed that the primary sources of exergy destruction were the pyrolysis reactor, cyclone, and flash, accounting for 32.2%, 31.8%, and 18.7% of the overall exergy destruction, respectively. Exergy analysis was applied to determine the thermodynamic efficiency of the pyrolysis system, to locate the dominant sources of irreversibility, and to quantify avoidable versus unavoidable exergy destruction, thereby indicating which components offer the greatest potential for improvement. Advanced exergy analysis showed that the endogenous exergy (421.06 W) was substantially more than the exogenous exergy (46.78 W), suggesting that irreversibility was predominantly driven by internal system characteristics. There was a significant amount of avoidable exergy destruction (166.7 W) in the system, indicating an opportunity for improvement. The pyrolysis reactor, cyclone, and dryer had the most avoidable endogenous exergy components, indicating the critical need for endogenous exergy improvements. Our work also revealed that raising the temperature decreased the destruction of exergy but high temperature lead to decreased system controllability and an increase in unavoidable exergy. A 31.7% reduction in the total exergy destruction was achieved through temperature optimization, and it demonstrates the practical relevance of the analysis. A lower environmental impact was correlated with higher exergy efficiency, highlighting the need to control exergy destruction for sustainable operations. The slow pyrolysis process at 600 °C demonstrated the greatest sustainability indicator (SI) value, indicating that a high temperature is better for environmental performance. A comparative study of low-quality and high-quality FS will be conducted as a further investigation. Due to variations in their physical and chemical characteristics, different grades of flax straw may show differing thermochemical conversion efficiencies and product yields.
Supplementary Materials
The following supporting information can be downloaded at: https://www.mdpi.com/article/10.3390/eng6120372/s1. Table S1: Chemical components used in Aspen Plus; Table S2: Estimated Solid Property Model Parameters; Table S3: Estimated Fluid Property Model Parameters; Table S4: Product yield from simulation in Aspen Plus and experimental results; Table S5: Gas composition in Aspen Plus.
Author Contributions
Conceptualization, D.S.; methodology, A.T.; software, A.T., D.S.; validation, A.T.; formal analysis, A.T.; investigation, A.T.; resources, D.S.; data curation, Y.S., D.S.; writing-original draft preparation, A.T.; writing-review and editing, Y.S., D.S.; visualization, D.S; supervision, Y.S., D.S.; project administration, Y.S., D.S.; funding acquisition, Y.S, D.S. All authors have read and agreed to the published version of the manuscript.
Funding
This research was funded by Nazarbayev University under the Faculty development competitive research grants program for 2025–2027, grant number: 040225FD4724 (Environmental Impact of Ultrafine Particles from Sewage Sludge–Coal Co-combustion: Quantification and Mitigation).
Data Availability Statement
The original contributions presented in this study are included in the article/Supplementary Materials. Further inquiries can be directed to the corresponding author.
Conflicts of Interest
The authors declare no conflict of interest.
Nomenclature
| E | exergy flow rate, W |
| specific exergy, kJ/kg | |
| m· | mass flow rate, kg/s |
| h | specific enthalpy, kJ/kg |
| p | pressure, bar |
| s | specific entropy, kJ/kg K |
| T | temperature, K |
| y | exergy destruction ratio |
| y* | exergy destruction percentage |
| fenv | environmental factor |
| ρ | density, kg/m3 |
| Dp | depletion number |
| SI | sustainability index |
| Greek symbols | |
| ε | exergy efficiency |
| waste exergy ratio | |
| Subscripts | |
| ch | chemical |
| ph | physical |
| k | system component |
| F | fuel |
| P | product |
| D | destruction |
| tot | overall system |
| Superscripts | |
| AV | avoidable |
| UN | unavoidable |
| EN | endogenous |
| EX | exogenous |
References
- Babu, S.; Singh Rathore, S.; Singh, R.; Kumar, S.; Singh, V.K.; Yadav, S.K.; Yadav, V.; Raj, R.; Yadav, D.; Shekhawat, K.; et al. Exploring agricultural waste biomass for energy, food and feed production and pollution mitigation: A review. Bioresour. Technol. 2022, 360, 127566. [Google Scholar] [CrossRef]
- Temireyeva, A.; Zhunussova, K.; Aidabulov, M.; Shah, D.; Sarbassov, Y. Exploring the mitigation of greenhouse gas emissions from the current municipal solid waste system of Kazakhstan: Case study of Nur-Sultan city. IOP Conf. Ser. Earth Environ. Sci. 2022, 1074, 012031. [Google Scholar] [CrossRef]
- Rao, M.M.; Botsa, S.M.; Rao, T.P.; Goddu, S.R.; Vijayasanthi, C. A comprehensive review on agricultural waste production and onsite management with circular economy opportunities. Discov. Sustain. 2024, 5, 92. [Google Scholar] [CrossRef]
- Bimestre, T.A.; Castro, T.S.; Rey, J.R.C.; Reis e Silva, V.B.; Silveira, J.L. Energy and exergy analysis of a supercritical water gasification system for the simultaneous production of hydrogen, heat, and electricity from sugarcane bagasse. Next Energy 2025, 8, 100266. [Google Scholar] [CrossRef]
- United Nations Development Programme (UNDP). Circular Economy in Action. Available online: https://www.undp.org/kazakhstan/stories/circular-economy-action (accessed on 24 June 2024).
- Barlybayeva, A.; Myrzakhmetov, B.; Wang, Y.; Mentbayeva, A. Deep eutectic solvent-supported poly(vinyl) alcohol electrospun anion-exchange membrane for potential application in alkaline fuel cells. Sci. Rep. 2024, 14, 25603. [Google Scholar] [CrossRef]
- Rakhmanova, A.; Soltabayev, B.; Ajjaq, A.; Khan, N.; Kalybekkyzy, S.; Acar, S.; Mentbayeva, A. Nanofibrous ZnO-loaded PVA/PEDOT:PSS for selective and enhanced ammonia detection. Sens. Actuators B Chem. 2024, 426, 137022. [Google Scholar] [CrossRef]
- Sultanov, F.; Zhumasheva, N.; Dangaliyeva, A.; Kenzhebek, M.; Shinkarova, Y.; Tatykayev, B.; Shomenov, T.; Mentbayeva, A.; Bakenov, Z. Graphene-like porous carbon-titanium nitride composite as an efficient separator modifier for lithium-sulfur batteries. Nano Energy 2025, 145, 111420. [Google Scholar] [CrossRef]
- Halder, P.; Azad, A.K. Recent trends and challenges of algal biofuel conversion technologies. In Advanced Biofuels; Woodhead Publishing: Cambridge, UK, 2019; pp. 167–179. [Google Scholar] [CrossRef]
- Oyeleke, O.R.; Hu, Y.; Naterer, G.F. Effects of potassium salt on cellulose pyrolysis: Biochar production, kinetic triplet, and thermodynamic properties. Chem. Eng. Sci. 2025, 313, 121787. [Google Scholar] [CrossRef]
- Hasan, M.M.; Rasul, M.; Khan, M.I. The effects of slow and fast pyrolysis on the yields and properties of produced bio-oils from macadamia nutshell. AIP Conf. Proc. 2022, 2681, 020014. [Google Scholar] [CrossRef]
- Nagawkar, B.R.; Subramaniam, S.; Brown, R.C.; Passalacqua, A. Computational models for the prediction of yields in the autothermal pyrolysis of biomass. Chem. Eng. Sci. 2025, 311, 121599. [Google Scholar] [CrossRef]
- Jaroenkhasemmeesuk, C.; Tippayawong, N.; Shimpalee, S.; Ingham, D.B.; Pourkashanian, M. Improved simulation of lignocellulosic biomass pyrolysis plant using chemical kinetics in Aspen Plus® and comparison with experiments. Alex. Eng. J. 2023, 63, 199–209. [Google Scholar] [CrossRef]
- Aidabulov, M.; Zhakupov, D.; Zhunussova, K.; Temireyeva, A.; Shah, D.; Sarbassov, Y. Thermal characterization, kinetic analysis and co-combustion of sewage sludge coupled with high-ash Ekibastuz coal. Energies 2023, 16, 6634. [Google Scholar] [CrossRef]
- Kan, T.; Strezov, V.; Evans, T.J. Lignocellulosic biomass pyrolysis: A review of product properties and effects of pyrolysis parameters. Renew. Sustain. Energy Rev. 2016, 57, 1126–1140. [Google Scholar] [CrossRef]
- Potnuri, R.; Suriapparao, D.V.; Rao, C.S.; Kumar, T.H. Understanding the role of modeling and simulation in pyrolysis of biomass and waste plastics: A review. Bioresour. Technol. Rep. 2022, 20, 101221. [Google Scholar] [CrossRef]
- Temireyeva, A.; Sarbassov, Y.; Shah, D. Process simulation of flax straw pyrolysis with kinetic reaction model: Experimental validation and exergy analysis. Fuel 2024, 367, 131494. [Google Scholar] [CrossRef]
- Vučković, G.D.; Stojiljković, M.M.; Vukić, M.V.; Stefanović, G.M.; Dedeić, E.M. Advanced exergy analysis and exergoeconomic performance evaluation of thermal processes in an existing industrial plant. Energy Convers. Manag. 2014, 85, 655–662. [Google Scholar] [CrossRef]
- Kelly, S.A.; Tsatsaronis, G.; Morosuk, T. Advanced exergetic analysis: Approaches for splitting the exergy destruction into endogenous and exogenous parts. Energy 2009, 34, 384–391. [Google Scholar] [CrossRef]
- Peters, J.F.; Petrakopoulou, F.; Dufour, J. Exergetic analysis of a fast pyrolysis process for bio-oil production. Fuel Process. Technol. 2014, 119, 245–255. [Google Scholar] [CrossRef]
- Xu, H.; Dong, H.; Zhao, L.; Cheng, D. Exergy analysis and modeling of pilot-scale pyrolysis for magnesium oxide preparation from salt lake bischofite industrial waste. ACS Omega 2023, 8, 47153–47162. [Google Scholar] [CrossRef]
- Zhao, R.; Liu, S.; Li, Z.; Liu, Y.; Li, N.; Xu, P. Exergy, exergoeconomic and carbon emission analysis of a novel biomass pyrolysis system with self-heating and torrefaction. Energy 2024, 313, 133913. [Google Scholar] [CrossRef]
- Qi, X.; Yang, C.; Huang, M.; Ma, Z.; Hnydiuk-Stefan, A.; Feng, K.; Siarry, P.; Królczyk, G.; Li, Z. Conventional and advanced exergy-exergoeconomic-exergoenvironmental analyses of an organic Rankine cycle integrated with solar and biomass energy sources. Energy 2024, 288, 129657. [Google Scholar] [CrossRef]
- Vafakish, B.; Babaei-Ghazvini, A.; Ebadian, M.; Acharya, B. Pyrolysis and combustion behavior of flax straw as biomass: Evaluation of kinetic, thermodynamic parameters, and qualitative analysis of degradation products. Energies 2023, 16, 6932. [Google Scholar] [CrossRef]
- Bassey, U.; Ibrahaim, H.; Edet, E.; Narra, S.; Beck, G.; Nelles, M.; Hartmann, M. Exergy and energy analysis of pyrolysis of pretreated single-use waste plastics. Sustain. Chem. Pharm. 2025, 45, 102020. [Google Scholar] [CrossRef]
- Salmanimojaveri, M.; Naseri, M.; Madiyarova, T.; Ushakova, N.; Yessengaziyeva, K.; Sultan, G.; Adotey, E.; Zhemeney, G.; Omrani, A.D.; Jafarigol, F.; et al. A thorough exploration of cooking oil emission characteristics: Unveiling comprehensive insights. In Proceedings of the 18th International Conference on Indoor Air Quality and Climate, INDOOR AIR 2024, Honululu, HI, USA, 7–11 July 2024; Available online: https://www.scopus.com/pages/publications/85210861809 (accessed on 2 August 2025).
- Mukhambet, Y.; Shah, D.; Tatkeyeva, G.; Sarbassov, Y. Slow pyrolysis of flax straw biomass produced in Kazakhstan: Characterization of enhanced tar and high-quality biochar. Fuel 2022, 324, 124676. [Google Scholar] [CrossRef]
- Rashidi, J.; Ifaei, P.; Esfahani, I.J.; Ataei, A.; Yoo, C.K. Thermodynamic and economic studies of two new high efficient power-cooling cogeneration systems based on Kalina and absorption refrigeration cycles. Energy Convers. Manag. 2016, 127, 170–186. [Google Scholar] [CrossRef]
- Kordlar, M.A.; Mahmoudi, S.M.S.; Talati, F.; Yari, M.; Mosaffa, A.H. A new flexible geothermal based cogeneration system producing power and refrigeration, part two: The influence of ambient temperature. Renew. Energy 2019, 134, 875–887. [Google Scholar] [CrossRef]
- Ranzi, E.; Cuoci, A.; Faravelli, T.; Frassoldati, A.; Migliavacca, G.; Pierucci, S.; Sommariva, S. Chemical kinetics of biomass pyrolysis. Energy Fuels 2008, 22, 4292–4300. [Google Scholar] [CrossRef]
- Ranzi, E.; Debiagi, P.E.A.; Frassoldati, A. Mathematical modeling of fast biomass pyrolysis and bio-oil formation. Note I: Kinetic mechanism of biomass pyrolysis. ACS Sustain. Chem. Eng. 2017, 5, 2867–2881. [Google Scholar] [CrossRef]
- Gorensek, M.B.; Shukre, R.; Chen, C.C. Development of a thermophysical properties model for flowsheet simulation of biomass pyrolysis processes. ACS Sustain. Chem. Eng. 2019, 7, 9017–9027. [Google Scholar] [CrossRef]
- Hasan, M.M.; Rasul, M.G.; Jahirul, M.I.; Khan, M.M.K. Modeling and process simulation of waste macadamia nutshell pyrolysis using Aspen Plus software. Energy Rep. 2022, 8, 429–437. [Google Scholar] [CrossRef]
- Liu, Z.; Zeng, Z.; Deng, C.; Xie, N. Advanced exergy analysis of an absorption chiller/Kalina cycle integrated system for low-grade waste heat recovery. Processes 2022, 10, 2608. [Google Scholar] [CrossRef]
- Chen, J.; Havtun, H.; Palm, B. Conventional and advanced exergy analysis of an ejector refrigeration system. Appl. Energy 2015, 144, 139–151. [Google Scholar] [CrossRef]
- Dibazar, S.Y.; Salehi, G.; Davarpanah, A. Comparison of exergy and advanced exergy analysis in three different organic Rankine cycles. Processes 2020, 8, 586. [Google Scholar] [CrossRef]
- Echegaray, M.; García, D.Z.; Mazza, G.; Rodriguez, R. Air-steam gasification of five regional lignocellulosic wastes: Exergetic evaluation. Sustain. Energy Technol. Assess. 2019, 31, 115–123. [Google Scholar] [CrossRef]
- Oyedepo, S.O.; Fagbenle, R.O.; Adefila, S.S.; Alam, M.M. Thermoeconomic and thermoenvironomic modeling and analysis of selected gas turbine power plants in Nigeria. Energy Sci. Eng. 2015, 3, 423–442. [Google Scholar] [CrossRef]
- Torres, E.; Rodriguez-Ortiz, L.; Zalazar, D.; Echegaray, M.; Rodríguez, R.; Zhang, H.; Mazza, G. 4-E (environmental, economic, energetic and exergetic) analysis of slow pyrolysis of lignocellulosic waste. Renew. Energy 2020, 162, 296–307. [Google Scholar] [CrossRef]
- Wang, Z.; Fan, M.; He, G.; Zhang, Z.; Yang, W. Investigation of improvement potential of a double-efficient CO2 cooling and heating system using an ejector with advanced exergy analysis. Appl. Therm. Eng. 2024, 236, 121704. [Google Scholar] [CrossRef]
- Campusano, B.; Jabbour, M.; Abdelouahed, L.; Taouk, B. Thermodynamic analysis of biomass pyrolysis in an auger reactor coupled with a fluidized-bed reactor for catalytic deoxygenation. Processes 2025, 13, 2496. [Google Scholar] [CrossRef]
- Fahmy, M.; Lee, I.G. An exergy analysis of a laboratory-scale fast pyrolysis process design. In Exergy for A Better Environment and Improved Sustainability 1; Green Energy Technology; Springer: Cham, Switzerland, 2018; pp. 1259–1273. [Google Scholar] [CrossRef]
- Wu, Y.; Yang, W.; Blasiak, W. Energy and exergy analysis of high temperature agent gasification of biomass. Energies 2014, 7, 2107–2122. [Google Scholar] [CrossRef]
- Hu, X.; Shi, C.; Liu, Y.; Fu, X.; Ma, T.; Jin, M. Advanced exergy and exergoeconomic analysis of cascade high-temperature heat pump system for recovery of low-temperature waste heat. Energies 2024, 17, 1027. [Google Scholar] [CrossRef]
- Caglayan, H.; Caliskan, H. Advanced exergy analyses and optimization of a cogeneration system for ceramic industry by considering endogenous, exogenous, avoidable and unavoidable exergies under different environmental conditions. Renew. Sustain. Energy Rev. 2021, 140, 110730. [Google Scholar] [CrossRef]
Disclaimer/Publisher’s Note: The statements, opinions and data contained in all publications are solely those of the individual author(s) and contributor(s) and not of MDPI and/or the editor(s). MDPI and/or the editor(s) disclaim responsibility for any injury to people or property resulting from any ideas, methods, instructions or products referred to in the content. |
© 2025 by the authors. Licensee MDPI, Basel, Switzerland. This article is an open access article distributed under the terms and conditions of the Creative Commons Attribution (CC BY) license (https://creativecommons.org/licenses/by/4.0/).